High-throughput PBTK models for in vitro to in vivo extrapolation
- PMID: 34056988
- PMCID: PMC9703392
- DOI: 10.1080/17425255.2021.1935867
High-throughput PBTK models for in vitro to in vivo extrapolation
Abstract
Introduction: Toxicity data are unavailable for many thousands of chemicals in commerce and the environment. Therefore, risk assessors need to rapidly screen these chemicals for potential risk to public health. High-throughput screening (HTS) for in vitro bioactivity, when used with high-throughput toxicokinetic (HTTK) data and models, allows characterization of these thousands of chemicals.
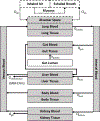
Areas covered: This review covers generic physiologically based toxicokinetic (PBTK) models and high-throughput PBTK modeling for in vitro-in vivo extrapolation (IVIVE) of HTS data. We focus on 'httk', a public, open-source set of computational modeling tools and in vitro toxicokinetic (TK) data.
Expert opinion: HTTK benefits chemical risk assessors with its ability to support rapid chemical screening/prioritization, perform IVIVE, and provide provisional TK modeling for large numbers of chemicals using only limited chemical-specific data. Although generic TK model design can increase prediction uncertainty, these models provide offsetting benefits by increasing model implementation accuracy. Also, public distribution of the models and data enhances reproducibility. For the httk package, the modular and open-source design can enable the tool to be used and continuously improved by a broad user community in support of the critical need for high-throughput chemical prioritization and rapid dose estimation to facilitate rapid hazard assessments.
Keywords: Generic physiologically based toxicokinetic models; high-throughput; in vitro to in vivo extrapolation; modeling software tools; open source tools; physiologically-based toxicokinetics; toxicokinetics.
Figures


Similar articles
-
Enabling transparent toxicokinetic modeling for public health risk assessment.PLoS One. 2025 Apr 16;20(4):e0321321. doi: 10.1371/journal.pone.0321321. eCollection 2025. PLoS One. 2025. PMID: 40238721 Free PMC article.
-
Toxicokinetic Triage for Environmental Chemicals.Toxicol Sci. 2015 Sep;147(1):55-67. doi: 10.1093/toxsci/kfv118. Epub 2015 Jun 16. Toxicol Sci. 2015. PMID: 26085347 Free PMC article.
-
Evaluating In Vitro-In Vivo Extrapolation of Toxicokinetics.Toxicol Sci. 2018 May 1;163(1):152-169. doi: 10.1093/toxsci/kfy020. Toxicol Sci. 2018. PMID: 29385628 Free PMC article.
-
Beyond traditional toxicology: The transformative power of PBTK modeling.Toxicol In Vitro. 2025 Jul 18;109:106111. doi: 10.1016/j.tiv.2025.106111. Online ahead of print. Toxicol In Vitro. 2025. PMID: 40684926 Review.
-
Advancing understanding of human variability through toxicokinetic modeling, in vitro-in vivo extrapolation, and new approach methodologies.Hum Genomics. 2024 Nov 21;18(1):129. doi: 10.1186/s40246-024-00691-9. Hum Genomics. 2024. PMID: 39574200 Free PMC article. Review.
Cited by
-
Quo vadis blood protein adductomics?Arch Toxicol. 2022 Jan;96(1):79-103. doi: 10.1007/s00204-021-03165-2. Epub 2021 Nov 13. Arch Toxicol. 2022. PMID: 34773488 Free PMC article. Review.
-
IVIVE: Facilitating the Use of In Vitro Toxicity Data in Risk Assessment and Decision Making.Toxics. 2022 May 1;10(5):232. doi: 10.3390/toxics10050232. Toxics. 2022. PMID: 35622645 Free PMC article. Review.
-
Systematic evaluation of high-throughput PBK modelling strategies for the prediction of intravenous and oral pharmacokinetics in humans.Arch Toxicol. 2024 Aug;98(8):2659-2676. doi: 10.1007/s00204-024-03764-9. Epub 2024 May 9. Arch Toxicol. 2024. PMID: 38722347 Free PMC article.
-
Cutting-edge computational chemical exposure research at the U.S. Environmental Protection Agency.Environ Int. 2023 Aug;178:108097. doi: 10.1016/j.envint.2023.108097. Epub 2023 Jul 13. Environ Int. 2023. PMID: 37478680 Free PMC article. Review.
-
Advances in computational methods along the exposure to toxicological response paradigm.Toxicol Appl Pharmacol. 2022 Sep 1;450:116141. doi: 10.1016/j.taap.2022.116141. Epub 2022 Jun 29. Toxicol Appl Pharmacol. 2022. PMID: 35777528 Free PMC article.
References
-
- Rager JE, Strynar MJ, Liang S, et al. Linking high resolution mass spectrometry data with exposure and toxicity forecasts to advance high-throughput environmental monitoring. Environment International. 2016;88:269–280. - PubMed
-
- Egeghy PP, Judson R, Gangwal S, et al. The exposure data landscape for manufactured chemicals. Science of the Total Environment. 2012. Jan 1;414:159–66. - PubMed
-
- Breyer S. Breaking the Vicious Circle: Toward Effective Risk Regulation. Harvard University Press; 2009.
Publication types
MeSH terms
Grants and funding
LinkOut - more resources
Full Text Sources
Other Literature Sources
