. 2021 Jun;9(11):e14867.
doi: 10.14814/phy2.14867.

Depletion of the gut microbiota differentially affects the impact of whey protein on high-fat diet-induced obesity and intestinal permeability

Affiliations

Depletion of the gut microbiota differentially affects the impact of whey protein on high-fat diet-induced obesity and intestinal permeability

Serena Boscaini et al. Physiol Rep. 2021 Jun.

Abstract

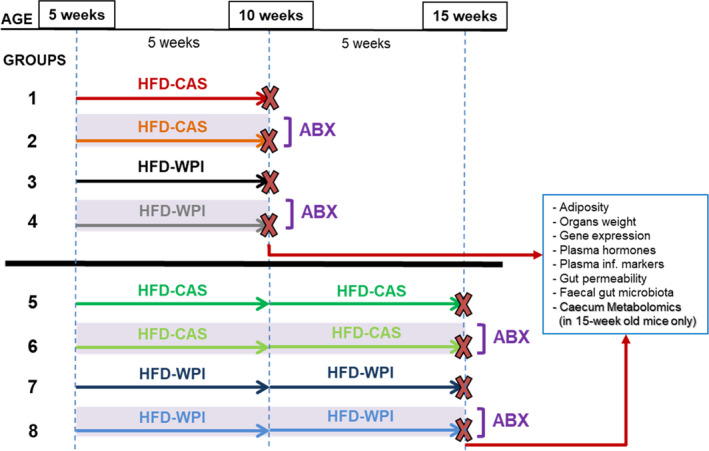
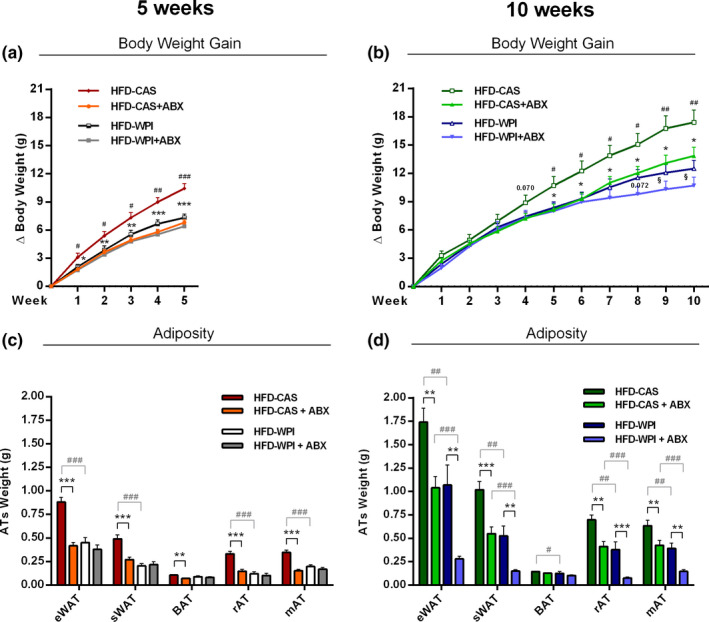
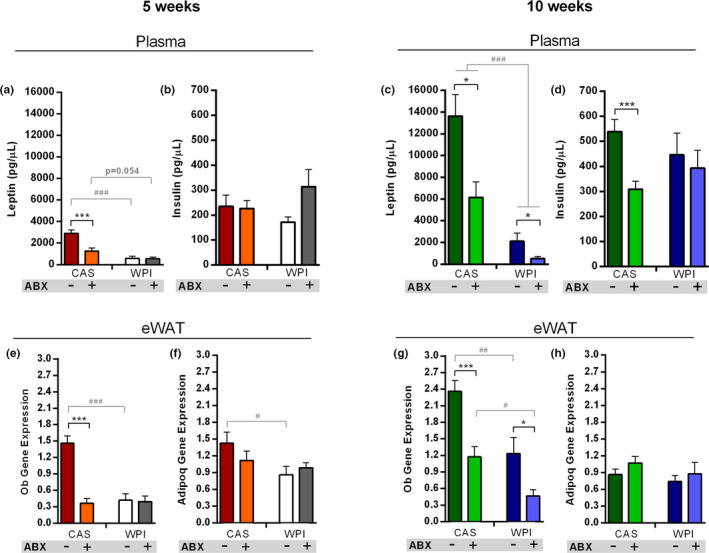
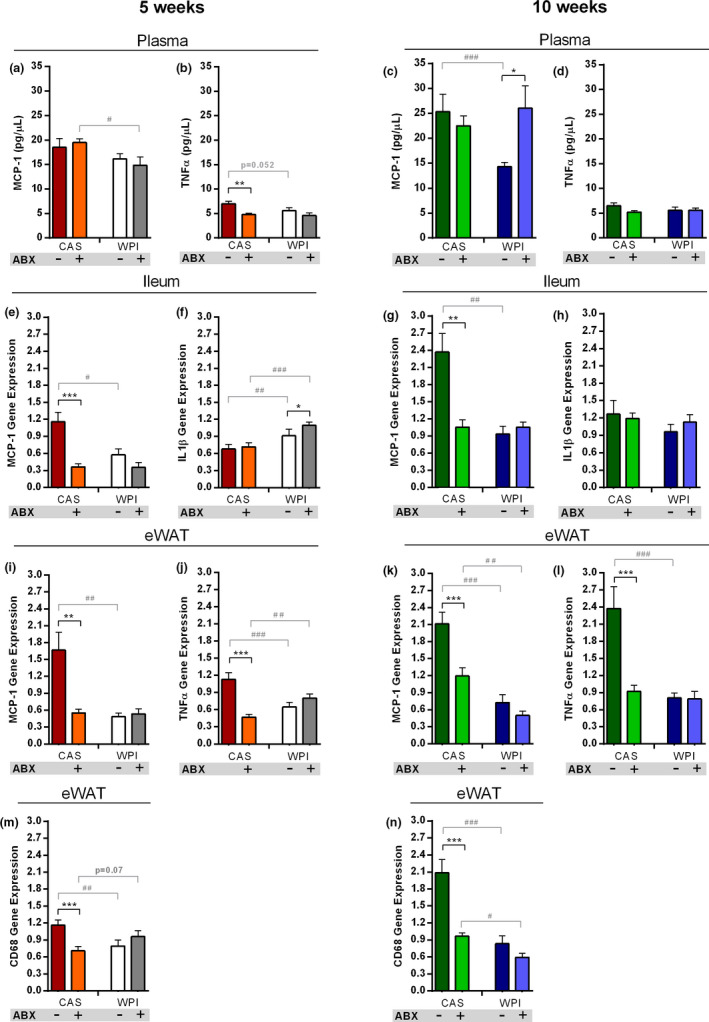
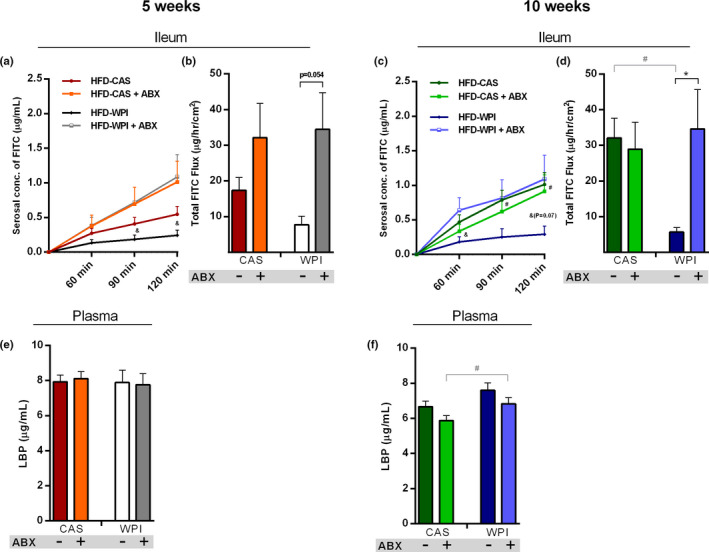
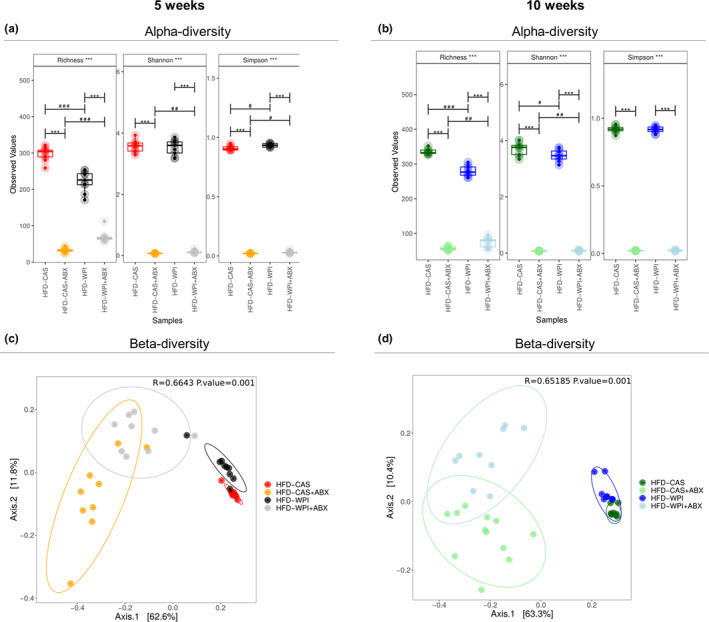
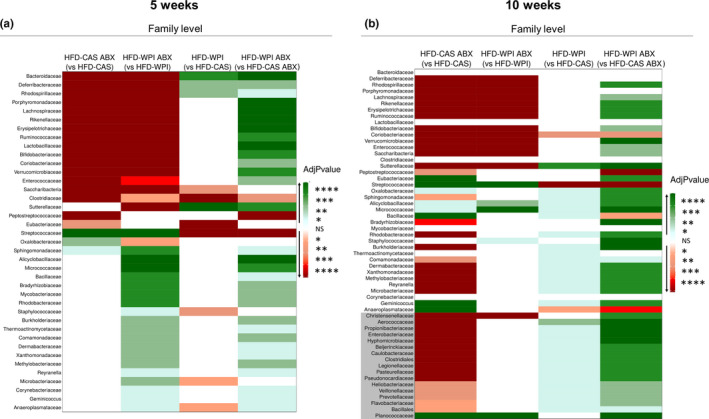
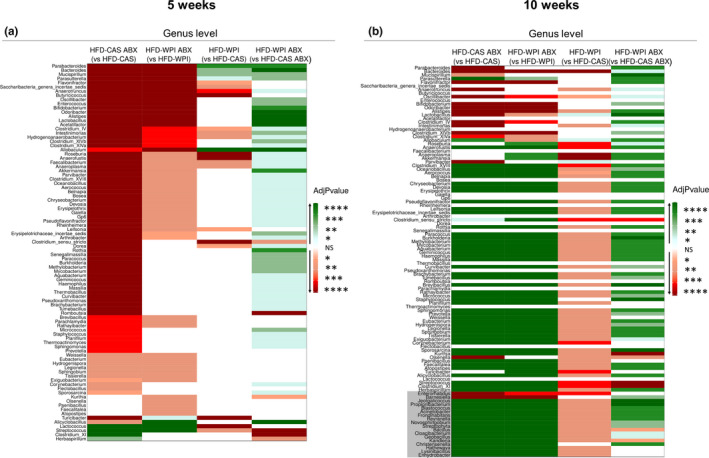
Whey protein isolate (WPI) is considered a dietary solution to obesity. However, the exact mechanism of WPI action is still poorly understood but is probably connected to its beneficial effect on energy balance, adiposity, and metabolism. More recently its ability to modulate the gut microbiota has received increasing attention. Here, we used a microbiota depletion, by antibiotic cocktail (ABX) administration, to investigate if the gut microbiota mediates the physiological and metabolic changes observed during high-fat diet (HFD)-WPI consumption. C57BL/6J mice received a HFD containing WPI (HFD-WPI) or the control non-whey milk protein casein (HFD-CAS) for 5 or 10 weeks. HFD-fed mice supplemented with WPI showed reduced body weight gain, adiposity, Ob gene expression level in the epidydimal adipose tissue (eWAT) and plasma leptin relative to HFD-CAS-fed mice, after 5- or 10-weeks intervention both with or without ABX treatment. Following 10-weeks intervention, ABX and WPI had an additive effect in lowering adiposity and leptin availability. HFD-WPI-fed mice showed a decrease in the expression of genes encoding pro-inflammatory markers (MCP-1, TNFα and CD68) within the ileum and eWAT, compared to HFD-CAS-fed mice, without showing alterations following microbiota depletion. Additionally, WPI supplementation decreased HFD-induced intestinal permeability disruption in the distal ileum; an effect that was reversed by chronic ABX treatment. In summary, WPI reverses the effects of HFD on metabolic and physiological functions through mainly microbiota-independent mechanisms. Moreover, we demonstrate a protective effect of WPI on HFD-induced inflammation and ileal permeability disruption, with the latter being reversed by gut microbiota depletion.

Keywords: adiposity; antibiotics; gut microbiota; gut permeability; high-fat diet; inflammation; metabolomics; whey protein.


Conflict of interest statement

The authors declare no conflict of interest.

Figures

FIGURE 1
FIGURE 1
Experimental design. Five‐week‐old mice were fed a high‐fat diet with control casein (HFD‐CAS; 45% fat and 20% casein) or whey protein isolate (HFD‐WPI; 45% fat and 20% whey protein isolate) for 5 (until they are 10‐week old; groups 1–4) or 10 weeks (until they are 15‐week old, groups 5–8). Groups 2, 4, 6, and 8 were provided with an antibiotic cocktail (ABX; ampicillin (1 g/L), neomycin (0.5 g/L), and vancomycin (0.35 g/L)) in drinking water for 5 or 10 weeks. The other groups (i.e., 1, 3, 5, and 7), which did not undergo ABX treatment, were considered as controls. At the end of the experiment, both at 5 and 10 weeks timepoints, several measurements were carried out. Number of mice: group 1 = 9, group 2 = 9, group 3 = 9, group 4 = 9, group 5 = 9, group 6 = 12, group 7 = 8, and group 8 = 9
FIGURE 2
FIGURE 2
Body weight gain and adiposity. The present data show body weight gain (a) at 5‐ and (b) 10‐weeks timepoints and different kinds of absolute adipose tissue weight (c) at 5‐ and (d) 10‐weeks timepoints of mice fed with HFD‐CAS and HFD‐WPI, both controls and ABX‐treated. Abbreviations: eWAT, epididymal white adipose tissue; sWAT, subcutaneous white adipose tissue; BAT, brown adipose tissue; rAT, retroperitoneal adipose tissue; mAT, mesenteric adipose tissue. Statistical analysis: (a, b) groups showing * (for HFD‐CAS vs. HFD‐CAS + ABX), # (HFD‐CAS vs. HFD‐WPI), and § (for HFD‐CAS + ABX vs. HFD‐WPI + ABX) are significant. (c, d) groups showing * (for HFD‐CAS vs. HFD‐CAS + ABX and HFD‐WPI vs. HFD‐WPI + ABX) and # (for HFD‐CAS vs. HFD‐WPI and HFD‐CAS + ABX vs. HFD‐WPI + ABX) are significant (*/#/§ p < 0.05 or **/##/§§ p < 0.01 or ***/###/§§§ p < 0.001). A complete statistical description is detailed in Section 2, “Supplementary Statistics” and Figures S4 and S6
FIGURE 3
FIGURE 3
Adipokines, insulin and leptin signaling. Data show plasma levels of (a) leptin and (b) insulin at 5 weeks timepoint and plasma levels of (c) leptin and (d) insulin at 10 weeks timepoint. Data also show (e) Ob and (f) Adipoq expression within the eWAT at 5‐weeks timepoint and (g) Ob and (h) Adipoq expression within the eWAT at 10‐weeks timepoint. All the data were measured in mice fed with HFD‐CAS and HFD‐WPI, both controls and ABX‐treated. Abbreviations: eWAT, epididymal white adipose tissue; Ob, leptin; Adipoq, adiponectin. Groups showing * (for HFD‐CAS vs HFD‐CAS + ABX and HFD‐WPI vs. HFD‐WPI + ABX) and # (for HFD‐CAS vs HFD‐WPI and HFD‐CAS + ABX vs. HFD‐WPI + ABX) are significant (*/# p < 0.05 or **/## p < 0.01 or ***/### p < 0.001). A complete statistical description is detailed in Section 2 and Figures S5 and S6
FIGURE 4
FIGURE 4
Pro‐inflammatory cytokines levels. Data show plasma levels of (a) MCP‐1 and (b) TNFα at 5 weeks timepoint and plasma levels of (c) MCP‐1 and (d) TNFα at 10 weeks timepoint. Data also show (e) Mcp‐1 and (f) Il1β ileal expression at 5‐weeks timepoint and (g) Mcp‐1 and (h) Il1β ileal expression at 10 weeks timepoint. In addition, it is reported (i) Mcp‐1 and (j) Tnfα expression within the eWAT at 5 weeks timepoint and (k) Mcp‐1 and (l) Tnfα expression within the eWAT at 10 weeks timepoint. The final graph shows the expression of Cd68 within the eWAT at (m) 5‐ and (n) 10‐weeks timepoint. All the data were measured in mice fed with HFD‐CAS and HFD‐WPI, both controls and ABX‐treated. Abbreviations: CD68, cluster of differentiation 68; eWAT, epididymal white adipose tissue; IL1β, interleukin 1 beta; MCP‐1, monocyte chemoattractant protein 1; TNFα, tumor necrosis factor alpha. Groups showing * (for HFD‐CAS vs HFD‐CAS+ABX and HFD‐WPI vs. HFD‐WPI+ABX) and # (for HFD‐CAS vs. HFD‐WPI and HFD‐CAS+ABX vs. HFD‐WPI+ABX) are significant (*/# p < 0.05 or **/## p < 0.01 or ***/### p < 0.001). A complete statistical description is detailed in Section 2 and Figures S5 and S6
FIGURE 5
FIGURE 5
Intestinal permeability. Data show (a) ileal FITC paracellular permeability at 60, 90, and 120 min and (b) the total FITC flux that passed through the ileal epithelium over 2 h, at 5‐weeks timepoint. Data also show (c) ileal FITC paracellular permeability at 60, 90, and 120 min and (d) the total FITC flux that passed through the ileal epithelium over 2 h, at 10‐weeks timepoint. The final graph shows the plasma level of LBP (e) 5‐ and (f) 10‐weeks timepoint. All the data were measured in mice fed with HFD‐CAS and HFD‐WPI, both controls and ABX‐treated. Abbreviation: FITC, fluorescein isothiocyanate; LBP, lipopolysaccharide binding protein. Statistical analysis: (a, c) groups showing # (HFD‐CAS vs. HFD‐WPI) and & (for HFD‐WPI vs. HFD‐WPI + ABX) are significant. (b and d–f) groups showing * (for HFD‐CAS vs. HFD‐CAS + ABX and HFD‐WPI vs. HFD‐WPI + ABX) and # (for HFD‐CAS vs. HFD‐WPI and HFD‐CAS + ABX vs. HFD‐WPI + ABX) are significant (*/#/& p < 0.05 or **/##/&& p < 0.01 or ***/###/&&& p < 0.001). A complete statistical description is detailed in Section 2, “Supplementary Statistics” and Figures S5 and S6
FIGURE 6
FIGURE 6
Gut microbiota analysis: alpha‐ and beta‐diversity. Taxonomic alpha‐diversity, measured with richness, Shannon and Simpson indexes at (a) 5‐ and (b) 10‐weeks timepoints. Beta‐diversity of all groups, calculated using PCoA ordination at (c) 5‐ and (d) 10‐weeks timepoints. All the data were measured in mice fed with HFD‐CAS and HFD‐WPI, both controls and ABX‐treated. Groups showing * (for control vs. ABX‐treated) and # (CAS vs. WPI) are significant (*/# p < 0.05 or **/## p < 0.01 or ***/### p < 0.001 or ****/#### p < 0.0001). A complete statistical description is detailed in Section 2
FIGURE 7
FIGURE 7
Gut microbiota analysis: taxonomic differences at family level abundance. Heatmaps representing taxonomic pairwise differences in relative abundance at family level across the groups, using Kruskal Wallis method (a) at 5‐ and (b) 10‐weeks timepoint. Notably, green and red colors represent an increase and a decrease, respectively, in relative abundance of a specific group (not in brackets) compared to another group (in brackets). White color indicates no significant differences (NS) between the two groups. The shades of each color correspond to different p values thresholds. In (b), the families that did not show differences at 5‐weeks timepoint but that showed differences at 10‐weeks timepoint are indicated with a gray background. All the data were measured in mice fed with HFD‐CAS and HFD‐WPI, both controls and ABX‐treated. Groups showing * are significant (*p < 0.05 or **p < 0.01 or ***p < 0.001 or ****p < 0.0001). A complete statistical description is detailed in Section 2
FIGURE 8
FIGURE 8
Gut microbiota analysis: taxonomic differences in genera abundance. Data show the heatmaps representing taxonomic pairwise differences in relative abundance at genus level across the groups, using Kruskal Wallis method (a) at 5‐ and (b) 10‐weeks timepoint. Notably, green and red colors represent an increase and a decrease, respectively, in relative abundance of a specific group (not in brackets) compared to another group (in brackets). White color indicates no differences between the two groups. The shades of each color correspond to different p values thresholds. In (b), the genera that did not show differences at 5‐weeks timepoint but that showed differences at 10‐weeks timepoint are indicated with a grey background. All the data were measured in mice fed with HFD‐CAS and HFD‐WPI, both controls and ABX‐treated. Groups showing * are significant (*p < 0.05 or **p < 0.01 or ***p < 0.001 or ****p < 0.0001). A complete statistical description is detailed in Section 2
FIGURE 9
FIGURE 9
Metabolites changes in the caecum at 10 weeks timepoint ‐ part 1. The heatmaps show metabolites measured within the caecum content, where the changes observed across the groups are related to (a) ABX treatment and (b) protein quality. Notably, orange and blue colors represent an increase and a decrease, respectively, in abundance of group 1 compared to group 2 (below in each heatmap: Group1 vs. Group 2). On the left side of the heatmaps are indicated the categories in which the metabolites belong to. 7‐M‐3‐me‐6‐(3‐o)‐3,3a,4,7,8,8a‐h‐2H‐cy[b]furan‐2‐one; 7‐Methyl‐3‐methylene‐6‐(3‐oxobutyl)‐3,3a,4,7,8,8a‐hexahydro‐2H‐cyclohepta[b]furan‐2‐one. Groups showing * are significant (*p < 0.05 or **p < 0.01 or ***p < 0.001) and $ indicates a trend (0.05 < p > 0.07). A complete statistical description is detailed in Section 2
FIGURE 10
FIGURE 10
Metabolites changes in the caecum at 10‐weeks timepoint—part 2. The heatmaps show metabolites measured within the caecum content, where the changes observed across the groups are related to (a) both ABX treatment and protein quality. Also reported (b) a heatmaps with changes in one pairwise comparison. Notably, orange and blue colors represent an increase and a decrease, respectively, in abundance of group 1 compared to group 2 (below in each heatmap: Group1 vs. Group 2). On the left side of the heatmaps are indicated the categories in which the metabolites belong to. Abbreviations: (8aR,12S,12aR)‐12‐H‐4‐m‐4,5,6,7,8,8a,12,12a‐o‐2H‐3‐b‐2,9(1H)‐d; (8aR,12S,12aR)‐12‐Hydroxy‐4‐methyl‐4,5,6,7,8,8a,12,12a‐octahydro‐2H‐3‐benzoxecine‐2,9(1H)‐dione. Groups showing * are significant (*p < 0.05 or **p < 0.01 or ***p < 0.001) and $ indicates a trend (0.05 < p > 0.07). A complete statistical description is detailed in Section 2

Similar articles

Cited by

References

    1. Araújo, J. R. , Tomas, J. , Brenner, C. , & Sansonetti, P. J. (2017). Impact of high‐fat diet on the intestinal microbiota and small intestinal physiology before and after the onset of obesity. Biochimie, 141, 97–106. - PubMed
    1. Aronesty, E. (2013). Comparison of sequencing utility programs. The Open Bioinformatics Journal, 7, 1–8.
    1. Bansal, Y. , Singh, R. , Parhar, I. , Kuhad, A. , & Soga, T. (2019). Quinolinic acid and nuclear factor erythroid 2‐related factor 2 in depression: Role in neuroprogression. Frontiers in Pharmacology, 10. 10.3389/fphar.2019.00452 - DOI - PMC - PubMed
    1. Benjamin, J. , Makharia, G. , Ahuja, V. , Anand Rajan, K. D. , Kalaivani, M. , Gupta, S. D. , & Joshi, Y. K. (2012). Glutamine and whey protein improve intestinal permeability and morphology in patients with Crohn’s Disease: A randomized controlled trial. Digestive Diseases and Sciences, 57(4), 1000–1012. - PubMed
    1. Bergia, R. E. 3rd , Hudson, J. L. , & Campbell, W. W. (2018). Effect of whey protein supplementation on body composition changes in women: A systematic review and meta‐analysis. Nutrition Reviews, 76(7), 539–551. - PubMed

Publication types

MeSH terms

LinkOut - more resources