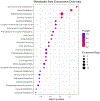
A metabolome and microbiome wide association study of healthy eating index points to the mechanisms linking dietary pattern and metabolic status
- PMID: 34057579
- PMCID: PMC8572162
- DOI: 10.1007/s00394-021-02599-9
A metabolome and microbiome wide association study of healthy eating index points to the mechanisms linking dietary pattern and metabolic status
Abstract
Background: Healthy eating index (HEI), a measure of diet quality, associates with metabolic health outcomes; however, the molecular basis is unclear. We conducted a multi-omic study to examine whether HEI associates with the circulatory and gut metabolome and investigated the gut microbiome-HEI interaction on circulating and gut metabolites.
Methods: Through a cross-sectional study, we evaluated diet quality in healthy individuals [the ABO Glycoproteomics in Platelets and Endothelial Cells (ABO) Study, n = 73], metabolites (measured at Metabolon Inc.) in plasma (n = 800) and gut (n = 767) and the gut microbiome at enterotype and microbial taxa (n = 296) levels. Pathway analysis was conducted using Metaboanalyst 4.0. We performed multi-variable linear regression to explore both the HEI-metabolites and HEI-microbiome associations and how metabolites were affected by the HEI-microbiome interaction. In the Fish oils and Adipose Inflammation Reduction (FAIR) Study (n = 25), analyses on HEI and plasma metabolites were replicated. Estimates of findings from both studies were pooled in random-effects meta-analysis.
Results: The HEI-2015 was associated with 74 plasma and 73 gut metabolites (mostly lipids) and with 47 metabolites in the meta-analysis of the ABO and FAIR Studies. Compared to Enterotype-1 participants, those with Enterotype-2 had higher diet quality (p = 0.01). We also identified 9 microbial genera associated with HEI, and 35 plasma and 40 gut metabolites linked to the HEI-gut microbiome interaction. Pathways involved in the metabolism of polar lipids, amino acids and caffeine strongly associated with diet quality. However, the HEI-microbiome interaction not only influenced the pathways involved in the metabolism of branch-chain amino acids, it also affected upstream pathways including nucleotide metabolism and amino acids biosynthesis.
Conclusions: Our multi-omic analysis demonstrated that changes in metabolism, measured by either circulatory/gut metabolites or metabolic pathways, are influenced by not only diet quality but also gut microbiome alterations shaped by the quality of diet consumed. Future work is needed to explore the causality in the interplay between HEI and gut-microbiome composition in metabolism.
Keywords: Diet quality; Healthy eating index; Metabolic pathway; Metabolome; Microbiome; Multi-omic study.
© 2021. Springer-Verlag GmbH Germany, part of Springer Nature.
Conflict of interest statement
The authors have no conflicts of interest to disclose.
Figures


References
-
- George SM, Ballard-Barbash R, Manson JE, et al. (2014) Comparing indices of diet quality with chronic disease mortality risk in postmenopausal women in the Women’s Health Initiative Observational Study: evidence to inform national dietary guidance. Am J Epidemiol 180:616–625. 10.1093/aje/kwu173 - DOI - PMC - PubMed
Publication types
MeSH terms
Grants and funding
LinkOut - more resources
Full Text Sources
Other Literature Sources

