. 2021 May 31;27(6):191.
doi: 10.1007/s00894-021-04779-0.

Plausible blockers of Spike RBD in SARS-CoV2-molecular design and underlying interaction dynamics from high-level structural descriptors

Affiliations

Plausible blockers of Spike RBD in SARS-CoV2-molecular design and underlying interaction dynamics from high-level structural descriptors

Sankar Basu et al. J Mol Model. .

Abstract

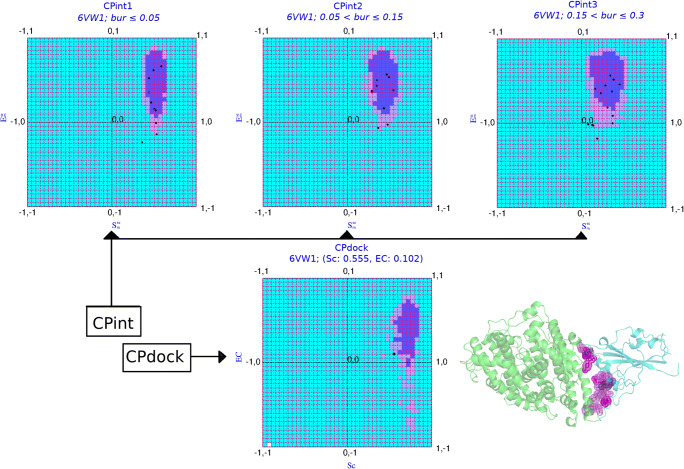
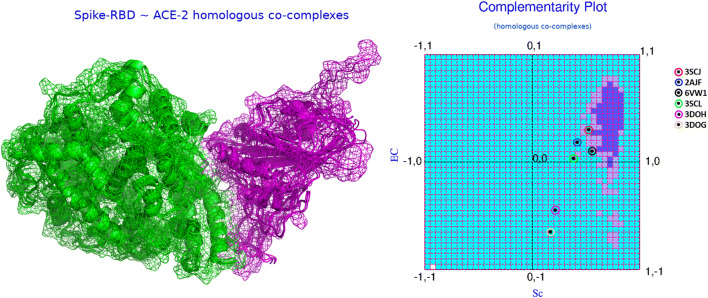
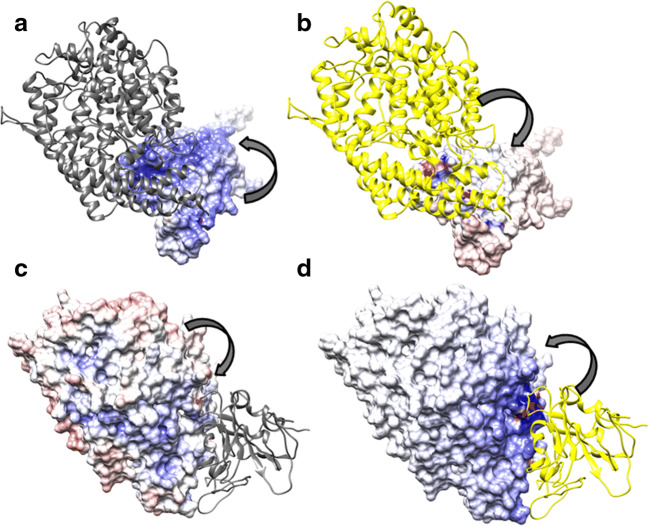
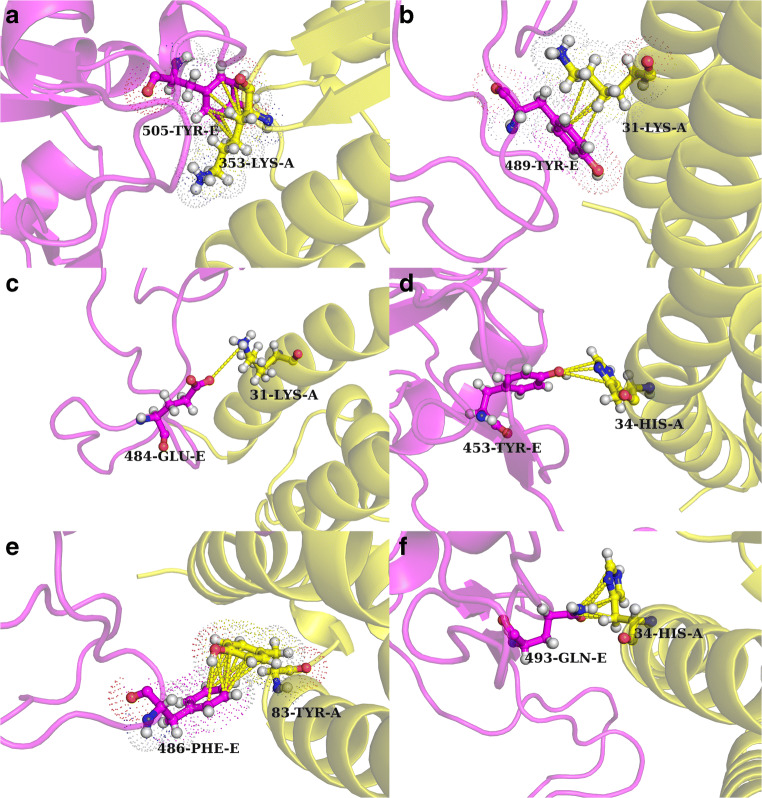
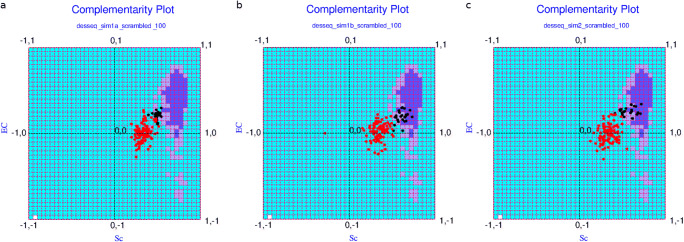
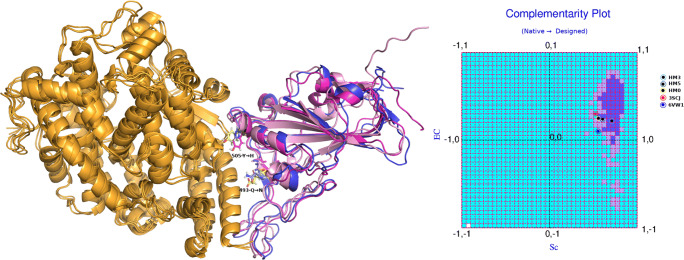
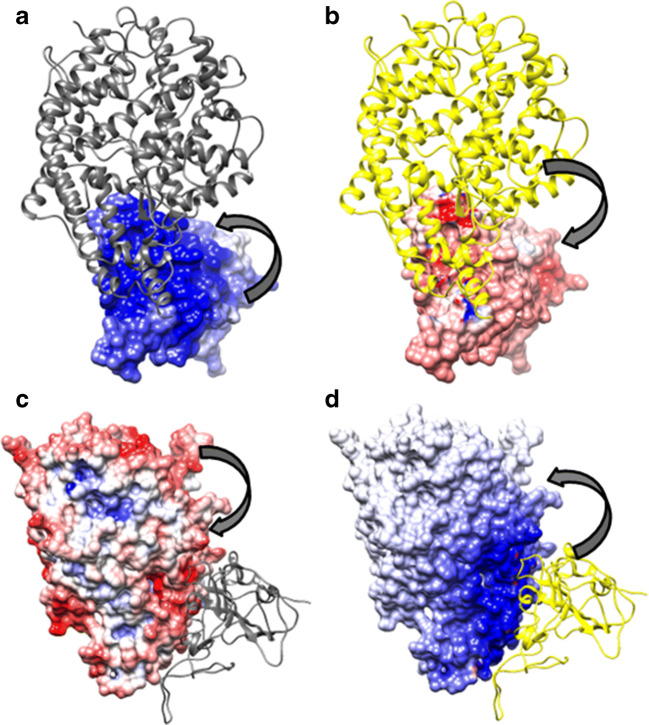
COVID-19 is characterized by an unprecedented abrupt increase in the viral transmission rate (SARS-CoV-2) relative to its pandemic evolutionary ancestor, SARS-CoV (2003). The complex molecular cascade of events related to the viral pathogenicity is triggered by the Spike protein upon interacting with the ACE2 receptor on human lung cells through its receptor binding domain (RBDSpike). One potential therapeutic strategy to combat COVID-19 could thus be limiting the infection by blocking this key interaction. In this current study, we adopt a protein design approach to predict and propose non-virulent structural mimics of the RBDSpike which can potentially serve as its competitive inhibitors in binding to ACE2. The RBDSpike is an independently foldable protein domain, resilient to conformational changes upon mutations and therefore an attractive target for strategic re-design. Interestingly, in spite of displaying an optimal shape fit between their interacting surfaces (attributed to a consequently high mutual affinity), the RBDSpike-ACE2 interaction appears to have a quasi-stable character due to a poor electrostatic match at their interface. Structural analyses of homologous protein complexes reveal that the ACE2 binding site of RBDSpike has an unusually high degree of solvent-exposed hydrophobic residues, attributed to key evolutionary changes, making it inherently "reaction-prone." The designed mimics aimed to block the viral entry by occupying the available binding sites on ACE2, are tested to have signatures of stable high-affinity binding with ACE2 (cross-validated by appropriate free energy estimates), overriding the native quasi-stable feature. The results show the apt of directly adapting natural examples in rational protein design, wherein, homology-based threading coupled with strategic "hydrophobic ↔ polar" mutations serve as a potential breakthrough.

Keywords: COVID-19; Competitive inhibitor; Complementarity; Homology-based threading in rational protein design; Protein design; SARS-CoV-2.


Conflict of interest statement

N/A

Figures

Fig. 1
Fig. 1
The Complementarity Plots (CPint and CPdock). The composite figure represents the two variants of the Complementarity Plot CPint and CPdock. CPint (upper panel) is the residue-wise plot, plotting the residue-wise complementarity estimates, Sm vs. Em [43] for interfacial residues—which is further distributed into three sub-plots (CPint1, CPint2, CPint3) based on their burial of solvent exposure (bur) of the plotted residues. CPdock (lower panel) is for the whole interface {Sc, EC}. The inner island colored in “purple,” the outer rim in “mauve,” and the rest in “sky blue” corresponds to the “probable,” “less probable,” and “improbable” regions of the plots. The pictorial demonstration is made on the very structure of 6VW1 (i.e., the RBDSpike–ACE2 complex in CoV-2) displayed at the right-bottom of the composite diagram. The interfacial residues of the ligand (RBDSpike: cyan cartoon) which are in physical contact with the receptor (ACE2: orange-yellow) are presented as their van der Waal’s dot surfaces colored according to their corresponding residences in CPint (“probable”: violet, “less probable”: magenta, “improbable”: violet-purple)
Fig. 2
Fig. 2
The dynamics of RBDSpike–ACE2 binding from complementarity estimates. The left panel of the figure shows the superposed RBDSpike–ACE2 binary complexes from the homologs (see the “Evolution of the CoV-2 RBDSpike–ACE2 interaction dynamics” section) in cartoon covered with mesh representation. The receptors and the ligands are colored in green and magenta, respectively. The right panel shows the mapping of their corresponding {Sc, EC} points in CPdock as per mentioned in the embedded legend
Fig. 3
Fig. 3
Electrostatic surface of the native RBDSpike–ACE2 binary complex. a and b Map the electrostatic potential surface of the ligand due to the electric fields coming from the ligand itself (self) and the receptor (partner), respectively. Likewise, c and d map the electrostatic surface of the receptor due to the electric fields coming from the receptor (self) and the ligand (partner), respectively. Atomic coordinates of the RBDSpike–ACE2 binary complex are taken from PDB ID: 6VW1. In each panel, the thick arrows indicate whether the surface potentials are due to “self” (a, c) or “partner” (b, d). Further, in each panel, the molecular partner represented as “cartoon” is colored “yellow,” if it is contributing to the potential (i.e., in case of partner-potentials), and, “dim gray” otherwise (self-potentials). The electrostatic surface coloring was done in Chimera [81] using Delphi [41] electrostatic focusing files (.cube) with a color scale set to −10 kT/e for “pure blue” to +10 kT/e for “pure red.” As can be seen, there is very little match of counter-colors (red and blue’s) between corresponding patches on both “contact surfaces” (ligand and receptor) due their respective self- and partner-potentials—which means weak anti-correlation due to unfavorable electrostatic interactions. The potential values portrayed in a and b yields EC1,2 = 0.055 while those portrayed in c and d yields EC2,1 = 0.149 (where, 1 and 2 in the subscripts of EC refer to the ligand and the receptor, respectively) together leading to EC = 0.102 (see Eq. 2 and the “Comparative stability of the RBDSpike conformers influencing their switch” section)
Fig. 4
Fig. 4
Analogous binary PPI complexes of SARS-CoV-2-RBDSpike–ACE2 in MERS and Ebola: dynamics of binding from complementarity. The upper and lower panels of the figure represent the binary complexes in MERS (PDB ID: 4L72) and Ebola (PDB ID: 5F1B), respectively, their structures on the left and the corresponding mapping of their {Sc, EC} points in CPdock on the right
Fig. 5
Fig. 5
The RBDSpike–ACE2 interface in SARS-CoV-2: non-trivial interactions. a and b Extended packing between aromatic rings and consecutively connected mythelene groups of elongated charged amino acids. c The only salt-bridge found at the interface. d and f Instances of polar atom-mediated interactions involving an aromatic ring while e presents aromatic stacking with a slide and an open angle. Atomic coordinates of the RBDSpike–ACE2 binary complex are taken from PDB ID: 6VW1
Fig. 6
Fig. 6
The solution space: from alteration of hydrophobic character to homology-based design. a, b, and c The solution space for strategies 1a, 1b, and 2, respectively (as referred in sections “Design strategy-1: altering the hydrophobic character of the amino acids” and “Design strategy-2: homology-based protein design: taking templates from nature itself”). The red dots represent the {Sc, EC} points obtained for the corresponding scrambled sequences
Fig. 7
Fig. 7
Homology-based design of the CoV-2 RBDSpike: signatures of stable high affinity binding. The top panel displays the superposed ACE2-complexes (see the “Inherent evolutionary features of RBDSpike naturally aiding the design of its structural mimics” section) of HM0, HM3, and HM5 with their designed RBDSpike chains colored in light pink, magenta, and tv_blue, respectively. The mutations are highlighted in the form of sticks. The bottom panel shows the mapping of their corresponding {Sc, EC} points in CPdock as per mentioned in the embedded legend
Fig. 8
Fig. 8
Time-series plots of Sc and EC for the selected designed structural mimics in comparison to the native. a and b Plot the time-evolved Sc profiles for HM19 and HM21, respectively, alongside that of the native using different colors (magenta: native, red: mimics; as given in the legend-box), while, c and d plot their corresponding time-evolved EC profiles. The thicker lines drawn parallel to the X-axis plotted in different colors (blue: native, black: mimics, as also given in the legend-box) represent their corresponding time-series averages. Both Sc and EC are correlation measures, defined in the range of [−1, 1]. The X-axis represents the simulation time (in units of ns)
Fig. 9
Fig. 9
Electrostatic surface representation of one of the best predicted designed binary complexes (for HM19). ad The electrostatic surface map of the snapshot (picked up from its 200 ns MD simulation trajectory) with the highest attained EC value for HM19 (the “The protein design strategy: sampling and scoring” section). The rest of the figure may be described likewise to that of Fig. 3. Briefly, a and c represent “self-potentials” while b and d represent “partner-potentials” realized on the ligand and receptor surface, respectively, for HM19. Self- and partner-potentials are as defined in the legend of Fig. 3. Arrows indicate whether the surface potentials are due to “self” (a, c) or “partner” (b, d). Coloring of “cartoons” are as in Fig. 3. A direct comparison with Fig. 3 clearly shows that the match in counter-colors (red and blue) improves appreciably between corresponding patches on the contact surfaces (due to their respective self- and partner-potentials) with respect to that of the native ACE2-complex (see the “Inherent evolutionary features of RBDSpike naturally aiding the design of its structural mimics” section). This reflects that the native weak anti-correlation in electrostatic surface potential could be significantly strengthened by the strategic design
Fig. 10
Fig. 10
Time-series plots of binding/interaction energies for the selected designed structural mimics and their changes with respect to the native. Panels a and b Plot the time-evolved Gbindingmimic profiles (as defined in the “Estimating changes in binding/interaction energies for the proposed ‘optimal’ solutions” section) for HM19 and HM21, respectively, alongside that of the native (Gbindingnative: the “Estimating changes in binding/interaction energies for the proposed ‘optimal’ solutions” section) using different colors (∆Gb in Fig.10: magenta: native, red: mimics; as given in the embedded legend-boxes). c The corresponding difference plots (Gbindingmimic :: see Eq. 4 defined in the “Estimating changes in binding/interaction energies for the proposed ‘optimal’ solutions” section) for the mimics (HM19: magenta; HM21: red; as also given in the legend-boxes). The thicker lines drawn (in all three panels) parallel to the X-axes represent the corresponding time-series averages of the plotted parameters with their colors and descriptions given in the legend-box (blue: native, black: mimics, for a and b; blue: HM19, black: HM21 for c). The X-axis represents the simulation time (in units of ns)
Fig. 11
Fig. 11
Docking and structural analysis in view of angiotensin II - binding to ACE2 with reference to the RBDSpike–ACE2 complexation in COVID-19. a The Cluspro docking results of Angiotensin II (PDB ID: 1N9V, MODEL 1) docked onto ACE2 (6VW1, chain A). The ligand chain of 6VW1 (chain E) is also displayed alongside the docked poses (for clarity). The 10 top-ranked docked poses of the ligand (angiotensin II) are displayed both as cartoon and dots (surface points) for better focus. b The BRANEart visual output of the top ranked angiotensin II ACE2 docked binary complex. The figure in b is regenerated in PyMol from the .pml file provided in the BRANEart output. Coloring of structural regions follow the coloring scheme specified in the color bar: blue: hydrophilic, white: neutral, red: hydrophobic (see the “Dynamic persistence of the binding of the selected designed structural mimics” section)

References

    1. Andersen KG, Rambaut A, Lipkin WI, et al. The proximal origin of SARS-CoV-2. Nat. Med. 2020;26:450–452. doi: 10.1038/s41591-020-0820-9. - DOI - PMC - PubMed
    1. Li Q, Guan X, Wu P, et al. Early transmission dynamics in Wuhan, China, of novel coronavirus-infected pneumonia. N. Engl. J. Med. 2020;382:1199–1207. doi: 10.1056/NEJMoa2001316. - DOI - PMC - PubMed
    1. Huang C, Wang Y, Li X, et al. Clinical features of patients infected with 2019 novel coronavirus in Wuhan, China. Lancet. 2020;395:497–506. doi: 10.1016/S0140-6736(20)30183-5. - DOI - PMC - PubMed
    1. Zhu N, Zhang D, Wang W, et al. A novel coronavirus from patients with pneumonia in China, 2019. N. Engl. J. Med. 2020;382:727–733. doi: 10.1056/NEJMoa2001017. - DOI - PMC - PubMed
    1. Lu R, Zhao X, Li J, et al. Genomic characterisation and epidemiology of 2019 novel coronavirus: implications for virus origins and receptor binding. Lancet. 2020;395:565–574. doi: 10.1016/S0140-6736(20)30251-8. - DOI - PMC - PubMed

Substances

LinkOut - more resources