

Cyclin D1 controls development of cerebellar granule cell progenitors through phosphorylation and stabilization of ATOH1
- PMID: 34057742
- PMCID: PMC8280807
- DOI: 10.15252/embj.2020105712
Cyclin D1 controls development of cerebellar granule cell progenitors through phosphorylation and stabilization of ATOH1
Erratum in
-
Cyclin D1 controls development of cerebellar granule cell progenitors through phosphorylation and stabilization of ATOH1.EMBO J. 2023 Apr 17;42(8):e113613. doi: 10.15252/embj.2023113613. EMBO J. 2023. PMID: 37066444 Free PMC article.
Abstract
During development, neural progenitors are in proliferative and immature states; however, the molecular machinery that cooperatively controls both states remains elusive. Here, we report that cyclin D1 (CCND1) directly regulates both proliferative and immature states of cerebellar granule cell progenitors (GCPs). CCND1 not only accelerates cell cycle but also upregulates ATOH1 protein, an essential transcription factor that maintains GCPs in an immature state. In cooperation with CDK4, CCND1 directly phosphorylates S309 of ATOH1, which inhibits additional phosphorylation at S328 and consequently prevents S328 phosphorylation-dependent ATOH1 degradation. Additionally, PROX1 downregulates Ccnd1 expression by histone deacetylation of Ccnd1 promoter in GCPs, leading to cell cycle exit and differentiation. Moreover, WNT signaling upregulates PROX1 expression in GCPs. These findings suggest that WNT-PROX1-CCND1-ATOH1 signaling cascade cooperatively controls proliferative and immature states of GCPs. We revealed that the expression and phosphorylation levels of these molecules dynamically change during cerebellar development, which are suggested to determine appropriate differentiation rates from GCPs to GCs at distinct developmental stages. This study contributes to understanding the regulatory mechanism of GCPs as well as neural progenitors.
Keywords: Atoh1; cerebellar granule cell; cyclin D1; development; neural progenitor.
© 2021 The Authors.
Conflict of interest statement
The authors declare that they have no conflict of interest.
Figures

- A
Immunostaining of P5 cerebellum with indicated antibodies. (A) Low magnification. (A’–A’’’’) high magnification. The solid line indicates the pial edge of the EGL. The dashed line demarcates the bottom of the KI67‐stained region. The outer EGL corresponds to the area between the solid and dashed lines, which contain GCPs.
- B
Schematic illustration of AT+GCPs and ND+GCPs. KI67‐positive GCPs in the EGL were distinguished by the expression of two bHLH transcriptional factors, ATOH1 (AT+GCPs) and NEUROD1 (ND+GCPs).
- C
Pax6‐positive and Pcna‐positive cells were extracted from published scRNA‐seq data. UMAP‐based dimensional reduction and cluster analysis grouped extracted cells into 5 clusters.
- D
Normalized expression of selected genes (Atoh1, Neurod1) was mapped onto the UMAP dimension.
- E
Featured molecules in each cluster were determined and visualized by heatmap. The values of each molecule were normalized by Z‐score. Molecular features of each cluster suggested that clusters 0 and 1 were GCP lineage cells, cluster 3 was GCs and clusters 2 and 4 were likely to be interneuron precursors as Pax3 and Id3 expression was strong. In addition, the strong and featured expression of Atoh1 suggested that cluster 0 and cluster 1 might be AT+GCPs and ND+GCPs.
- F
Cumulative labeling of AT+GCPs and ND+GCPs in P6 mice. Total cell cycle length (Tc) and S phase length (Ts) were calculated as previously described. Calculated time of Tc, Ts, TG1, TG2, and TM were indicated in the table (F’). N = 3 for each time point. Error bars are representing as mean ± SEM. Two‐way ANOVA analysis was performed against Cumulating rate from 0 to 9 h in each cell, followed by Bonferroni test. *P < 0.05, and **P < 0.01. Number of cells: 113, 101, and 159 AT+GCPs from N = 3 mice (0 h), 116, 115, and 95 AT+GCPs from N = 3 mice (3 h), 106, 105, and 100 AT+GCPs from N = 3 mice (6 h), 122, 168, and 170 AT+GCPs from N = 3 mice (9 h). 196, 167, and 158 ND+GCPs from N = 3 mice (0 h), 139, 110, and 101 ND+GCPs from N = 3 mice (3 h), 98, 163, and 81 ND+GCPs from N = 3 mice (6 h), 136, 124, and 115 ND+GCPs from N = 3 mice (9 h).
- G–J
Atoh1 KD analysis. (G, H) Atoh1 shRNA was introduced to P5 mice EGL together with H2B‐EGFP plasmid and immunostaining for NEUROD1 (Cyan) and KI67 (magenta) was performed 24 h later. Nuclei of electroporated cells were labeled with GFP (green). Images of control (G) and Atoh1 KD (H). Arrows indicate the cells of interest where GFP signals are co‐localized with NEUROD1 and KI67. (I) Proportions of NEUROD1+, KI67+ cells (ND+GCPs) among the electroporated GCPs (GFP+, KI67+ cells) were increased in the Atoh1 KD mice. (J) Proportions of KI67+ cells (total GCPs) were not significantly changed. The Student t‐test was performed between control (N = 4) and Atoh1 shRNA (sh#1: N = 3, sh#2: N = 3). Bars and error bars are representing as mean ± SEM. *P < 0.05, N.S.: Not Significant. Number of cells: 98, 71, 81, and 60 cells from N = 4 mice (scramble), 127, 93, and 51 cells from N = 3 mice (sh#1), 75, 111, 38 cells from N = 3 mice (sh#2).
- A
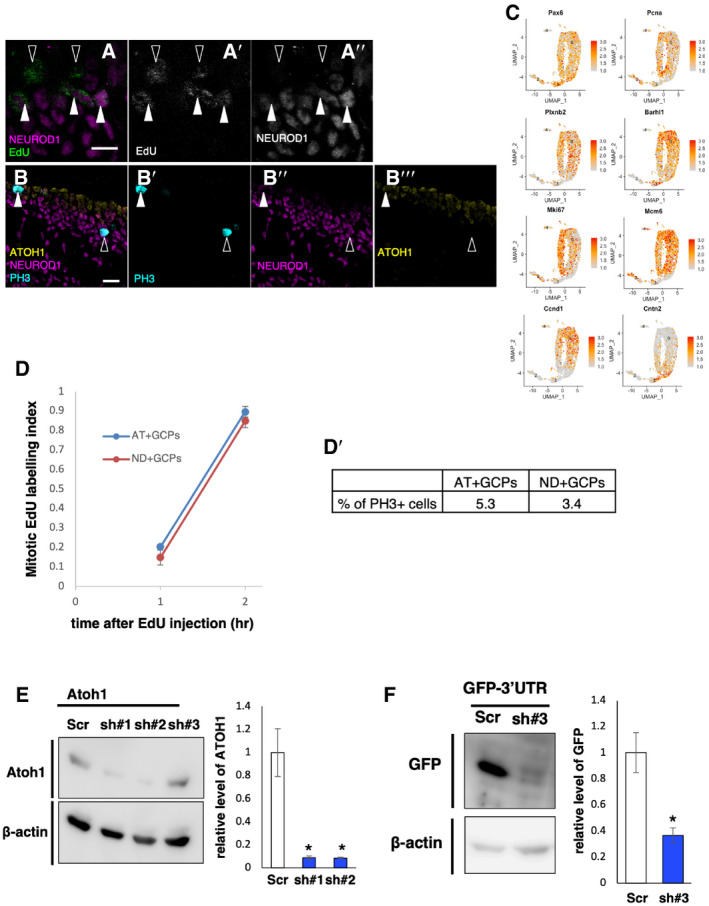
Immunostaining with indicated antibodies to P6 mice. 50 mg/kg EdU was administered intraperitoneally 30 min before fixation. Solid white arrowheads indicate NEUROD1‐positive and EdU‐positive GCPs (ND+GCPs in S phase). White hollow arrowheads indicate NEUROD1‐negative and EdU‐positive GCPs (AT+GCPs in S phase).
- B
Immunostaining with indicated antibodies to P6 mice. Solid white arrowheads indicate NEUROD1‐positive and PH3‐positive GCPs (ND+GCPs in M‐phase). White hollow arrowheads indicate ATOH1‐positive and EdU‐positive GCPs (AT+GCPs in M‐phase).
- C
Normalized expression of selected genes (Pax6, Pcna, Plxnb2, Barhl1, Mki67, Mcm6, Ccnd1, and Cntn2) were mapped onto the UMAP dimension. Pax6 (Shiraishi et al, 2019) and Pcna (Migheli et al, 1999) were used as threshold genes to extract the population that included GCPs. Plxnb2 (Friedel et al, 2007) and Barhl1 (Li et al, 2004) were used as markers for granule cell lineage cells. Mki67 and Mcm6 were used as markers for mitotic cells (Giotti et al, 2018). Ccnd1 (Pogoriler et al, 2006) and Cntn2 (Xenaki et al, 2011) were used as markers for undifferentiated and differentiated cells of granule cell lineage, respectively.
- D
Mitotic labeling experiments were performed with P6 mice. Rates of PH3+ cells among the EdU+ cells were determined 1 or 2 h after EdU incorporation in AT+GCPs and ND+GCPs (D). Error bars are representing as mean ± SEM from three mice. Percentages of PH3+ cells among the AT+GCPs and ND+GCPs were determined with P6 mice (D’).
- E, F
Efficiency of shRNAs was confirmed by immunoblotting. Lysates of N2a cells transfected with either Atoh1 expression plasmids with scramble (Scr) shRNA plasmids or Atoh1 expression plasmids with Atoh1 shRNA (sh#1, sh#2, or sh#3) were subjected to immunoblotting with anti Atoh1 or β‐actin (E). Quantification of relative levels of ATOH1 to the β‐ACTIN (right panel). Mean ± SEM. The Student t‐tests between Scr and sh#1 or Scr and sh#2 were performed. Lysates of N2a cells transfected with either GFP expression plasmids fused to Atoh1 3’ untranslated region (UTR) (GFP‐3’UTR) with scramble (Scr) shRNA plasmids or GFP‐3’UTR with Atoh1 sh#3 targeting 3’UTR region of Atoh1 were subjected to immunoblotting with anti GFP or β‐actin (F). Quantification of relative levels of GFP to the β‐ACTIN (right panel). Mean ± SEM. The Student t‐test between Scr and sh#3 was performed.

- A
Normalized expression levels of Ccnd1 in each cluster (Fig 1C) as indicated by violin plots.
- B
Immunostaining of P5 cerebellum with indicated antibodies. Boxplots of the intensity of CCND1 immuno‐signal (B’’’’, normalized to the mean intensity of AT+GCPs). We measured the intensities of CCND1 in ATOH1+/NEUROD1− cells and NEUROD1+/ATOH1− cells. ATOH1+/NEUROD1+ cells were not included in this quantification. These boxplots are showing the median (central band), 25%/75% quartiles (boxes) and the ranges (lower whiskers represent the regions of lower box—1.5*IQR (inter‐quartile range), upper whisker represents the regions of upper box—1.5*IQR). Wilcoxon test was performed between AT+GCPs and ND+GCPs. ***P < 0.001.
- C–F
Ccnd1 KD analysis. (C, D) Ccnd1 shRNAs together with H2B‐EGFP plasmid were introduced to P5 mice EGL, and immunostaining for ATOH1 (magenta) and KI67 (Cyan) was performed the following day. Nuclei of electroporated cells were labeled with GFP (yellow). Images of control (C) and Ccnd1 KD (D). Arrows indicate the cells of interest where GFP signals are co‐localized with ATOH1. (E) Proportions of ATOH1+, KI67+ cells (AT+GCPs) among the electroporated cells were decreased in the Ccnd1 KD mice. (F) Proportions of KI67+ cells (total GCPs) were not significantly changed. The Student t‐test was performed between control (N = 3) and Ccnd1 KD (sh#1: N = 3, sh#2: N = 3) mice. Bars and error bars are representing as mean ± SEM. ***P < 0.001, N.S.: Not Significant. Number of cells: 52, 64 and 107 cells from N = 3 mice (scramble), 72, 79 and 75 cells from N = 3 mice (sh#1), 84, 70 and 40 cells from N = 3 mice (sh#2).
- G–K
Overexpression analysis of Ccnd1 with or without Cdk4. (G–I) Ccnd1 and Cdk4 expression plasmids were introduced to P5 mice EGL and immunostaining for ATOH1 (magenta) and KI67 (cyan) was performed the following day. Nuclei of electroporated cells were labeled with GFP (yellow). Images of control (G), CCND1 overexpression (H) and CCND1 and CDK4 overexpression (I). Arrows indicate the cells of interest where GFP signals are co‐localized with ATOH1. (J) Proportions of ATOH1+, KI67+ cells (AT+GCPs) among the electroporated cells were not significantly changed between control and CCND1. Forced expression of CCND1 and CDK4 (4D) significantly increased the proportions of AT+GCPs compared to control. (K) Proportions of KI67+ cells (total GCPs) were not significantly changed. Tukey–Kramer test was performed on control (N = 6), CCND1 (N = 4), CCND1, and CDK4 (N = 3). Bars and error bars are representing as mean ± SEM. **P < 0.01, N.S.: Not Significant. Number of cells: 52, 64, 107, 244, 127, and 146 from N = 6 mice (control), 126, 137, 80 and 336 from N = 4 mice (Ccnd1), 212, 143, and 38 from N = 3 mice (4D).

- A
Cell cycle‐related expression of Ccnd1 in GCPs categorized to cluster 0 (AT+GCPs) or cluster 1 (ND+GCPs, Fig 1C).
- B, C
Immunostaining with indicated antibodies in P6 mice. Strong CCND1 expression was observed in dividing AT+GCPs (B, NEUROD1‐negative and PH3‐positive), while CCND1 expression was faint in ND+GCPs (C, NEUROD1‐positive and PH3‐positive).
- D
Efficiency of shRNAs was confirmed by immunoblotting. Lysates of N2a cells transfected with either sh‐scramble plasmid (scr) or Ccnd1 shRNA (sh#1 or sh#2) were subjected to immunoblotting with anti‐Ccnd1 or β‐actin to examine endogenous expression of CCND1. Quantification of relative levels of CCND1 to the β‐ACTIN (right panel). Mean ± SEM. The Student t‐tests between Scr and sh#1 or Scr and sh#2 were performed.
- E
Rates of KI67+ cells 2 days after electroporation. Ccnd1 shRNAs were introduced to P5 EGL, followed by immunostaining of KI67 in P7 mice. Ccnd1 KD significantly reduced the rate of KI67+, GFP+/GFP+ cells. The Student t‐test was performed between control (N = 3) and Ccnd1 KD (sh#1: N = 3, sh#2: N = 3) mice. Error bar sem.
- F–H
Ccnd1 KD analysis related to Fig 2C–F. (F, G) Ccnd1 shRNAs were introduced to P5 EGL with H2B‐EGFP expressing plasmid and immunostaining for Neurod1 (magenta) and Ki67 (cyan) were performed the following day. Nuclei of electroporated cells were detected with GFP (yellow). Images of control (F) and Ccnd1 KD (G). (H) Rates of ND+GCPs (NEUROD1‐positive and KI67‐positive cells) among the electroporated GCPs (GFP+, KI67+ cells). The Student t‐test was performed between control (N = 3) and Ccnd1 KD (sh#1: N = 3, sh#2: N = 3) mice. Error bar sem.
- I, J
CCND1 expression in GCPs electroporated either Ccnd1 (CCND1 OE) or Ccnd1 and Cdk4 (4D OE), related to Fig 2G–I.
- K
Rates of NEUROD1+ cells related to Fig 2G–I. Immunostaining of Neurod1 was performed in the following day of electroporation. Rates of NEUROD1‐positive cells among the electroporated cells were not significantly changed between control and CCND1. Forced expression of CCND1 and CDK4 (4D) significantly reduced the rates of NEUROD1+ cells compared to control. Tukey–Kramer test was performed on control (N = 6), CCND1 (N = 4), CCND1, and CDK4 (N = 3). Mean ± SEM.

- A, B
Cycloheximide (CHX) assay. (A) N2a cells transfected with Atoh1‐GST, Ccnd1, and Cdk4 plasmids 2 days prior were harvested after 0, 4, and 8 h treatments of 50 µg/ml CHX, and lysates were subjected to immunoblotting with anti‐Atoh1 or β‐actin as a housekeeping control. (B) Quantification of relative levels of ATOH1 to the β‐actin. N2a transfected with only Atoh1‐GST is referred as WT and N2a transfected with Atoh1‐GST, Ccnd1, and Cdk4 plasmids is referred as 4D. Same experiments were performed three times. Error bars are representing as mean ± SEM.
- C
N2a cells transfected with Atoh1‐GST plasmids were treated with DMSO (control), Palbociclib (Palb) or Palb, and 10 µM MG132 (MG132) for 6 h before harvest. Lysates of N2a were subjected to immunoblotting with anti‐Atoh1 or β‐actin. Quantification of relative ATOH1 to the β‐ACTIN (right panel). Tukey–Kramer test was performed between control, Palb, and MG132. Bars and error bars are representing as mean ± SEM from three trials of each condition. ***P < 0.001, *P < 0.05, N.S.: Not Significant. Three slots of each experimental condition represent the three biological replicants of each condition.
- D
In vitro phosphorylation assay of ATOH1. GST‐tagged full‐length ATOH1 (FL), N‐terminus ATOH1 including the bHLH domain (N), and C‐terminus of ATOH1 downstream of the bHLH domain (C) were purified from N2a cells using glutathione beads. ATOH1 proteins were incubated with either Casein kinase 1α (CK1α) or CCND1 and CDK4 in the presence of [γ‐32P]‐ATP. Phosphorylation signals detected with FL, N, and C by the phosphorylation of CK1α (lanes 1, 2, 3) are indicated by white arrowheads. Phosphorylation signals were also detected with FL and C by the phosphorylation of CCND1‐CDK4 (lanes 5, 6, 7). Phosphorylation signals of N with CCND1‐CDK4 were not detected. Strong CK1α self‐phosphorylation signals were observed (lane 4).
- E
Phosphorylation sites of ATOH1‐GST purified from N2a cells were determined by LC‐MS/MS. Five phosphorylation sites (Y78, S82, S309, S311, and S328) were identified.
- F
In vitro kinase assay with either wild‐type ATOH1 (WT) or non‐phosphorylated form of the serine‐to‐alanine 309 (S309A). WT or S309A were incubated with CCND1 and CDK4 (4D) in the presence of [γ‐32P]‐ATP. While WT with CCND1 and CDK4 gave rise to strong signals (lanes 1,2 white arrowhead), S309A showed no obvious signal (dashed arrowhead indicated the predicted size of ATOH1).
- G
Atoh1 expression plasmids were transfected into N2a cells with Ccnd1 and Cdk4 expression plasmids (4D). N2a cells were treated with 10, 100, 1,000 nM Palb for 6 h before harvest. Lysates from N2a cells were subjected to immunoblotting with anti‐Atoh1, p‐S309‐Ab, and β‐actin. Quantification of relative ATOH1 to the β‐ACTIN (right panel). Tukey–Kramer test was performed between 0, 10, 100, and 1,000 nM. Bars and error bars are representing as mean ± SEM from three trials of each condition. **P < 0.01, *P < 0.05, N.S.: Not Significant.

GST‐tagged ATOH1 or ATOH1S309A were purified from N2a cells with glutathione‐Sepharose beads. Purified ATOH1 was incubated with λ‐phosphatase (λPP) for 30 min. Purified proteins were resuspended and subjected to immunoblotting with indicated antibodies. As expected, p‐S309‐Ab recognized WT‐ATOH1 but not S309A‐ATOH1. However, when the purified WT‐ATOH1 was de‐phosphorylated by λ‐phosphatase, no bands were detected.
Immunoblotting with the indicated antibodies against lysates of N2a cells transfected with either Atoh1‐GST or Atoh1 S309A expression plasmids. No signals were detected with p‐S309‐Ab antibody in N2a cell lysates transfected with S309A‐ATOH1, while WT‐ATOH1 gave strong signals. Quantification of relative levels of phosphorylated ATOH1 at S309 to the total ATOH1 (right panel). Mean ± SEM. The Student t‐tests between WT and S309A was performed. These findings confirmed that our p‐S309‐Ab antibody specifically recognized phosphorylation at S309 of ATOH1.

- A
CHX assay with S309A. N2a cells transfected with either S309A or S309A+4D were treated with CHX for 0, 4, or 8 h before harvest. Lysates were subjected to immunoblotting with anti‐Atoh1 or β‐actin. Quantification of relative levels of ATOH1 to the β‐ACTIN (right panel). Error bars are representing as mean ± SEM from three trials of each condition.
- B
Lysates of N2a cells transfected with either WT or a phosphomimic form of ATOH1 (S309D) were immunoblotted with anti‐Atoh1 or β‐actin. Quantification of relative levels of ATOH1 to the β‐ACTIN (right panel). Mean ± SEM. The Student t‐test between WT and S309D was performed. ***P < 0.001. Three slots of each experimental condition represent the three biological replicants of each condition.
- C
GST pull‐down assay of WT and WT with 4D. GST‐Atoh1 plasmids were transfected with or without Ccnd1 and Cdk4 plasmids (4D) in N2a cells. Cell lysates were pulled down with glutathione‐conjugated beads after a 6‐hr treatment of 10 µM MG132 and then immunoblotted with anti‐poly Ubiquitin. Quantification of relative levels of polyubiquitin (right panel). Bars and error bars are representing as mean ± SEM from three trials of each condition. The Student t‐test between WT with MG132 and WT+4D with MG132. **P < 0.01.
- D
Lysates of N2a cells transfected with either WT or S309D were immunoblotted to detect Atoh1 S328 phosphorylation (p‐S328‐Ab), Atoh1, or β‐actin. Quantification of relative levels of phosphorylated ATOH1 at S328 to the total ATOH1 (right panel). Mean ± SEM. The student t‐test between WT and S309D was performed. **P < 0.01. Three slots of each experimental condition represent the three biological replicants of each condition.
- E
Lysates of N2a cells transfected with either WT or S328A were immunoblotted with anti‐Atoh1 or β‐actin. Quantification of relative levels of ATOH1 to the β‐ACTIN (right panel). Bars and error bars are representing as mean ± SEM from three trials of each condition. The Student t‐test between WT and S328A was performed. Three slots of each experimental condition indicated the biological replicants.
- F–K
Rescue experiment of Atoh1 KD with WT or S309A form of Atoh1. (F‐I) Scramble (control), Atoh1 shRNA (Atoh1 KD), shRNA and WT (KD+WT) or shRNA and S309A (KD+S309A) plasmids were introduced to P5 mice EGL with H2B‐EGFP plasmid and immunostaining for NEUROD1(magenta) was performed at P7. Nuclei of electroporated cells were detected by GFP (green). Arrows indicate the cells of interest which GFP signals are not co‐localized with NEUROD1 (AT+GCPs). (J) Proportions of NEUROD1‐ cells (AT+GCPs) among the electroporated cells. (K) Proportions of KI67+ cells (total GCPs). Tukey–Kramer test was performed among the control (N = 3), Atoh1 KD (N = 3), Atoh1 KD+WT (N = 3), and Atoh1 KD+S309A (N = 3) mice. ***P < 0.001, *P < 0.05, N.S.: Not Significant. Bars and error bars are representing as mean ± SEM. Number of cells: 138, 147 and 124 from N = 3 mice (control), 82, 75 and 117 from N = 3 mice (KD), 127, 269 and 347 from N = 3 mice (KD+WT), 195, 71 and 111 from N = 3 mice (KD+S309A).

GST‐tagged ATOH1 was purified from N2a cells. Purified ATOH1 was incubated with λ‐phosphatase (λPP). Purified proteins were resuspended and subjected to immunoblotting with indicated antibodies. As expected, p‐S328‐Ab robustly detected purified GST‐WT‐ATOH1, but signals were lost upon λ‐phosphatase coincubation.
Immunoblotting with the indicated antibodies against lysates of N2a cells transfected with either Atoh1‐GST or Atoh1 S328A expression plasmids. p‐S328‐Ab detected strong bands in WT‐ATOH1‐transfected N2a cells but not in those transfected with S328A‐ATOH1, a S328 phosphorylation‐resistant form of ATOH1. Quantification of relative levels of phosphorylated ATOH1 at S328 to the total ATOH1 (right panel). Mean ± SEM. The Student t‐tests between WT and S309A was performed. These observations suggest that our p‐S328‐Ab specifically recognizes phosphorylated ATOH1 at S328.

- A–D
Immunostaining of P6 mice with the indicated antibodies.
- E
Schematic illustration of PROX1 expression in the EGL.
- F
The rates of KI67‐positive cells 1 day after electroporation of Prox1 expression plasmid related to Fig 5B–D.
- G
The rates of ND+GCPs (NEUROD1‐positive and KI67‐positive cells) 1 day after electroporation of Prox1 expression plasmid related to Fig 5B–D.
- H
Prox1 expression in GCPs electroporated with Prox1 expression vector related to Fig 5B–D.
- I
Prox1 expression in Prox1fl/fl mice electroporated with Cre expression vector to related to Fig 5E–G.
- J
ChIP assay in P7 mouse cerebellum with anti‐Prox1 or goat IgG as a negative control. Primer set used in this experiment was designed to amplify Ccnd1 gene body (outside of the promoter region), related to Fig 5L.
- K–M
Expression plasmids of βcat S33Y were introduced with or without Ccnd1 and Cdk4 expression plasmids to P5 mice EGL and immunostaining for NEUROD1 (magenta) was performed the following day. Nuclei of electroporated cells were detected by GFP (green). Images of βcat S33Y (K, S33Y) and βcat S33Y with Ccnd1 and Cdk4 (L, S33Y+4D). Rates of NEUROD1+ cells among the electroporated cells. Tukey–Kramer test was performed between control, S33Y, and S33Y+4D (M).

- A
Immunostaining of P5 cerebellum with indicated antibodies.
- B–D
Overexpression analysis of PROX1. (B, C) Prox1 expression plasmids were introduced to mouse P5 EGL and immunostaining for CCND1 (magenta) was performed the following day. Nuclei of electroporated cells were detected with GFP (green). Images of control (B), PROX1 overexpression (C). Arrow heads indicates the CCND1‐positive cells. White lines are representing as pial surfaces. (D) The proportion of CCND1‐positive cells among the electroporated cells. Bars and error bars are representing as mean ± SEM. The Student t‐test between control (N = 3) and PROX1 overexpression (N = 3). **P < 0.01. Number of cells 382, 147 and 88 cells from N = 3 mice (control), 187, 108 and 94 cells from N = 3 mice (Prox1 OE).
- E–G
Prox1 acute KO analysis. (E, F) Expression plasmids of Cre recombinase were introduced to P5 EGL of Prox1 fl/fl mice and immunostaining for CCND1 (magenta) was performed at P8. Nuclei of electroporated cells were labeled with GFP (green). Images of H2B‐GFP electroporation (E, control), Cre electroporation (F, Cre). Arrows indicate the cells of interest where GFP signals are co‐localized with CCND1. (G) The proportions of CCND1+ cells among the electroporated cells. Bars and error bars are representing as mean ± SEM. The Student t‐test between control (N = 3) and Cre (N = 3). **P < 0.01. Number of cells: 238, 129 and 529 cells from N = 3 mice (control), 169, 210 and 216 cells from N = 3 mice (Cre).
- H–K
Rescue experiment of Prox1 with Ccnd1 and Cdk4‐expressing plasmids. (H–J) Prox1‐expressing plasmids were introduced with Ccnd1 and Cdk4 expression plasmids (Prox1+4D) to P5 EGL together with H2B‐GFP plasmid. Immunostaining for ATOH1 (magenta) was performed the following day. Nuclei of electroporated cells were detected by GFP (green). Arrows indicate the cells of interest where GFP signals are co‐localized with ATOH1. (K) Proportions of ATOH1+ cells (AT+GCPs) among the electroporated cells. The Tukey–Kramer test was performed on control (N = 6), Prox1 (N = 3), and Prox1+4D (N = 4) mice. **P < 0.01, *P < 0.05, N.S.: Not Significant. Bars and error bars are representing as mean ± SEM. Control value is the same as Fig 2G and K. Number of cells: 54, 72, and 59 cells from N = 3 mice (Prox1), 26, 53, 68, and 53 cells from N = 4 mice (Prox1+4D).
- L
ChIP assay in P7 mouse cerebellum with anti‐Prox1 or goat IgG as a negative control. Primer set used in this experiment was designed to amplify Ccnd1 promoter region.
- M–R
Administration of valproic acid (VPA) to electroporated mice. (M) Expression plasmids of Prox1 were introduced to P5 EGL and VPA or saline was administered intraperitoneally 2 days after electroporation. Immunostaining for CCND1 (magenta) was performed the day following the last VPA treatment. Nuclei of electroporated cells were detected with GFP (green). Arrows indicate the cells of interest where GFP signals are co‐localized with CCND1. (N‐Q) Images of H2B‐GFP with saline (N), PROX1 with saline (O), H2B‐GFP with VPA (P), and PROX1 with VPA (Q). (R) The relative proportions of CCND1+ cells among the electroporated cells (normalized to the control). Tukey–Kramer test among control+saline (N = 4), PROX1+saline (N = 3), control+VPA (N = 3) and PROX1+VPA (N = 3). Bars and error bars are representing as mean ± SEM. **P < 0.01, *P < 0.05, N.S.: Not Significant. Number of cells: 120, 488, 934, and 211 from N = 4 mice (control+saline), 630, 356, and 545 from N = 3 mice (control+VPA), 363, 127, and 219 from N = 3 mice (Prox1+saline), 110, 116, and 202 from N = 3 mice (Prox1+VPA).

- A
P5 or P10 mouse cerebella were electroporated with H2B‐GFP plasmids and immunostained with anti‐Atoh1 (magenta) the following day (P6 or P11). Nuclei of electroporated cells were detected by GFP (green). Arrows indicate the cells of interest where GFP signals are co‐localized with ATOH1. The proportions of ATOH1‐positive cells(AT+GCPs, A’). Bars and error bars are representing as mean ± SEM. The Student t‐test was performed between P6 mice electroporated at P5 (P5–6) and P11 mice electroporated at P10 (P10–11). ***P < 0.001. Number of cells: 108, 72, and 104 cells from N = 3 mice (P5–6), 182, 45, and 61 cells from N = 3 mice (P10–11).
- B–F
AT‐ND transition in cultured GCPs. (B‐E) GCPs were extracted from P5 (P5 GCPs) or P10 (P10 GCPs) mouse cerebella and immunostained with anti‐Neurod1 (green) and anti‐Ki67 (magenta) at DIV1 and DIV2. (F) Proportions of NEUROD1‐ cells (AT+GCPs) among total KI67‐positive cells. Bars and error bars are representing as mean ± SEM. Tukey–Kramer test was performed. **P < 0.01, N.S.: Not Significant. Number of cells: 95,194, and 53 cells from N = 3 mice (P5DIV1), 543, 238, and 550 cells from N = 3 mice (P5DIV2), 121, 242, and 232 cells from N = 3 mice (P10DIV1), 110,137, and 210 cells from N = 3 mice (P10DIV2).
- G
Normalized expression levels of Ccnd1 (G), Prox1 (G’), and Gapdh (G’’) transcripts were compared between Atoh1‐positive cells extracted from the scRNA‐seq data of P5 and P14 cerebellum. Wilcoxon test between n = 1,602 cells (P5 Atoh1‐positive cells) and n = 274 cells (P14 Atoh1‐positive cells). ***P < 0.001, N.S.: Not Significant.
- H–J
Whole cerebellum lysates of P6, P9, and P12 mice were subjected to immunoblotting with anti‐pAtoh1 S309, Atoh1, Ccnd1, Prox1, and β‐actin. (I) The protein levels of CCND1 and PROX1 normalized by β‐ACTIN. (J) Quantification of p‐ATOH1 S309 normalized to the total level of ATOH1.
- K
ChIP assay for H3K9 histone acetylation of Ccnd1 promoter in cultured GCPs extracted from P6 or P9 mouse cerebellum. The Student t‐test between P6 GCPs (N = 4) and P9 GCPs (N = 4). *P < 0.05. Bars and error bars are representing as mean ± SEM.
- L–P
Overexpression analysis of WT or S309D form of Atoh1. (L) Expression plasmids of either WT or S309D form of Atoh1 were introduced to P10 mice EGL and immunostaining for KI67 (magenta) was performed in P16 mouse cerebellum. Nuclei of electroporated cells were detected by GFP (green). Images of H2B‐GFP (M, control), WT(N) and S309D (O). Arrows indicate the cells of interest where GFP signals are co‐localized with KI67. (GCPs). (P) Proportions of KI67+ cells among the electroporated cells. Tukey–Kramer test among control (N = 3), Atoh1 WT (N = 3), and Atoh1 S309D (N = 3). Bars and error bars are representing as mean ± SEM. *P < 0.05. Number of cells: 43, 68, and 46 from N = 3 mice (control), 104, 215, and 157 cells from N = 3 mice (WT), 242, 119, and 111 cells from N = 3 mice (S309D).

- A, B
Immunostaining of P5 cerebellum with indicated antibodies. Dashed lines indicate the upper and bottom of EGL. Low‐magnification images (A) and high‐magnification images showing the upper, the middle, and the inner part of the EGL (B–B’’).
- C
Quantification of the relative intensity of NP‐β‐catenin in the outer and the inner parts of EGL. Bars and error bars are representing as mean ± SEM. The Student t‐test between the outer and the inner part of EGL was performed. ***P < 0.001. Nine sections from N = 3 mice were measured for the quantification.
- D–F
Overexpression analysis of the activated form of β‐catenin (βcat S33Y). (D, E) Expression plasmids of βcat S33Y were introduced to P5 mice EGL and immunostaining for PROX1 (magenta) was performed the following day. Nuclei of electroporated cells were detected with GFP (green). Images of H2B‐GFP (D, control) and βcat S33Y (E, S33Y). Arrows indicate the cells of interest where GFP signals are co‐localized with PROX1. (F) Proportions of PROX1‐positive cells in electroporated cells. Bars and error bars are representing as mean ± SEM. The Student t‐test between control and S33Y was performed. ***P < 0.001. Number of cells: 89, 90, and 55 cells from N = 3 mice (control), 32, 111, and 56 cells from N = 3 mice (S33Y).
- G, H
Immunostaining of P5 or P10 cerebellum with indicated antibodies.
- I
Schematic illustrations of dynamic activity of WNT signaling estimated by the intensity of NP‐β‐catenin. Solid lines indicate the upper and the bottom of EGL and dashed line indicates the bottom of ATOH1‐positive region.
- J–L
Expression plasmids of βcat S33Y were introduced with or without Ccnd1 and Cdk4 expression plasmids (4D) to P5 mice EGL and immunostaining for ATOH1 (magenta) was performed the following day. Nuclei of electroporated cells were detected by GFP (green). Images of βcat S33Y (J, S33Y) and βcat S33Y with Ccnd1 and Cdk4 (K). Arrows indicate the cells of interest where GFP signals are co‐localized with ATOH1. Proportions of ATOH1+ cells (AT+GCPs) among the electroporated cells. Control value is the same as Fig 2G–K. Bars and error bars are representing as mean ± SEM. Tukey–Kramer test was performed between control, S33Y, and S33Y+4D (L). ***P < 0.001, N.S: Not Significant. Number of cells: 123, 138, and 113 cells from N = 3 mice (S33Y), 144, 223, and 180 cells from N = 3 mice (S33Y+4D).
- M
Schematic illustrations summarizing this study.
References
-
- Aragaki M, Tsuchiya K, Okamoto R, Yoshioka S, Nakamura T, Sakamoto N, Kanai T, Watanabe M (2008) Proteasomal degradation of Atoh1 by aberrant Wnt signaling maintains the undifferentiated state of colon cancer. Biochem Biophys Res Commun 368: 923–929 - PubMed
-
- Butts T, Green MJ, Wingate RJ (2014a) Development of the cerebellum: simple steps to make a 'little brain'. Development 141: 4031–4041 - PubMed
-
- Butts T, Hanzel M, Wingate RJ (2014b) Transit amplification in the amniote cerebellum evolved via a heterochronic shift in NeuroD1 expression. Development 141: 2791–2795 - PubMed
Publication types
MeSH terms
Substances
Associated data
- Actions
LinkOut - more resources
Full Text Sources
Other Literature Sources
Medical
Research Materials
