. 2021 Nov;15(11):3203-3221.
doi: 10.1002/1878-0261.13032. Epub 2021 Jul 19.

Homocysteine induces podocyte apoptosis by regulating miR-1929-5p expression through c-Myc, DNMT1 and EZH2

Affiliations

Homocysteine induces podocyte apoptosis by regulating miR-1929-5p expression through c-Myc, DNMT1 and EZH2

Lin Xie et al. Mol Oncol. 2021 Nov.

Abstract

Chronic kidney disease (CKD) is a common and complex disease in kidneys which has been associated with an increased risk of renal cell carcinoma. Elevated homocysteine (Hcy) levels are known to influence the development and progression of CKD by regulating podocyte injury and apoptosis. To investigate the molecular mechanisms triggered in podocytes by Hcy, we used cbs+/- mice and observed that higher Hcy levels increased the apoptosis rate of podocytes with accompanying glomerular damage. Hcy-induced podocyte injury and apoptosis in cbs+/- mice was regulated by inhibition of microRNA (miR)-1929-5p expression. Overexpression of miR-1929-5p in podocytes inhibited apoptosis by upregulating Bcl-2. Furthermore, the expression of miR-1929-5p was regulated by epigenetic modifications of its promoter. Hcy upregulated DNA methyltransferase 1 (DNMT1) and enhancer of zeste homolog 2 (EZH2) levels, resulting in increased DNA methylation and H3K27me3 levels on the miR-1929-5p promoter. Additionally, we observed that c-Myc recruited DNMT1 and EZH2 to the miR-1929-5p promoter and suppressed the expression of miR-1929-5p. In summary, we demonstrated that Hcy promotes podocyte apoptosis through the regulation of the epigenetic modifiers DNMT1 and EZH2, which are recruited by c-Myc to the promoter of miR-1929-5p to silence miR-1929-5p expression.

Keywords: c-Myc; DNMT1; EZH2; homocysteine; kidney; miR-1929-5p.


Conflict of interest statement

The authors declare no conflict of interest.

Figures
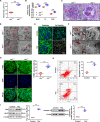
Fig. 1
Fig. 1
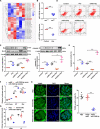
Hcy‐induced podocyte apoptosis and glomerular injury. (A,B) The levels of serum Hcy, blood urea nitrogen (BUN), creatinine (Cr) and cytochrome‐c (CytC) in the cbs+/+ and cbs+/− mice were measured by automatic biochemical analyzer (n = 6). (C) Glomerular structural change of kidney sections using PAS staining in the cbs+/+ and cbs+/− mice. Scale bars: 170 μm. (D) TEM of glomeruli. Scale bars: 5 μm, 2 μm. (E) Representative immunofluorescence images of viable (green), dead (red) and nuclei (blue) in the podocytes treated with Hcy (Scale bar, 500 μm) and photomicrographs of stress fibers by phalloidin‐iFluor™ 488 conjugate staining. Scale bar: 100 μm). (F) Apoptotic podocytes in the glomerulus were assessed by TEM in cbs+/+ and cbs+/− mice. Scale bar, 2000 nm, 1000 nm. (G) Apoptotic podocytes in the glomerulus of cbs+/+ and cbs+/− mice were assessed by TUNEL staining (n = 6). Scale bars: 170 μm. (H) Apoptosis rate of podocytes was measured by flow cytometry after podocytes were treated with Hcy (n = 3). (I) Representative western blot and quantification results of Bax, Bcl‐2 and caspase‐12 in the podocytes treated with Hcy (n = 3). **P < 0.01.
Fig. 2
Fig. 2
MicroRNA‐1929‐5p inhibits Hcy‐induced podocyte apoptosis. (A) Clustering of hierarchical cluster analysis of differentially expressed miRNA in the Control and Hcy group. Red indicates upregulated miRNA, and blue downregulated miRNA. (B) The level of miR‐1929‐5p in the glomeruli (n = 9) and Hcy‐treated podocytes (n = 3) was analyzed by qRT‐PCR. (C–E) Quantitative analysis of Bax, Bcl‐2 and caspase‐12 protein levels (n = 4) and analysis of apoptosis rate of podocytes (n = 3) after transfection with miNC, miR‐1929‐5p mimic or inhibitor and treatment with Hcy, respectively. (F) The reporter constructs containing 3′‐UTR regions of the wild type (WT) and mutant type (Mut) Bcl‐2 were co‐transfected with miR‐1929‐5p mimic or inhibitor. The ratio of firefly and renilla luciferase activities represents the relative luciferase activities (n = 6). (G,H) The levels of BUN, Cr and the number of apoptotic podocytes in glomerulus. Scale bars: 170 μm after AAV9‐miR‐1929‐5p was delivered into kidney of cbs+/− mice by intraparenchymal injection (n = 6). *P < 0.05, **P < 0.01.
Fig. 3
Fig. 3
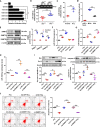
Hcy promotes miR‐1929‐5p hypermethylation by upregulating DNMT1 expression. (A) The promoter activity of miR‐1929‐5p by dual‐luciferase reporter assay. Various regions of the miR‐1929‐5p promoter (−2000/+200, −1500/+200, −1000/+200, −426/+200, −28/+200) were co‐transfected into HEK293 cells with renilla luciferase vector, respectively (n = 9). (B) DNA methylation of miR‐1929‐5p promoter region in the glomeruli from cbs+/+ and cbs+/− mice was analyzed by nMS‐PCR (n = 8). The reactions for unmethylated and methylated DNA are denoted by U and M, respectively. (C) MassARRAY analysis of DNA methylation in the miR‐1929‐5p promoter region in podocytes treated with Hcy (n = 3). (D) MicroRNA‐1929‐5p promoter was methylated by M.SssI, and the transcriptional activity of miR‐1929‐5p promoter was detected by luciferase reporter assay (n = 6). (E) The expression of DNMT1, DNMT3a and DNMT3b was detected by western blot in the podocytes treated with Hcy (n = 3). (F) The level of miR‐1929‐5p in the podocytes was detected after treatment with Hcy together with AZC, DC‐05, theaflavin 3, 3′‐digallate or Nanaomycin A (DNMT, DNMT1, DNMT3a and DNMT3b specific inhibitors, respectively) (n = 6). (G,H) MicroRNA‐1929‐5p expression and DNA methylation levels in the podocytes were detected after transfected with si‐DNMT1 or Ad‐DNMT1 and treated with Hcy (n = 3). (I, J) The protein levels of Bax, Bcl‐2 and caspase‐12 (n = 3) and the apoptosis rate of podocytes (n = 3) were examined after treatment with Hcy together with the treatment of DC‐05 or transfection with si‐DNMT1 or Ad‐DNMT1. *P < 0.05, **P < 0.01.
Fig. 4
Fig. 4
Status of H3K27me3 on the miR‐1929‐5p promoter by EZH2 contributed to podocyte apoptosis induced by Hcy. (A) Global levels of H3K27me1, 2, 3 in the glomeruli (n = 6) or podocytes (n = 3) treated with Hcy were detected by western blot. (B) EZH2 expression was detected by western blot in the glomeruli (n = 6) and podocytes (n = 3) treated with Hcy. (C) Co‐localization of EZH2 and H3K27me3 in the glomeruli from cbs+/+ and cbs+/− mice by immunofluorescence staining with anti‐H3K27me3 (green), anti‐EZH2 (red) antibodies, and DAPI (blue) (n = 6). Scale bars: 170 μm. (D) The occupancy of EZH2 and H3K27me3 on miR‐1929‐5p promoter in the podocytes detected by ChIP analysis (n = 6). (E) MicroRNA‐1929‐5p promoter activity was examined by miR‐1929‐5p promoter‐driven luciferase reporter system after knockdown of EZH2 (n = 9). (F) ChIP analysis of H3K27me3 occupancy on miR‐1929‐5p promoter in the podocytes transfected with si‐EZH2 or treated with EZH2 specific inhibitor (EPZ005687, EPZ) and stimulation with Hcy (n = 3). (G) Expression of miR‐1929‐5p was examined in the podocytes after knockdown of EZH2 or treatment with EPZ (n = 3). (H,I) Protein levels of Bax, Bcl‐2 and caspase‐12 and apoptosis rate of podocytes (n = 3) were determined after treatment with Hcy together with knockdown of EZH2 expression or treatment with EPZ. *P < 0.05, **P < 0.01.
Fig. 5
Fig. 5
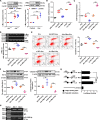
DNMT1 cooperates with EZH2 to regulate miR‐1929‐5p expression in Hcy‐treated podocytes. (A) DNMT1 and EZH2 protein expression was detected by western blot after podocytes were transfected with control siRNA (si‐NC), si‐DNMT1 or si‐EZH2 and exposed to Hcy (n = 3). (B) The promoter activity of EZH2 and DNMT1 was measured by dual luciferase assay after cells transfected with si‐NC, si‐DNMT1 or si‐EZH2 (n = 3). (C) The binding of DNMT1 with EZH2 was examined by Co‐IP in podocytes treated with Hcy. (D) The levels of H3K27me3 on miR‐1929‐5p promoter were detected by ChIP analysis when DNMT1 or EZH2 expression were knocked down in the podocytes (n = 5). (E) The average miR‐1929‐5p methylation levels in promoter region were analyzed by MassARRAY analysis (n = 3). (F) The miR‐1929‐5p expression in the podocytes was detected by qRT‐PCR (n = 3). (G) Representative western blot showing the protein levels of Bax, Bcl‐2 and caspase‐12 after podocytes were transfected with si‐NC, si‐DNMT1 or si‐EZH2 and exposed to Hcy (n = 3). (H) Podocytes were transfected with si‐NC, si‐DNMT1 or si‐EZH2 and the apoptosis rate of podocytes was measured by flow cytometry analysis (n = 3). *P < 0.05, **P < 0.01.
Fig. 6
Fig. 6
The c‐Myc‐mediated transcriptional repression of miR‐1929‐5p contributes to podocyte apoptosis induced by Hcy. (A) The mRNA and protein expression of c‐Myc was measured by qRT‐PCR and western blot in the glomeruli (n = 6) and podocytes treated with Hcy (n = 3). (B) The miR‐1929‐5p promoter activities were examined by luciferase reporter assay after transfection with Ad‐c‐Myc or si‐c‐Myc (n = 6). (C) The expression of miR‐1929‐5p in the podocytes infected with Ad‐c‐Myc and si‐c‐Myc was examined by qRT‐PCR (n = 3). (D) ChIP assay showed recruitment of c‐Myc to the promoter region of miR‐1929‐5p (n = 4). (E) The apoptosis rate of podocytes infected with Ad‐c‐Myc and si‐c‐Myc upon Hcy treatment was analyzed by flow cytometry analysis (n = 3). (F) Bax, Bcl‐2 and caspase‐12 protein expression in the podocytes after infection with Ad‐c‐Myc and si‐c‐Myc following Hcy treatment (n = 3). (G) The luciferase activities of the miR‐1929‐5p promoter with WT or the Mut binding site of c‐Myc were determined using luciferase reporter assays (n = 9). (H) ChIP assays showing the c‐Myc‐binding sites 1 and 2 of miR‐1929‐5p promoter in the podocytes. *P < 0.05, **P < 0.01.
Fig. 7
Fig. 7
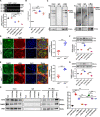
Thec‐Myc recruits EZH2 and DNMT1 to bind to the miR‐1929‐5p promoter in the podocytes treated with Hcy. (A) Binding of c‐Myc on site 2 of miR‐1929‐5p promoter in the podocytes transfected with si‐DNMT1 and si‐EZH2 was detected by ChIP assay (n = 3). (B) RNA immunoprecipitation (RIP) with anti‐c‐Myc, anti‐EZH2 and anti‐DNMT1 followed by qRT‐PCR detection of miR‐1929‐5p RNA enrichment in immunoprecipitated complex compared with IgG (n = 3). (C) Co‐IP of interactions between c‐Myc, EZH2 and DNMT1 in the podocytes treated with Hcy. (D,E) Co‐localized EZH2 or DNMT1 with c‐Myc in the glomeruli were subjected to immunofluorescence staining with anti‐c‐Myc, anti‐EZH2, anti‐DNMT1 and DAPI (n = 6). Scale bars: 170 μm. (F,G) The protein expression of DNMT1 and EZH2 in the podocytes after transfection with Ad‐c‐Myc or si‐c‐Myc and exposure to Hcy (n = 3). (H) Mapping the interface of c‐Myc with EZH2 and DNMT1 by Co‐IP experiments co‐transfected with Myc‐tagged EZH2, Myc‐tagged DNMT1 and different FLAG‐tagged c‐Myc fragments. (I) Relative luciferase activity mediated by reporter constructs harboring the promoter of miR‐1929‐5p in HEK293 cells (n = 6). **P < 0.01.

Similar articles

Cited by

References

    1. Linehan WM & Ricketts CJ (2019) The Cancer Genome Atlas of renal cell carcinoma: findings and clinical implications. Nat Rev Urol 16, 539–552. - PubMed
    1. Hofmann JN, Corley DA, Zhao WK, Colt JS, Shuch B, Chow WH & Purdue MP (2015) Chronic kidney disease and risk of renal cell carcinoma: differences by race. Epidemiology 26, 59–67. - PMC - PubMed
    1. Ostrakhovitch EA & Tabibzadeh S (2015) Homocysteine in chronic kidney disease. Adv Clin Chem 72, 77–106. - PubMed
    1. Yang J, Fang P, Yu D, Zhang L, Zhang D, Jiang X, Yang WY, Bottiglieri T, Kunapuli SP, Yu J et al. (2016) Chronic kidney disease induces inflammatory CD40+ monocyte differentiation via homocysteine elevation and DNA hypomethylation. Circ Res 119, 1226–1241. - PMC - PubMed
    1. Li S, Qiu B, Lu H, Lai Y, Liu J, Luo J, Zhu F, Hu Z, Zhou M, Tian J et al. (2019) Hyperhomocysteinemia accelerates acute kidney injury to chronic kidney disease progression by downregulating heme oxygenase‐1 expression. Antioxid Redox Signal 30, 1635–1650. - PubMed

Publication types

MeSH terms

LinkOut - more resources