

Genetic diversity and genetic relatedness in Plasmodium falciparum parasite population in individuals with uncomplicated malaria based on microsatellite typing in Eastern and Western regions of Uganda, 2019-2020
- PMID: 34059047
- PMCID: PMC8165787
- DOI: 10.1186/s12936-021-03763-6
Genetic diversity and genetic relatedness in Plasmodium falciparum parasite population in individuals with uncomplicated malaria based on microsatellite typing in Eastern and Western regions of Uganda, 2019-2020
Abstract
Background: Genetic diversity and parasite relatedness are essential parameters for assessing impact of interventions and understanding transmission dynamics of malaria parasites, however data on its status in Plasmodium falciparum populations in Uganda is limited. Microsatellite markers and DNA sequencing were used to determine diversity and molecular characterization of P. falciparum parasite populations in Uganda.
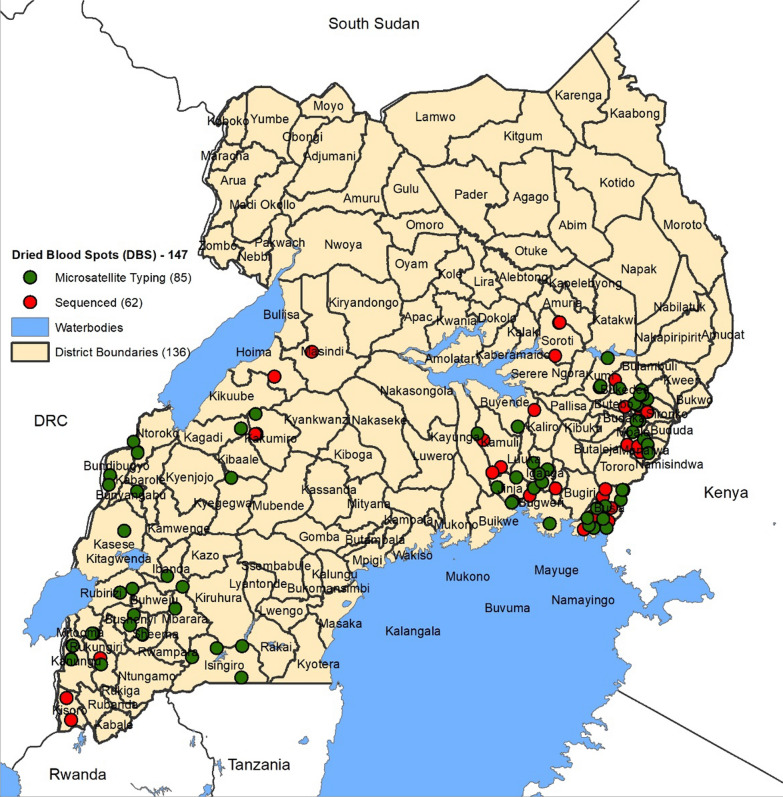
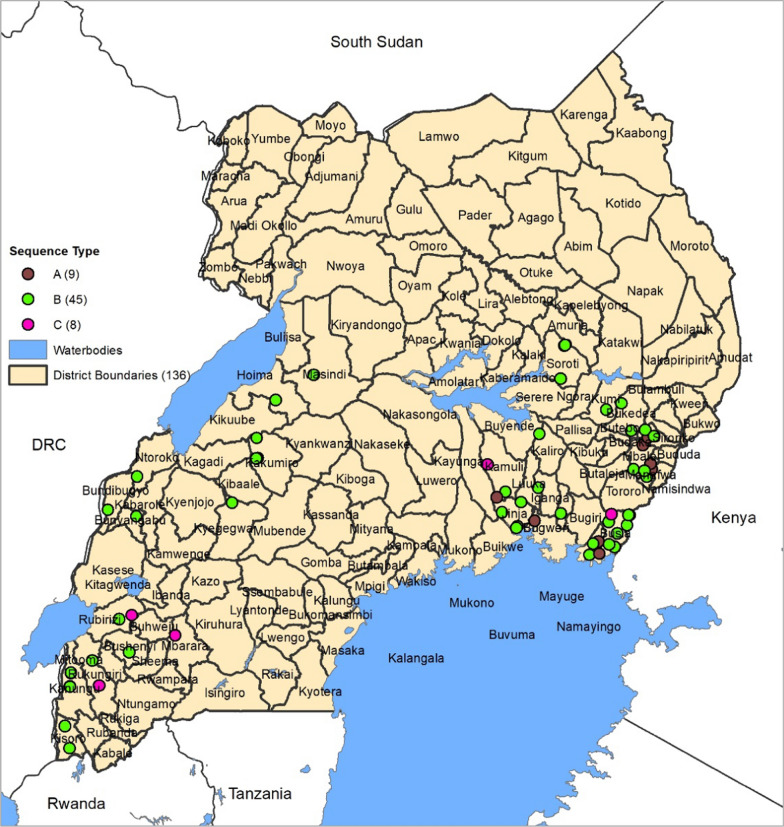
Methods: A total of 147 P. falciparum genomic DNA samples collected from cross-sectional surveys in symptomatic individuals of 2-10 years were characterized by genotyping of seven highly polymorphic neutral microsatellite markers (n = 85) and genetic sequencing of the Histidine Rich Protein 2 (pfhrp2) gene (n = 62). ArcGIS was used to map the geographical distribution of isolates while statistical testing was done using Student's t-test or Wilcoxon's rank-sum test and Fisher's exact test as appropriate at P ≤ 0.05.
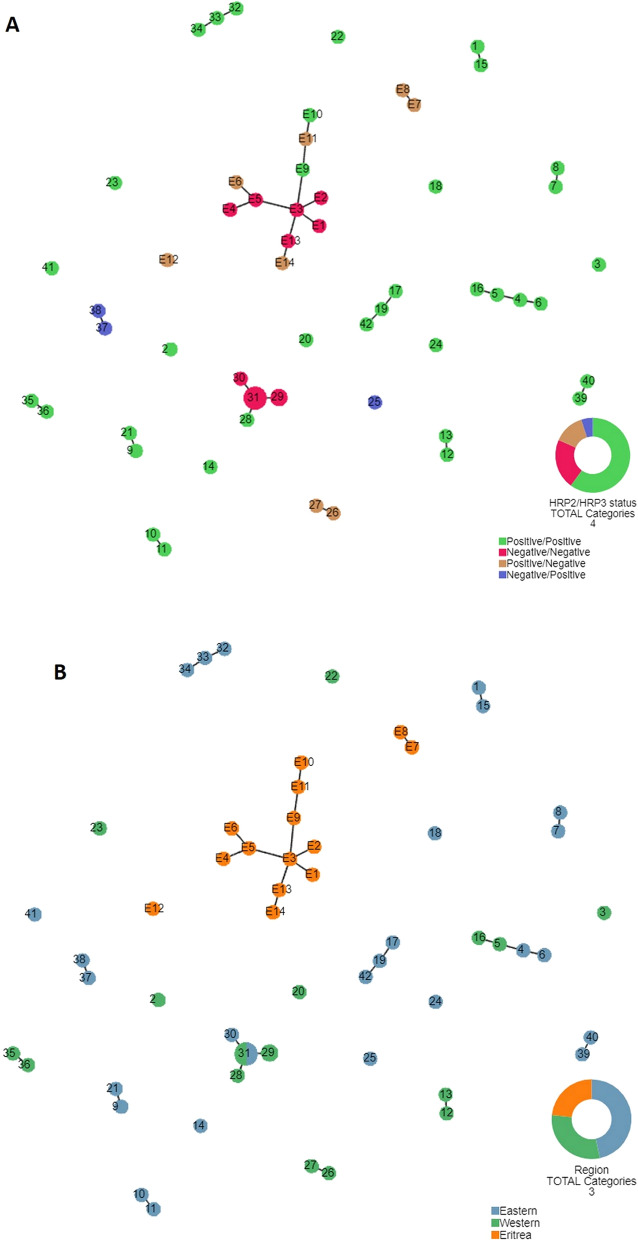
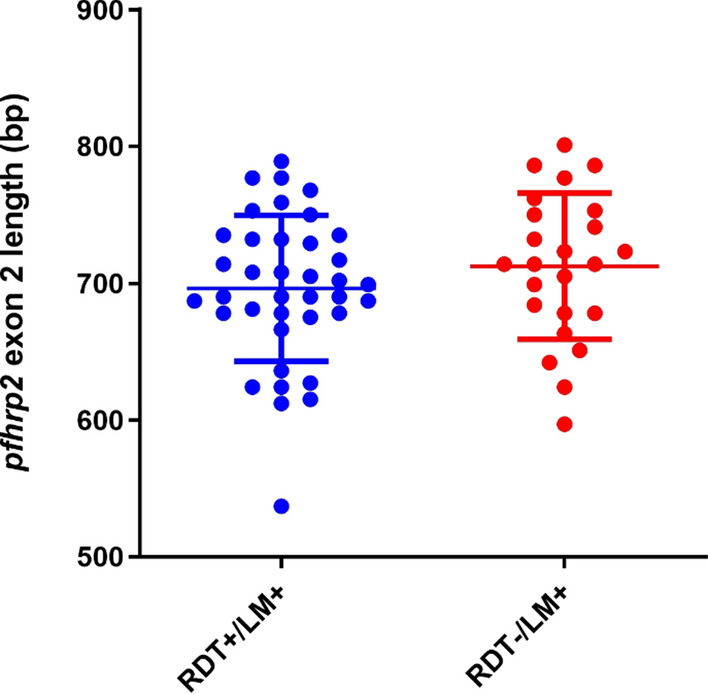
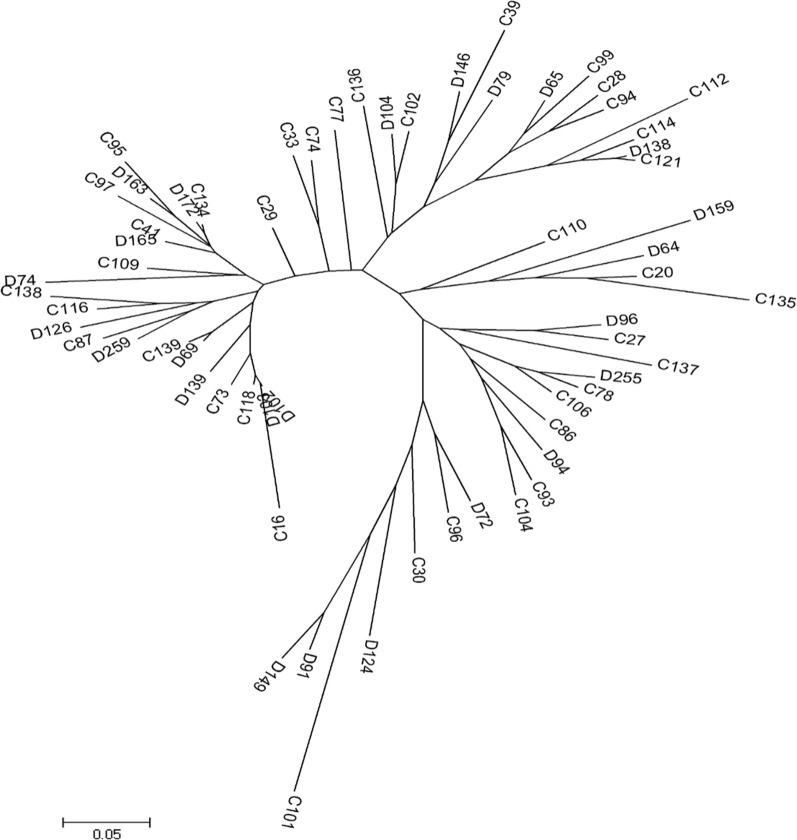
Results: Overall, 75.5% (95% CI 61.1-85.8) and 24.5% (95% CI14.2-38.9) of parasites examined were of multiclonal (mixed genotype) and single clone infections, respectively. Multiclonal infections occurred more frequently in the Eastern region 73.7% (95% CI 48.8-89.1), P < 0.05. Overall, multiplicity of infection (MOI) was 1.9 (95% CI 1.7-2.1), P = 0.01 that was similar between age groups (1.8 vs 1.9), P = 0.60 and regions (1.9 vs 1.8), P = 0.43 for the < 5 and ≥ 5 years and Eastern and Western regions, respectively. Genomic sequencing of the pfhrp2 exon2 revealed a high level of genetic diversity reflected in 96.8% (60/62) unique sequence types. Repeat type AHHAAAHHATD and HRP2 sequence Type C were more frequent in RDT-/PCR + samples (1.9% vs 1.5%) and (13% vs 8%), P < 0.05 respectively. Genetic relatedness analysis revealed small clusters of gene deleted parasites in Uganda, but no clustering with Eritrean parasites.
Conclusion: High level of genetic diversity of P. falciparum parasites reflected in the frequency of multiclonal infections, multiplicity of infection and variability of the pfhrp2 gene observed in this study is consistent with the high malaria transmission intensity in these settings. Parasite genetic analysis suggested spontaneous emergence and clonal expansion of pfhrp2 deleted parasites that require close monitoring to inform national malaria diagnosis and case management policies.
Keywords: Genetic diversity; Malaria; Microsatellite markers; Multiclonal infections; Multiplicity of infection; Parasite relatedness; Pfhrp2 deletion; Rapid diagnostic tests.
Conflict of interest statement
All authors declare that they have no competing interests.
Figures
References
-
- WHO. World Malaria Report 2019. Geneva. World Health Organization. https://www.who.int/publications-detail/world-malaria-report-2019.
-
- WHO. World Malaria Report 2020. Geneva. World Health Organization.
-
- WHO. World Malaria Report 2018. Geneva. World Health Organization https://www.who.int/malaria/publications/world-malaria-report-2018/en/.
-
- DHIS2. Routine District Health Information System, Uganda. 2020.
-
- NMCP. Uganda Malaria Indicator Survey (MIS). Kampala, 2019. https://dhsprogram.com/pubs/pdf/ATR21/ATR21.pdf.
MeSH terms
Grants and funding
LinkOut - more resources
Full Text Sources
