. 2021 May 31;18(1):21.
doi: 10.1186/s12950-021-00285-5.

Luteolin transforms the polarity of bone marrow-derived macrophages to regulate the cytokine storm

Affiliations

Luteolin transforms the polarity of bone marrow-derived macrophages to regulate the cytokine storm

Shuxia Wang et al. J Inflamm (Lond). .

Abstract

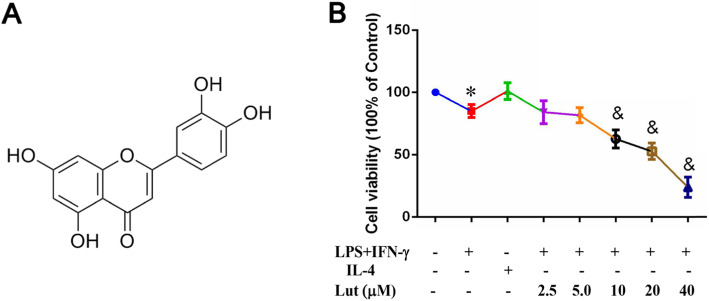
Background: Macrophages are indispensable regulators of inflammatory responses. Macrophage polarisation and their secreted inflammatory factors have an association with the outcome of inflammation. Luteolin, a flavonoid abundant in plants, has anti-inflammatory activity, but whether luteolin can manipulate M1/M2 polarisation of bone marrow-derived macrophages (BMDMs) to suppress inflammation is still unclear. This study aimed to observe the effects of luteolin on the polarity of BMDMs derived from C57BL/6 mice and the expression of inflammatory factors, to explore the mechanism by which luteolin regulates the BMDM polarity.

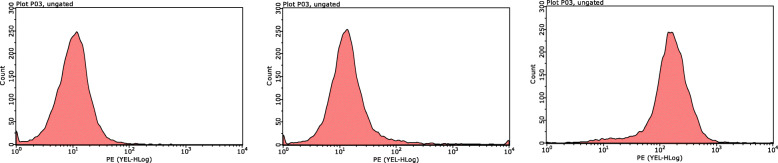
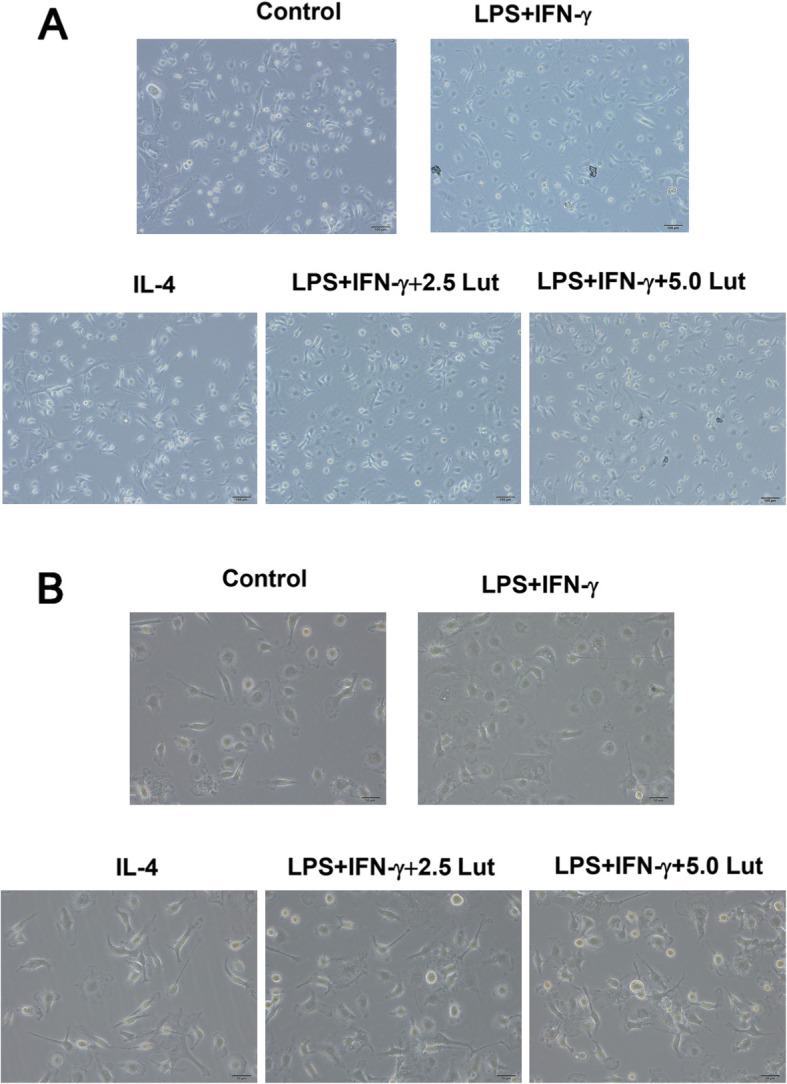
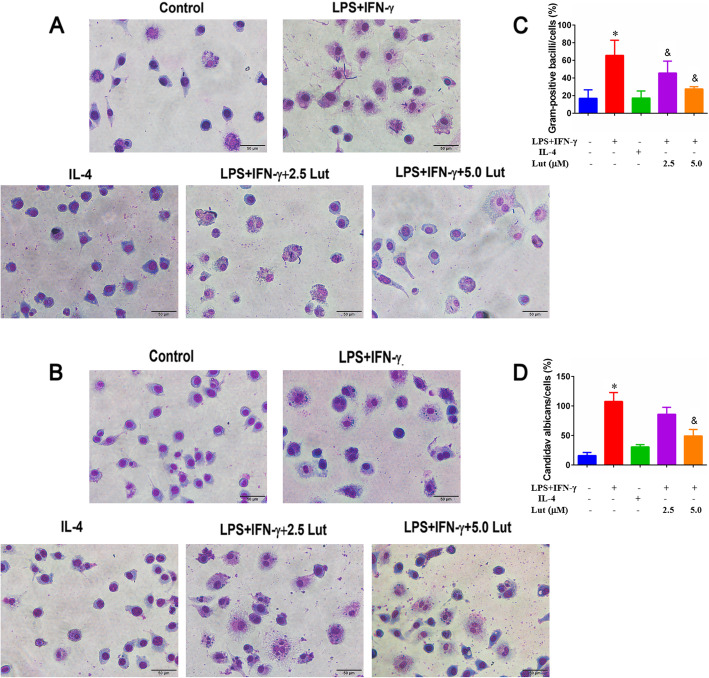
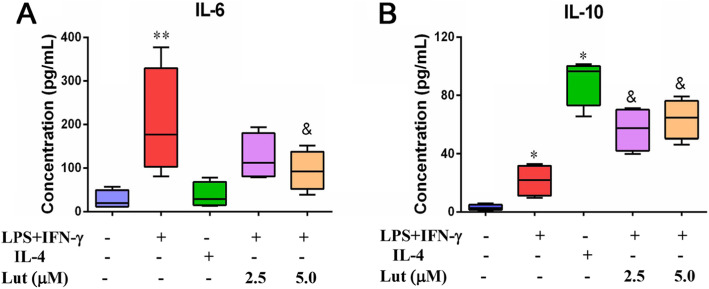
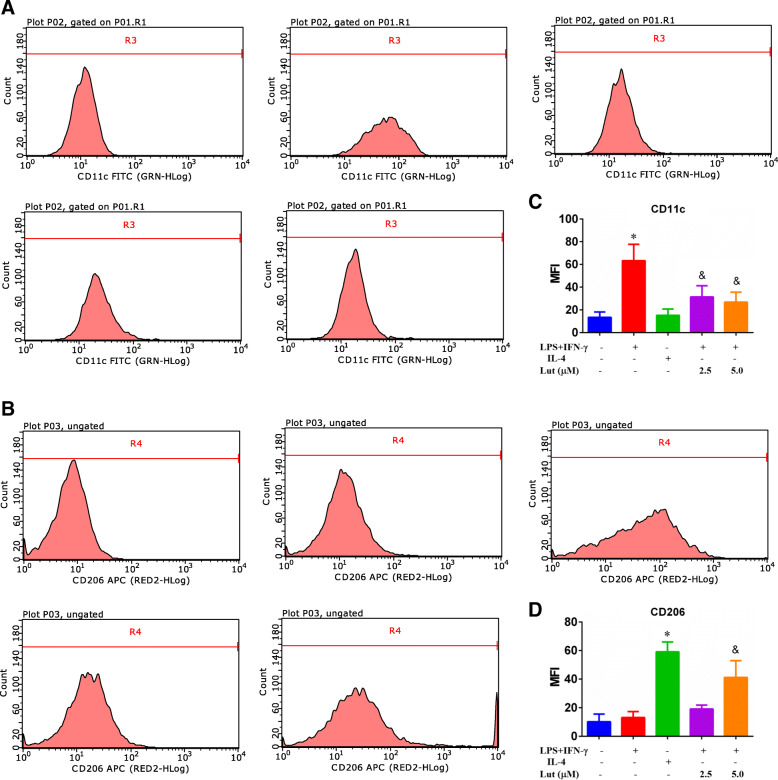
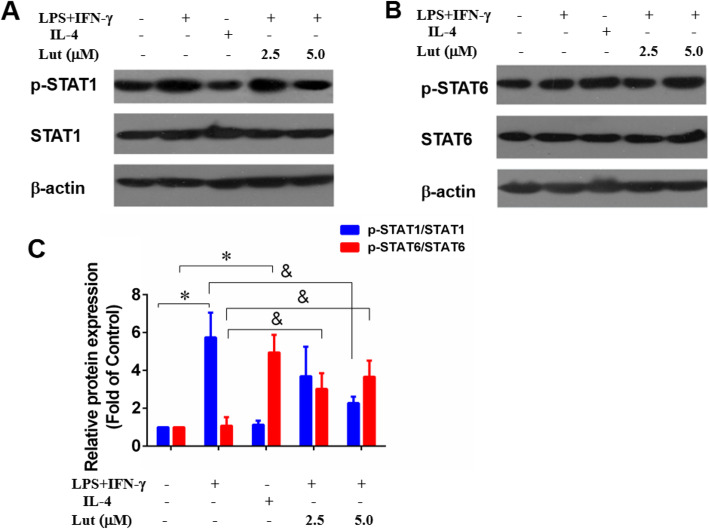
Methods: M1-polarised BMDMs were induced by lipopolysaccharide (LPS) + interferon (IFN)-γ and M2-polarisation were stimulated with interleukin (IL)-4. BMDM morphology and phagocytosis were observed by laser confocal microscopy; levels of BMDM differentiation and cluster of differentiation (CD)11c or CD206 on the membrane surface were assessed by flow cytometry (FCM); mRNA and protein levels of M1/M2-type inflammatory factors were performed by qPCR and ELISA, respectively; and the expression of p-STAT1 and p-STAT6 protein pathways was detected by Western-blotting.

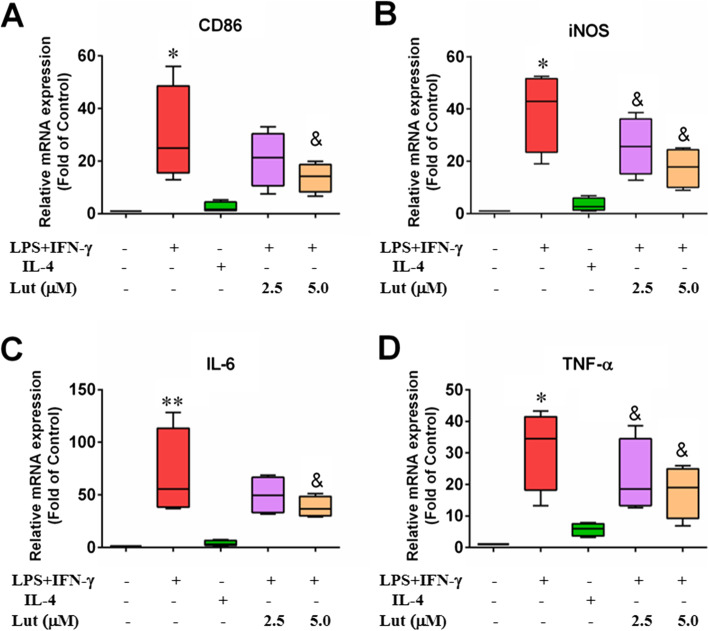
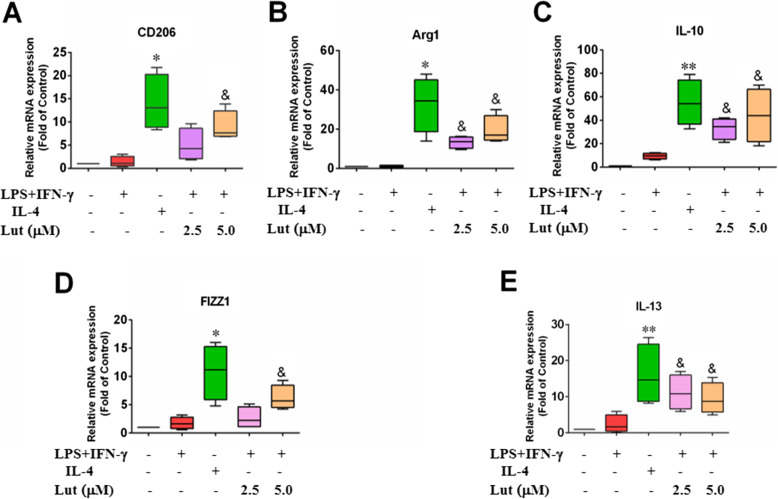
Results: The isolated mouse bone marrow cells were successfully differentiated into BMDMs, LPS + IFN-γ induced BMDM M1-phenotype polarisation, and IL-4 induced M2-phenotype polarisation. After M1-polarised BMDMs were treated with luteolin, the phagocytosis of M1-polarized BMDMs was reduced, and the M1-type pro-inflammatory factors including IL-6, tumour necrosis factor (TNF)-α, inducible nitric oxide synthase (iNOS), and CD86 were downregulated while the M2-type anti-inflammatory factors including IL-10, IL-13, found in inflammatory zone (FIZZ)1, Arginase (Arg)1 and CD206 were upregulated. Additionally, the expression of M1-type surface marker CD11c decreased. Nevertheless, the M2-type marker CD206 increased; and the levels of inflammatory signalling proteins phosphorylated signal transducer and activator of transcription (p-STAT)1 and p-STAT6 were attenuated and enhanced, respectively.

Conclusions: Our study suggests that luteolin may transform BMDM polarity through p-STAT1/6 to regulate the expression of inflammatory mediators, thereby inhibiting inflammation. Naturally occurring luteolin holds promise as an anti-inflammatory and immunomodulatory agent.

Keywords: Bone marrow-derived macrophage polarisation; Cytokines; Inflammation; Luteolin.


Conflict of interest statement

The authors declare that they have no competing interests.

Figures

Fig. 1
Fig. 1
The differentiation proportion of BMDM. FCM detected the surface marker F4/80 of BMDMs after induction for 7 days, and the positive rate was 92.71%
Fig. 2
Fig. 2
Effect of luteolin on the viability of LPS + IFN-γ-primed BMDMs. a Structure of luteolin. b BMDMs were primed with LPS + IFN-γ and contributed with indicated doses of luteolin for 24 h, and then the cell viability was assessed by MTT assay. Data represent the mean ± SD of three independent experiments performed in triplicate. Different symbols indicate a significant difference according to ANOVA and Tukey’s test. *P < 0.05 vs. control group (non-treated control); &P < 0.05 vs. LPS + IFN-γ-treated group
Fig. 3
Fig. 3
The morphology of polarised BMDMs (a. 200×; b. 400×). BMDMs were polarised with LPS + IFN-γ or IL-4, simultaneously, BMDMs exposed to LPS + IFN-γ were administrated with luteolin for 24 h. Micrographs of BMDMs were observed using a bright-field Olympus imaging system
Fig. 4
Fig. 4
Effect of luteolin on the phagocytic activity in polarised BMDMs. The BMDMs that have phagocytosed Gram-positive bacilli (a) or Candida albicans (b) are stained with Wright-Giemsa Stain to visualize in the field. Phagocytosis of pathogens was determined by counting at least 50 cells per well, and the number of Gram-positive bacilli/cells (c) or Candida albicans/cells (d) were graphed in the histograms. Arrows indicate phagocytic cells. Data represent the mean ± SD of three independent experiments performed in duplicate. Different symbols indicate a significant difference according to ANOVA and Tukey’s test. *P < 0.05 vs. control group; &P < 0.05 vs. LPS + IFN-γ-treated group
Fig. 5
Fig. 5
Effect of luteolin on the expression of M1-type pro-inflammatory factors in activated BMDMs. The M1-type mRNA molecules were determined by qPCR with GAPDH as an internal control. BMDMs were primed with LPS + IFN-γ or IL-4, and LPS + IFN-γ-treated-BMDMs were incubated with indicated doses of luteolin for 24 h. As a result, the relative M1-type mRNA levels of CD86 (a), iNOS (b), IL-6 (c) and TNF-α (d) in M1-polarised macrophages reduced slowly. Data represent the mean ± SD of four independent experiments performed in duplicate. Different symbols indicate a significant difference according to ANOVA and Tukey’s test. *P < 0.05, **P < 0.01 vs. control group (non-treated control); &P < 0.05 vs. LPS + IFN-γ-treated group
Fig. 6
Fig. 6
Effect of luteolin on the expression of M2-type anti-inflammatory factors in activated BMDMs. The M2-type mRNA molecules were assessed by qPCR with GAPDH as an internal control. BMDMs were primed with LPS + IFN-γ or IL-4, and LPS + IFN-γ-treated BMDMs incubated with the indicated doses of luteolin for 24 h, then the relative M2-type mRNA levels CD206 (a), Arg1 (b), IL-10 (c), FIZZ1 (d) and IL-13 (e) in M1-polarised macrophages elevated gradually. Data represent the mean ± SD of four independent experiments performed in duplicate. Different symbols indicate a significant difference according to ANOVA and Tukey’s test. *P < 0.05, **P < 0.01 vs. control group (without treatment); &P < 0.05 vs. LPS + IFN-γ-treated group
Fig. 7
Fig. 7
Effect of luteolin on IL-6 and IL-10 levels in polarised BMDMs. BMDMs were primed with LPS + IFN-γ or IL-4, followed by luteolin exposure for 24 h. Supernatants were harvested, and levels of IL-6 (a) and IL-10 (b) secreted from the M1-polarised BMDMs were measured via ELISA. Data represent the mean ± SD of four independent experiments performed in duplicate. Different symbols indicate a significant difference according to ANOVA and Tukey’s test. *P < 0.05 vs. control group (without treatment); &P < 0.05 vs. LPS + IFN-γ-treated group
Fig. 8
Fig. 8
Effect of luteolin on the expression of BMDM surface markers CD11c and CD206. The BMDMs were stimulated with LPS + IFN-γ or IL-4, followed by luteolin treatment for 24 h. The expression levels of CD11c (a) and CD206 (b) protein on BMDMS are presented as MFI as evaluated by FCM. The histograms present the MFI of CD11c (c) and CD206 (d). Data represent the mean ± SD of three independent experiments. Different symbols indicate a significant difference according to ANOVA and Tukey’s test. *P < 0.05 vs. control group (without treatment); &P < 0.05 vs. LPS + IFN-γ-treated group
Fig. 9
Fig. 9
Effects of luteolin on the protein levels of p-STAT1/6 in polarised BMDMs. The BMDMs were primed with LPS + IFN-γ or IL-4, and then for addition of luteolin for 24 h. Total cell lysates were analysed by immunoblotting for the indicated antibody, and β-actin was used as the loading control. Representative immunoblots of p-STAT1 (a) and p-STAT6 (b); the relative protein levels of p-STAT1 and p-STAT6 (c) by densitometric analysis. Data represent the mean ± SD of three independent experiments. Different symbols indicate a significant difference according to ANOVA and Tukey’s test. *P < 0.05 vs. control group (without treatment); &P < 0.05 vs. LPS + IFN-γ-treated group

Similar articles

Cited by

References

    1. Chousterman BG, Swirski FK, Weber GF. Cytokine storm and sepsis disease pathogenesis. Semin Immunopathol. 2017;39:517–528. doi: 10.1007/s00281-017-0639-8. - DOI - PubMed
    1. Greten FR, Grivennikov SI. Inflammation and cancer: triggers, mechanisms, and consequences. Immunity. 2019;51:27–41. doi: 10.1016/j.immuni.2019.06.025. - DOI - PMC - PubMed
    1. Peter AE, Sandeep BV, Rao BG, Kalpana VL. Calming the storm: natural Immunosuppressants as adjuvants to target the cytokine storm in COVID-19. Front Pharmacol. 2021;11:583777. doi: 10.3389/fphar.2020.583777. - DOI - PMC - PubMed
    1. Li H, Liu L, Zhang DY, Xu JY, Dai HP, Tang N, et al. SARS-CoV-2 and viral sepsis: observations and hypotheses. Lancet. 2020;395:1517–1520. doi: 10.1016/S0140-6736(20)30920-X. - DOI - PMC - PubMed
    1. Liu Q, Zhou YH, Yang ZQ. The cytokine storm of severe influenza and development of immunomodulatory therapy. Cell Mol Immunol. 2016;13:3–10. doi: 10.1038/cmi.2015.74. - DOI - PMC - PubMed