. 2021 May 31;22(1):166.
doi: 10.1186/s13059-021-02383-2.

Impacts of allopolyploidization and structural variation on intraspecific diversification in Brassica rapa

Affiliations

Impacts of allopolyploidization and structural variation on intraspecific diversification in Brassica rapa

Xu Cai et al. Genome Biol. .

Abstract

Background: Despite the prevalence and recurrence of polyploidization in the speciation of flowering plants, its impacts on crop intraspecific genome diversification are largely unknown. Brassica rapa is a mesopolyploid species that is domesticated into many subspecies with distinctive morphotypes.

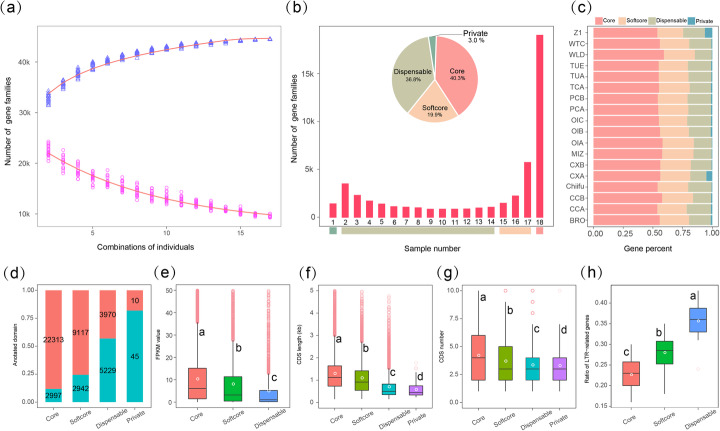
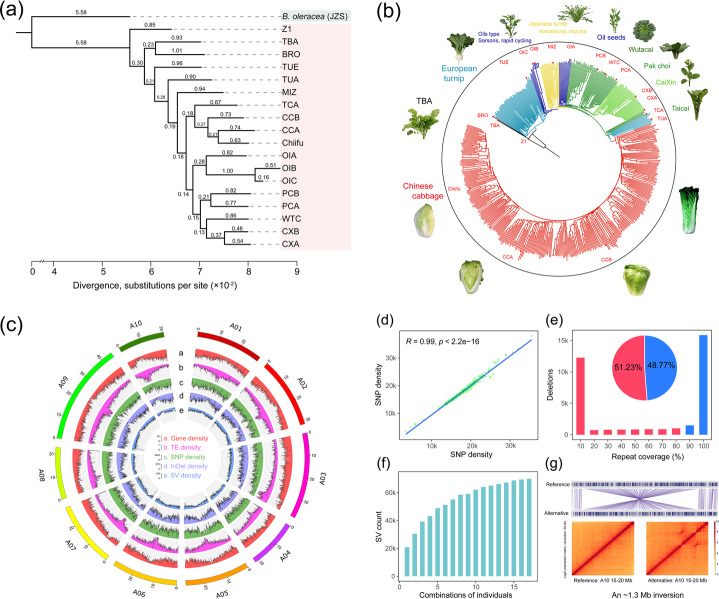
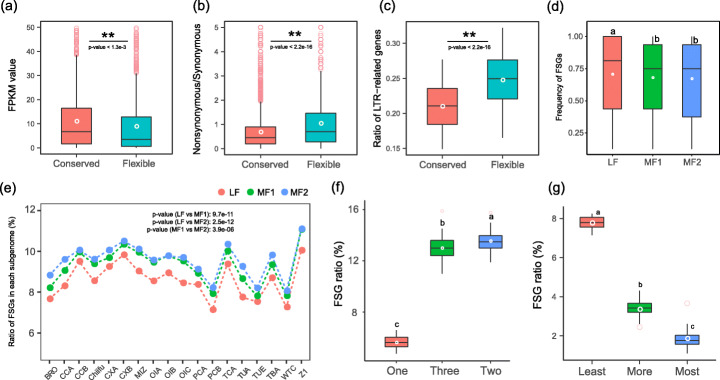
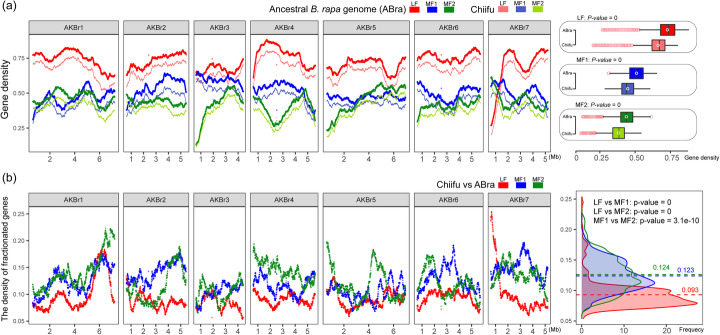
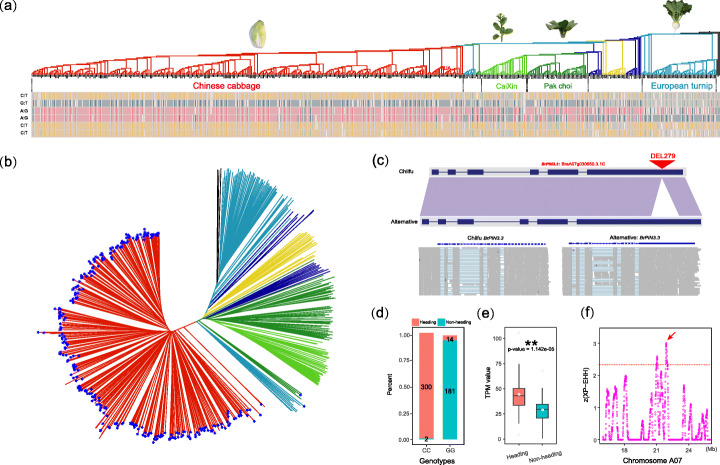
Results: Herein, we report the consequences of the whole-genome triplication (WGT) on intraspecific diversification using a pan-genome analysis of 16 de novo assembled and two reported genomes. Among the genes that derive from WGT, 13.42% of polyploidy-derived genes accumulate more transposable elements and non-synonymous mutations than other genes during individual genome evolution. We denote such genes as being "flexible." We construct the Brassica rapa ancestral genome and observe the continuing influence of the dominant subgenome on intraspecific diversification in B. rapa. The gene flexibility is biased to the more fractionated subgenomes (MFs), in contrast to the more intact gene content of the dominant LF (least fractionated) subgenome. Furthermore, polyploidy-derived flexible syntenic genes are implicated in the response to stimulus and the phytohormone auxin; this may reflect adaptation to the environment. Using an integrated graph-based genome, we investigate the structural variation (SV) landscapes in 524 B. rapa genomes. We observe that SVs track morphotype domestication. Four out of 266 candidate genes for Chinese cabbage domestication are speculated to be involved in the leafy head formation.

Conclusions: This pan-genome uncovers the possible contributions of allopolyploidization on intraspecific diversification and the possible and underexplored role of SVs in favorable trait domestication. Collectively, our work serves as a rich resource for genome-based B. rapa improvement.


Conflict of interest statement

The authors declare that they have no competing interests.

Figures

Fig. 1
Fig. 1
Composition and characteristics of the B. rapa pan-genome. a Pan-genome models for B. rapa. The upper and lower curves show the number of total and core gene families after different combinations of individuals. b Compositions of the B. rapa pan-genome. The histogram shows the number of gene families in the 18 genomes with different frequencies. The pie chart shows the proportion of the gene families marked by each composition. c Number of classified genes in each genome. d Proportion of genes with InterPro domains in the Chiifu core genes, softcore genes, dispensable genes, and private genes. Orange and green bars represent genes with InterPro domain annotations and genes without InterPro domain annotations. e The expression level of core, softcore, and dispensable genes in the Chiifu genome. f, g CDS length (f) and CDS number (g) of each gene in Chiifu core, softcore, dispensable, and private genes. h The ratio of LTR-related genes in core, softcore, and dispensable genes. An LTR-related gene is defined as a gene with insertions of LTR-RTs in the regions of 2 kb upstream and downstream of the gene body. The white dots indicate the average value in all figures, and multiple comparisons were performed by the Student-Newman-Keuls test with a = 0.01 (same as presented in Figs. 3 and 4)
Fig. 2
Fig. 2
Phylogeny and variation landscapes from 18 B. rapa representative genomes and 524 resequenced accession genomes. a Phylogenetic relationships of 18 B. rapa accessions using B. oleracea as an outgroup. The branch length values represent divergence between accessions with B. oleracea. b A neighbor-joining tree of 524 B. rapa accessions. Different colors indicate the accessions within different sub-populations, and the 18 B. rapa genomes are specifically marked with red stars. Representative morphological pictures are displayed next to the corresponding sub-populations. c Distribution of genomic variants from 18 genomes and 524 accessions on 10 B. rapa chromosomes using Chiifu as the reference. d Correlation between SNP densities detected by resequencing data of the B. rapa germplasm (x-axis) and comparison of de novo assemblies (y-axis). We calculated the number of SNPs in a bin with a size of 500 kb. e SV number plots against repetitive sequences. We used deletion sequences to evaluate the correlation between SV and repetitive sequences involvement. Red (blue) indicates that the proportion of repetitive sequences in the SV sequence is less (greater) than 80%. f The number of SVs after different combinations of individuals. g An ~1.3 Mb inversion specifically occurred in the Chiifu and CCB genomes
Fig. 3
Fig. 3
Gene flexibility increased during the period of intraspecific genome diversification in B. rapa. a Comparison of the expression levels of homoeologous pairs consisting of conserved and flexible syntenic genes in the Chiifu genome. “Conserved” and “Flexible” represent conserved and flexible syntenic gene in the homoeologous pair. The P value was calculated based on a paired t test. b The ratio of nonsynonymous to synonymous SNPs in CSGs and FSGs. c The ratio of LTR-related genes in CSGs and FSGs. d Frequencies of FSGs in the three B. rapa subgenomes. e Ratio of FSGs in the three subgenomes of the 18 B. rapa genomes. f The ratio of FSGs in single-, two-, and three-copy gene sets of the 18 genomes. g Ratio of least, more, and most flexible syntenic genes in the three-copy genes
Fig. 4
Fig. 4
The dominance of the LF subgenome during intraspecific diversification in B. rapa. a Gene density in the three subgenomes of the inferred B. rapa ancestral genome and Chiifu genome. The inferred B. rapa ancestral genome was constructed using the 18 genomes with A. thaliana as the reference. The Chiifu genome is used as a representative to illustrate intraspecies diversification in B. rapa. Gene density was calculated based on an ancestral karyotype of Brassiceae (AKBr). b The density of fractionated genes during the formation of the Chiifu genome. The x-axis indicates the seven inferred chromosomes of the inferred B. rapa ancestral genome based on AKBr. The y-axis indicates the ratio of fractionated genes to the genes in each bin of the inferred ancestral genome during the formation of the Chiifu genome. A 500-gene sliding window with an increment of two genes was adopted to calculate the gene density in a and b. The figure on the right shows the distribution of ratios of fractionated genes to the genes in each bin of the inferred ancestral genome, and the dotted line represents the average of these ratios in each subgenome
Fig. 5
Fig. 5
The number of WGT-derived genes in the three subgenomes of Brassiceae species and their inferred ancestral genomes. Red, blue, and green represent the number of genes (gene ratio) in the three subgenomes of the three Brasica diploids and Raphanus sativus. The red dots represent the inferred ancestral genome of Brassiceae species (ABrassiceae) and the ancestral genome of B. rapa and B. oleracea (ABra_Bol). The pink lines indicate B. rapa speciation and intraspecific diversification. This figure is based on information published previously by Cheng et al. [55]
Fig. 6
Fig. 6
Structural variation in BrPIN3.3 is associated with B. rapa heading morphotype domestication. a The distribution of haplotypes in the BrPIN3.3 gene region in 524 genomes. The numerical suffix denotes a gene’s location on the subgenome LF, MF1, or MF2. Homozygous sites of AA, CC, GG, and TT are filled using different colors as described in the figure, while missing loci (NN) and heterozygous loci (Hetero) are not filled with color. b The distribution of one of the BrPIN3.3 genotypes in 524 accessions. Accessions with a 279 bp deletion in BrPIN3.3 are marked using blue stars. c Micro-synteny analysis between the two genotypes of BrPIN3.3. RNA-seq reads of different accessions were collected and mapped onto the two genotypes. d The genotype of the structural variation in the BrPIN3.3 gene region in 524 accessions. CC indicates that the genotype in the corresponding accession was consistent with the reference genome, and GG indicates that the genotype in the accession was different from the reference genome. e The expression level in TPM of BrPIN3.3 in 44 heading and 42 non-heading accessions. CC (Chinese cabbage) and others represent heading and non-heading types, respectively. f XP-EHH values are normalized as z-scores for B. rapa on A07. A 200-kb sliding window with an increment of 5 kb was used to calculate these normalized XP-EHH values. Each point represents a value in a 200-kb window, and the horizontal dashed line presents the empirical threshold of α = 0.01 (z = 2.33). The arrow indicates the location of the BrPIN3.3 gene

References

    1. Freeling M, Scanlon MJ, Fowler JE. Fractionation and subfunctionalization following genome duplications: mechanisms that drive gene content and their consequences. Curr Opin Genet Dev. 2015;35:110–118. doi: 10.1016/j.gde.2015.11.002. - DOI - PubMed
    1. Soltis PS, Soltis DE. Ancient WGD events as drivers of key innovations in angiosperms. Curr Opin Plant Biol. 2016;30:159–165. doi: 10.1016/j.pbi.2016.03.015. - DOI - PubMed
    1. Tank DC, Eastman JM, Pennell MW, Soltis PS, Soltis DE, Hinchliff CE, Brown JW, Sessa EB, Harmon LJ. Nested radiations and the pulse of angiosperm diversification: increased diversification rates often follow whole genome duplications. New Phytol. 2015;207(2):454–467. doi: 10.1111/nph.13491. - DOI - PubMed
    1. Van de Peer Y, Mizrachi E, Marchal K. The evolutionary significance of polyploidy. Nat Rev Genet. 2017;18(7):411–424. doi: 10.1038/nrg.2017.26. - DOI - PubMed
    1. Zhang K, Wang XW, Cheng F. Plant polyploidy: origin, evolution, and its influence on crop domestication. Horticultural Plant J. 2019;5:231–239. doi: 10.1016/j.hpj.2019.11.003. - DOI

Publication types

LinkOut - more resources