. 2021 Jun 1:10:e58775.
doi: 10.7554/eLife.58775.

Miniaturized 3D bone marrow tissue model to assess response to Thrombopoietin-receptor agonists in patients

Affiliations

Miniaturized 3D bone marrow tissue model to assess response to Thrombopoietin-receptor agonists in patients

Christian A Di Buduo et al. Elife. .

Abstract

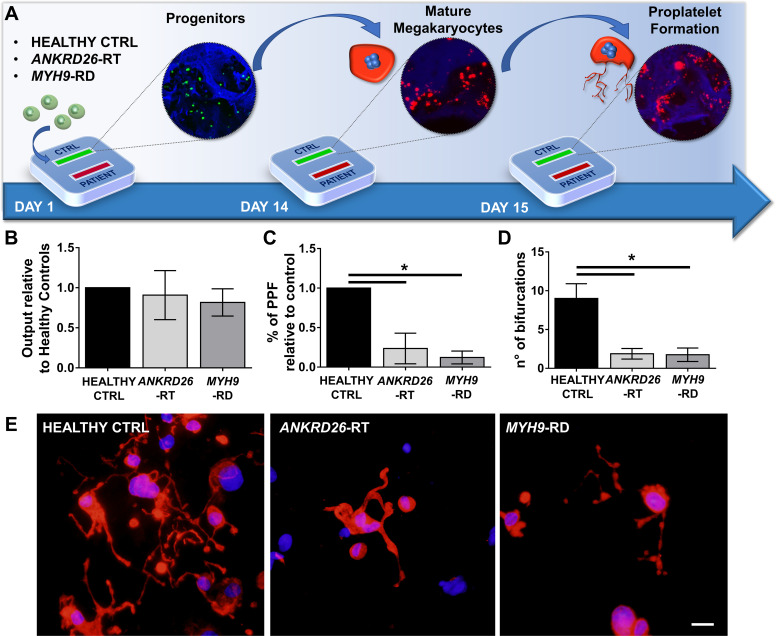
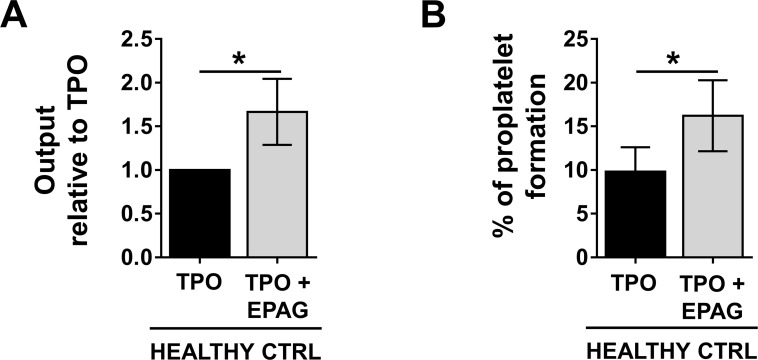
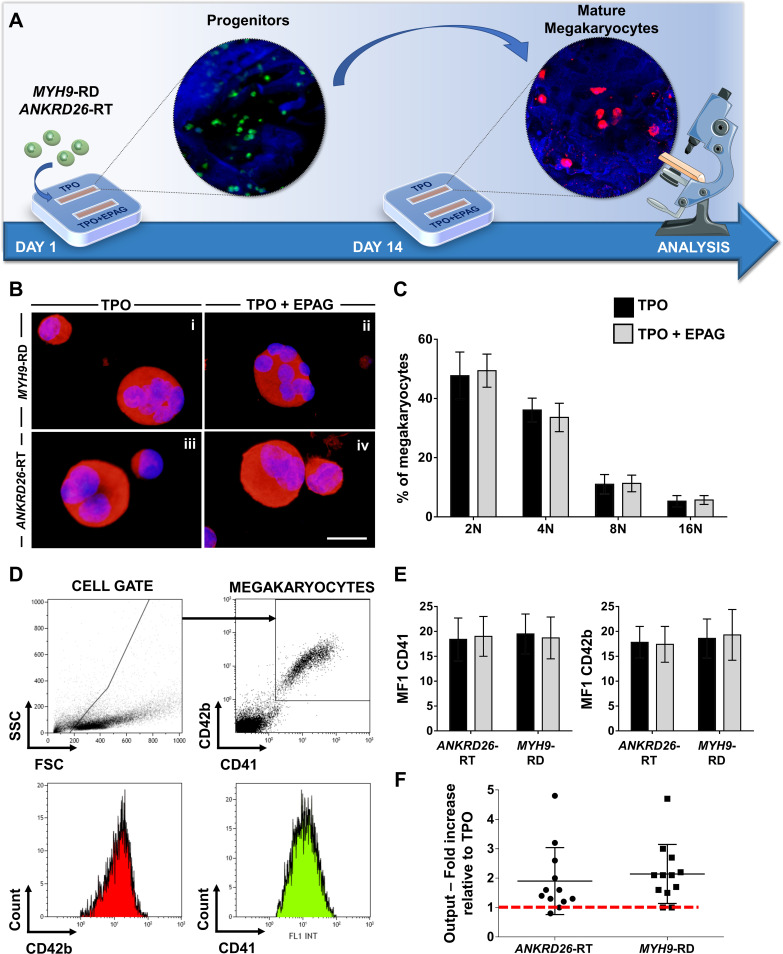
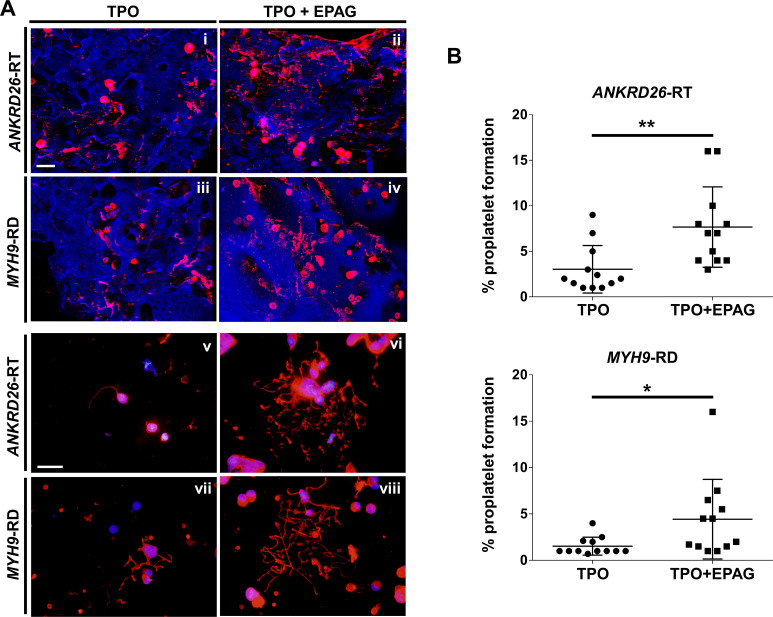
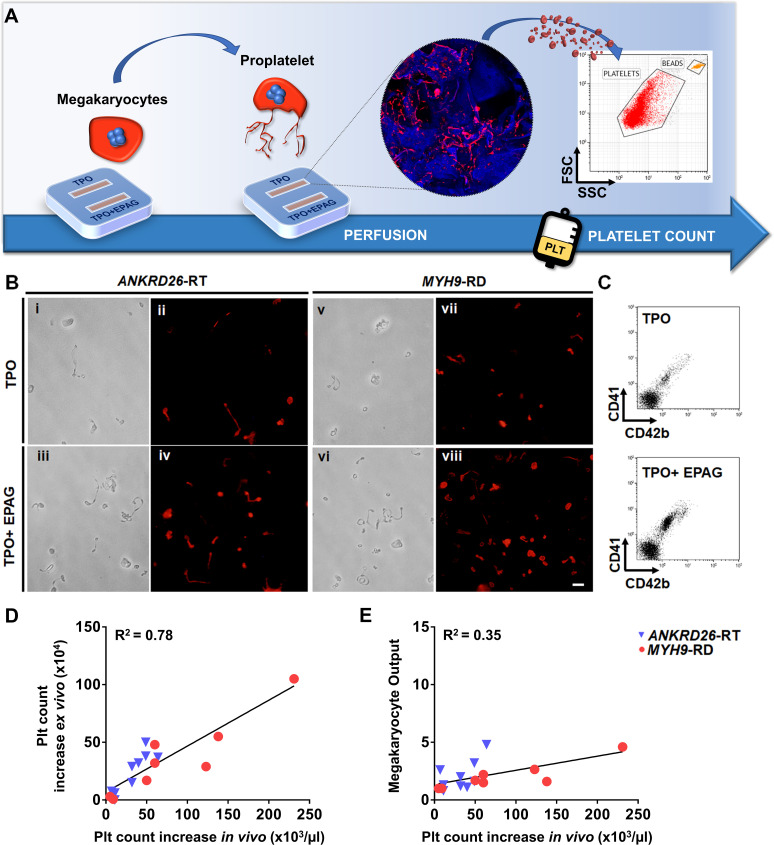
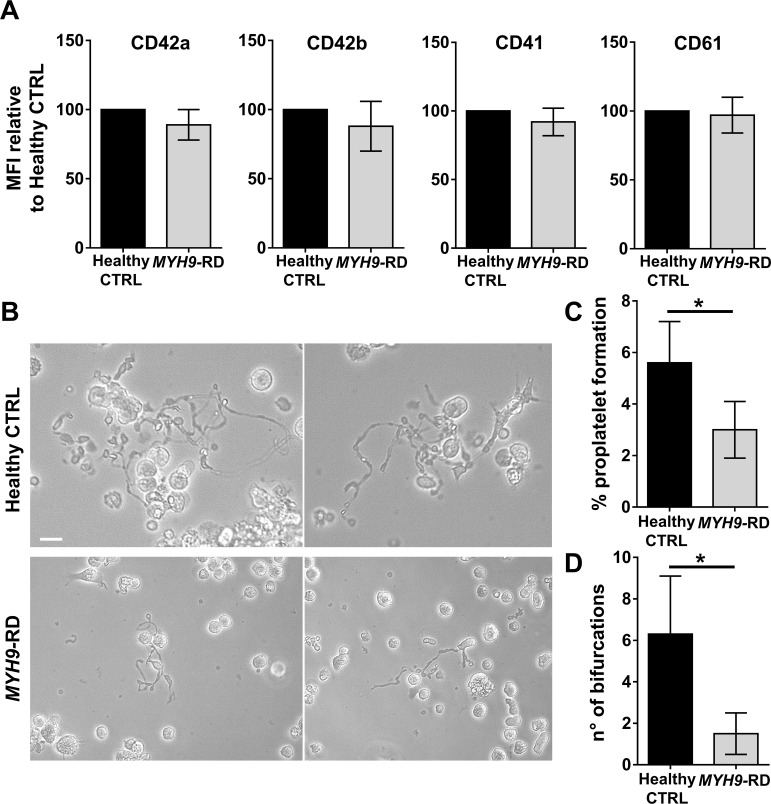
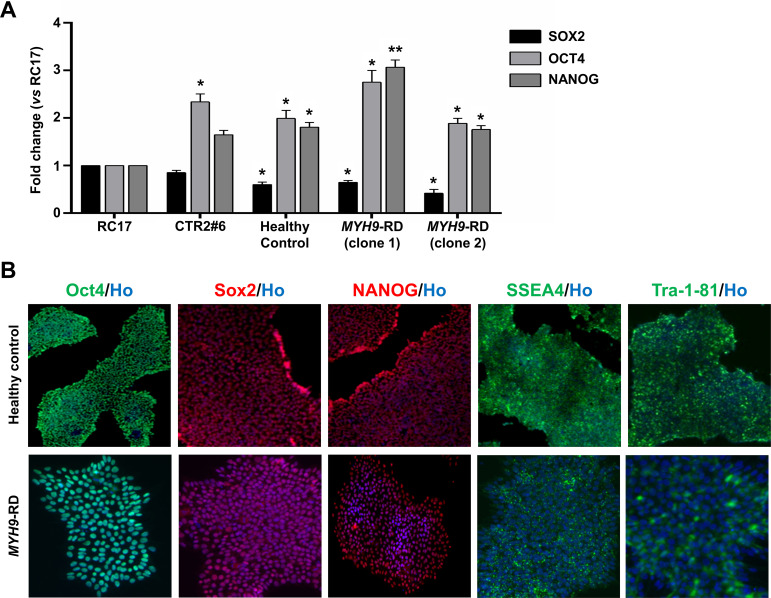
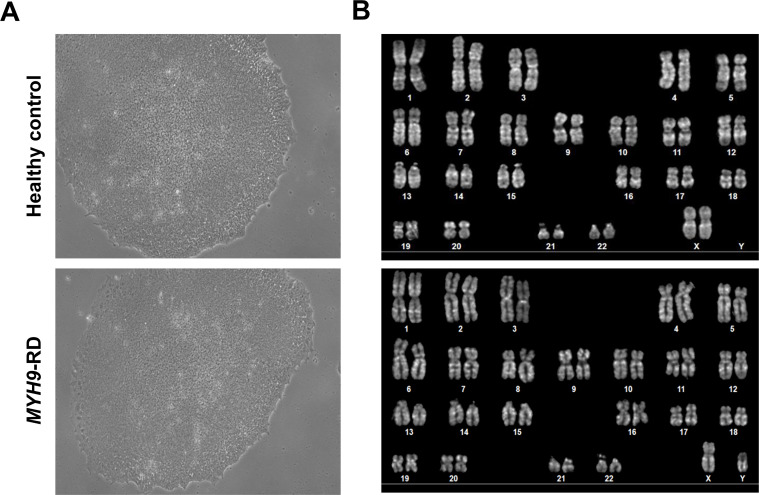
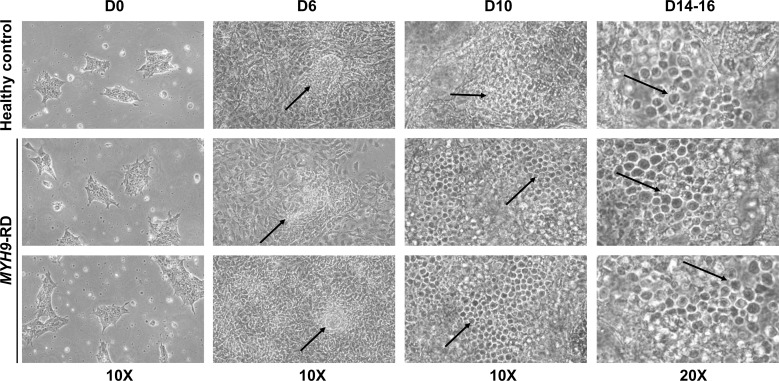
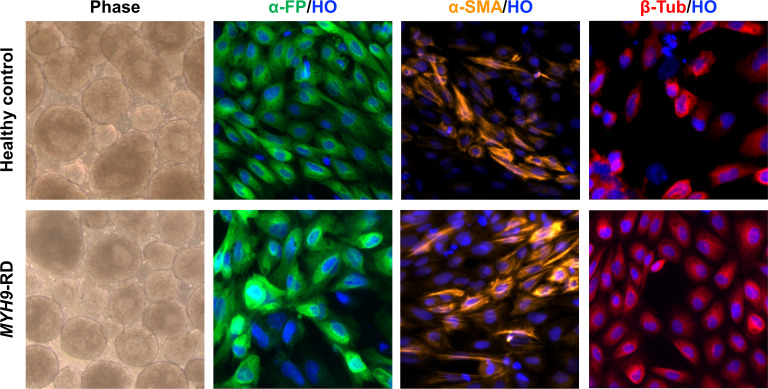
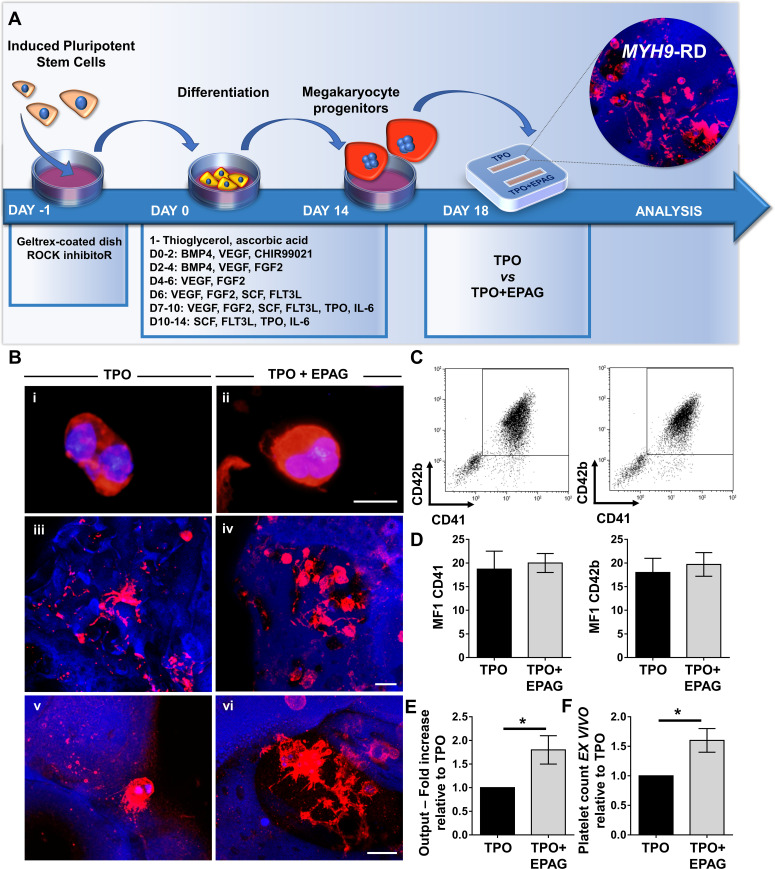
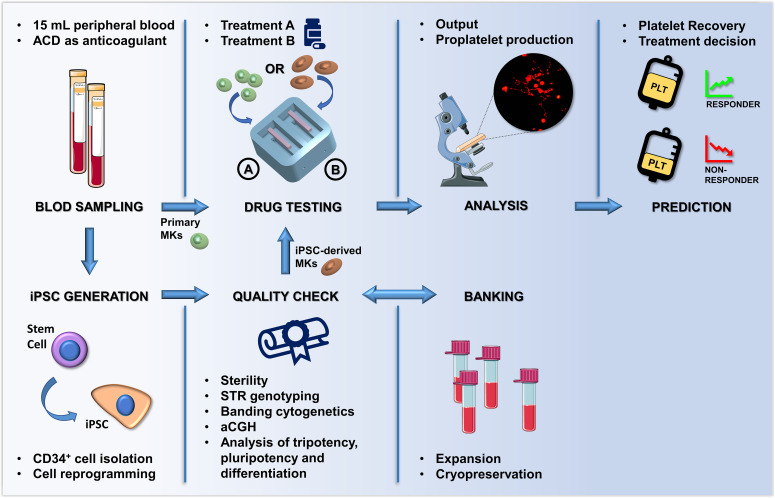
Thrombocytopenic disorders have been treated with the Thrombopoietin-receptor agonist Eltrombopag. Patients with the same apparent form of thrombocytopenia may respond differently to the treatment. We describe a miniaturized bone marrow tissue model that provides a screening bioreactor for personalized, pre-treatment response prediction to Eltrombopag for individual patients. Using silk fibroin, a 3D bone marrow niche was developed that reproduces platelet biogenesis. Hematopoietic progenitors were isolated from a small amount of peripheral blood of patients with mutations in ANKRD26 and MYH9 genes, who had previously received Eltrombopag. The ex vivo response was strongly correlated with the in vivo platelet response. Induced Pluripotent Stem Cells (iPSCs) from one patient with mutated MYH9 differentiated into functional megakaryocytes that responded to Eltrombopag. Combining patient-derived cells and iPSCs with the 3D bone marrow model technology allows having a reproducible system for studying drug mechanisms and for individualized, pre-treatment selection of effective therapy in Inherited Thrombocytopenias.

Keywords: Induced Pluripotent Stem Cell; Inherited Thrombocytopenia; bone marrow; human; medicine; megakaryocyte; silk; thrombopoietin.

Plain language summary

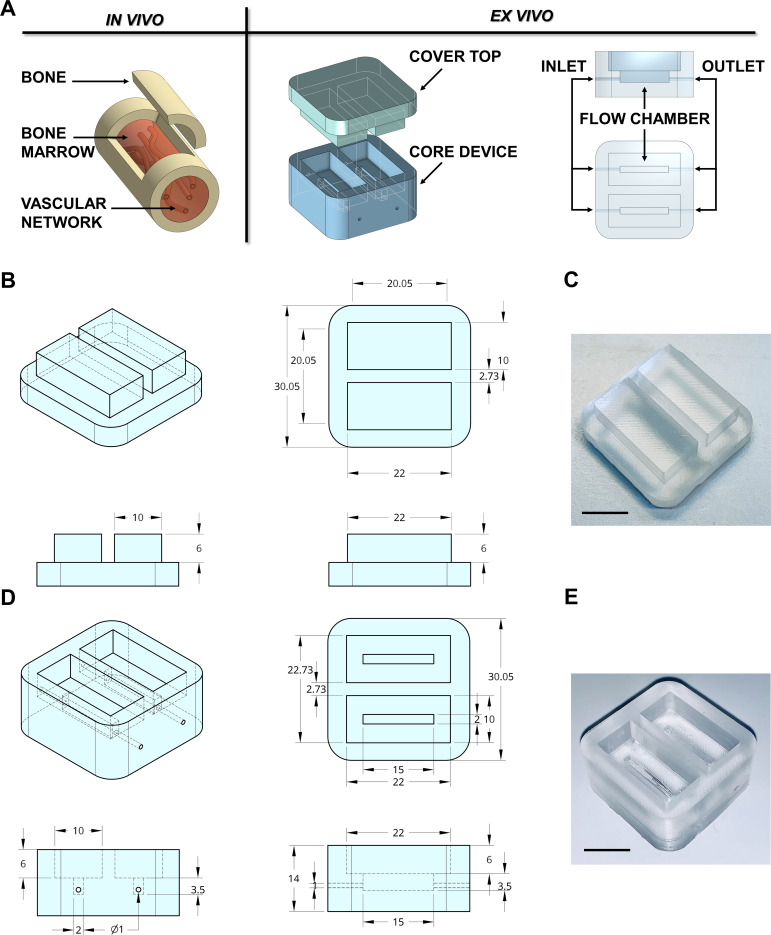
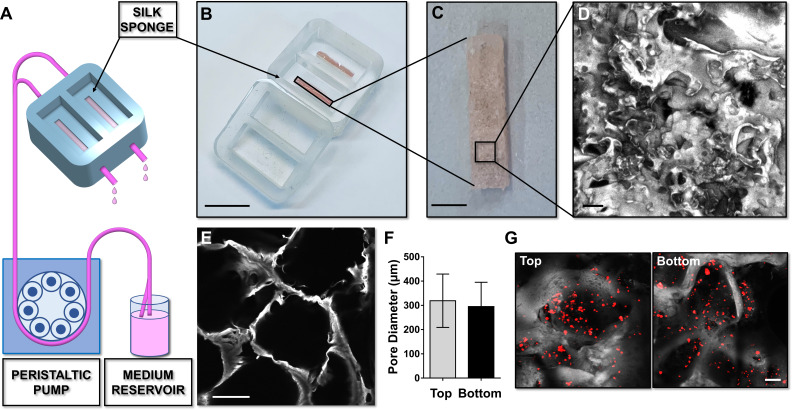
Platelets are tiny cell fragments essential for blood to clot. They are created and released into the bloodstream by megakaryocytes, giant cells that live in the bone marrow. In certain genetic diseases, such as Inherited Thrombocytopenia, the bone marrow fails to produce enough platelets: this leaves patients extremely susceptible to bruising, bleeding, and poor clotting after an injury or surgery. Certain patients with Inherited Thrombocytopenia respond well to treatments designed to boost platelet production, but others do not. Why these differences exist could be investigated by designing new test systems that recreate the form and function of bone marrow in the laboratory. However, it is challenging to build the complex and poorly understood bone marrow environment outside of the body. Here, Di Buduo et al. have developed an artificial three-dimensional miniature organ bioreactor system that recreates the key features of bone marrow. In this system, megakaryocytes were grown from patient blood samples, and hooked up to a tissue scaffold made of silk. The cells were able to grow as if they were in their normal environment, and they could shed platelets into an artificial bloodstream. After treating megakaryocytes with drugs to stimulate platelet production, Di Buduo et al. found that the number of platelets recovered from the bioreactor could accurately predict which patients would respond to these drugs in the clinic. This new test system enables researchers to predict how a patient will respond to treatment, and to tailor therapy options to each individual. This technology could also be used to test new drugs for Inherited Thrombocytopenias and other blood-related diseases; if scaled-up, it could also, one day, generate large quantities of lab-grown blood cells for transfusion.


Conflict of interest statement

CD, PL, CZ, LL, PS, AN, SB, AL, IB, HR, DK, CB, AP, AB No competing interests declared, JB James B Bussel is consultant and participant in advisory boards for Amgen, Novartis, Dova, Rigel, UCB, Argenx, Momenta, Regeneron

Figures

Figure 1.
Figure 1.. Design of the bone marrow mimicking device.
(A) To mimic the vascularized bone marrow tissue structure ex vivo a double-flow chamber device was designed in two parts. The core contains two separates flow channels dedicated to the perfusion having inlet and outlet ports for connection to a perfusion system. (B,C) The dimension of the polydimethylsiloxane (PDMS) mold cover top and (D,E) the core device is expressed in millimeters. Alternative models of the device are shown in Figure 1—figure supplement 1. The 3D-printed negative mold of the chamber is shown in Figure 1—figure supplement 2.
Figure 1—figure supplement 1.
Figure 1—figure supplement 1.. Various models of the silk bone marrow device.
The devices can be produced from one to four perfusion channels and molded with PDMS (scale bars = 10 mm).
Figure 1—figure supplement 2.
Figure 1—figure supplement 2.. 3D printing of the negative mold.
(A) Drawing of negative molds for the core device (upper panel) and the cover tap (lower panel) are disposed in isometric view, right view, top view, and transversal section view, respectively. Dimensions are in millimeters. (B) The production is operated by an FDM 3D printer using PLA and (C) needles are finally mounted to connect the future inlet and outlet for perfusion of the chamber.
Figure 2.
Figure 2.. Silk sponge bone marrow perfusion system.
(A–C) A peristaltic pump drives perfusion of the cell culture medium from a reservoir to the device equipped with a silk fibroin sponge prepared directly inside the chamber by dispensing an aqueous silk solution mixed with salt particles (scale bar B = 1.5 cm; scale bar C = 2 mm). After leaching out the salt, the resulting porous silk sponge can be sterilized. (D,E) Confocal microscopy reconstruction of the silk sponge showed the presence of an interconnected alveolar network (scale bar D = 200 µm; scale bar E = 150 µm). (F) The analysis of pore diameters measured on the top and bottom of the scaffold demonstrated no significant differences throughout the scaffold. Results are presented as mean ± SD (n = 150 pore/condition, p=NS). (G) Confocal microscopy analysis of CFSE+ cells cultured within the silk scaffold (red = CFSE; gray = silk; scale bar = 50 µm). The full data set is provided in Figure 2—source data 1.
Figure 3.
Figure 3.. Modeling physiological and pathological megakaryopoiesis.
(A) Megakaryocytes were differentiated from healthy controls and patients affected by MYH9-RD and ANKRD26-RT patients and cultured into the bone marrow device in presence of 10 ng/mL TPO. (B) Output of CD41+CD42b+ megakaryocyte at the end of differentiation relative to healthy controls (n = 12 Healthy Controls, n = 12 MYH9-RD; n = 12 ANKRD26-RT) (C) Percentage of proplatelet formation relative to healthy controls (n = 12 Healthy Controls, n = 12 MYH9-RD; n = 12 ANKRD26-RT; *p<0.01). (D) The number of proplatelet bifurcation per single megakaryocytes in healthy controls and patients (n = 12 Healthy Controls, n = 12 MYH9-RD; n = 12 ANKRD26-RT; *p<0.01). (E) Representative immunofluorescence staining of proplatelet structure (red=β1-tubulin; blue = nuclei; scale bar = 20 µm). All results are presented as mean ± SD. Data from the treatment of healthy controls in the presence of TPO and TPO +EPAG are shown in Figure 3—figure supplement 1. The full data set is provided in Figure 3—source data 1.
Figure 3—figure supplement 1.
Figure 3—figure supplement 1.. Eltrombopag is effective in promoting thrombopoiesis from healthy controls.
(A) Output of CD41+CD42b+ healthy control megakaryocytes at the end of differentiation cultured in the presence of TPO +EPAG, with respect to TPO alone (n = 6, *p<0.01). (B) The percentage of proplatelet forming-megakaryocytes was calculated as the number of cells displaying long filamentous pseudopods with respect to the total number of round megakaryocytes per analyzed field (n = 6; *p<0.01). All results are presented as mean ± SD. The full data set is provided in Figure 3—source data 1.
Figure 4.
Figure 4.. Eltrombopag promotes megakaryocyte differentiation ex vivo.
(A) Megakaryocytes were differentiated from peripheral blood progenitors of patients affected by MYH9-RD or ANKRD26-RT and cultured in the silk bone marrow tissue device in the presence of 10 ng/mL TPO supplemented or not with 500 ng/mL Eltrombopag (EPAG) and analyzed. The figure of the microscope was adapted from Servier Medical Art licensed under a Creative Commons Attribution 3.0 Unported License (https://smart.servier.com). (B) Representative immunofluorescence staining of CD61 (red = CD61; blue = nuclei; scale bar = 25 µm) and (C) analysis of ploidy levels at the end of the culture (TPO: n = 3 MYH9-RD; n = 3 ANKRD26-RT; TPO +EPAG: n = 3 MYH9-RD; n = 3 ANKRD26-RT; p=NS). (D) Representative flow cytometry analysis of CD41+CD42b+ megakaryocytes at the end of the culture and (E) statistical analysis of mean fluorescence intensity (MFI) of the markers (TPO: n = 12 MYH9-RD; n = 12 ANKRD26-RT; TPO +EPAG: n = 12 MYH9-RD; n = 12 ANKRD26-RT; p=NS). (F) Output was calculated as the fold increase in the percentage of CD41+CD42b+ cells in presence of TPO +EPAG with respect to the percentage of double-positive cells in presence of TPO alone (ANKRD26-RT: n = 12, p<0.05; MYH9-RD: n = 12, p<0.01). All results are presented as mean ± SD. The full data set is provided in Figure 4—source data 1.
Figure 5.
Figure 5.. Eltrombopag sustains increased proplatelet formation ex vivo.
(A) Confocal microscopy analysis of 3D megakaryocyte culture imaged at the end of differentiation. Megakaryocytes were elongating proplatelet shafts, which assembled nascent platelets at their terminal ends, within the hollow space of silk pores (red = CD61, blue = silk) (scale bars = 50 µm). (Av-viii) Analysis of proplatelet structure was performed by immunofluorescence staining of the megakaryocyte-specific cytoskeleton component β1-tubulin (red=β1-tubulin; blue = nuclei; scale bar = 25 µm). In both diseases, the representative pictures show increased elongation and branching of proplatelet shafts in presence of TPO +EPAG with respect to TPO alone. (B) The percentage of proplatelet forming megakaryocytes was calculated as the number of cells displaying long filamentous pseudopods with respect to the total number of round megakaryocytes per analyzed field (TPO: n = 12 MYH9-RD; n = 12 ANKRD26-RT; TPO +EPAG: n = 12 MYH9-RD; n = 12 ANKRD26-RT; **p<0.01; *p<0.05). All results are presented as mean ± SD. The full data set is provided in Figure 5—source data 1.
Figure 6.
Figure 6.. Ex vivo platelet count for predicting response to treatments.
(A) The flow chamber was perfused with culture media and released platelets collected into gas-permeable bags before counting by flow cytometry. (B) Light microscopy and immunofluorescent analysis of the collected medium demonstrated the presence of large pre-platelets, dumbbells, and little discoid platelets having the microtubule coil typically present in resting platelets (red=β1-tubulin, scale bars = 10 µm). (C) Representative flow cytometry analysis of expression of CD41 and CD42b surface markers. (D) Analysis of the correlation between the increase of platelet count analyzed ex vivo and the increase of platelet count observed in vivo from the same patients. For the ex vivo analysis, platelet count was calculated by flow cytometry with counting beads (n = 8 MYH9-RD; n = 9 ANKRD26-RT). (E) Analysis of the correlation between ex vivo megakaryocyte output and the increase of platelet count observed in vivo from the same patients. (n = 8 MYH9-RD; n = 9 ANKRD26-RT). The full data set is provided in Figure 6—source data 1.
Figure 7.
Figure 7.. Assessment of iPSC megakaryocyte differentiation.
(A) iPSC clones were cultured for 18 days and analyzed by flow cytometry to assess megakaryocytes differentiation. Histograms show the mean fluorescence intensity (MFI) of MYH9-RD clones for CD42a, CD42b, CD41, and CD61 markers, relative to healthy controls (n = 3 Healthy Controls, n = 3 MYH9-RD; p=NS). (B) Representative images of proplatelet forming-megakaryocytes at day 19 of culture from different iPSC clones. (C) Percentage of proplatelet formation from the different genotypes (n = 6 Healthy Control; n = 6 MYH9-RD (each clone repeated two times); *p<0.05). (D) The number of bifurcation per single megakaryocyte from the different genotypes (*p<0.01). All results are presented as mean ± SD. The full data set is provided in Figure 7—source data 1. Assessment of iPSC clone pluripotency is shown in Figure 7—figure supplement 1. Morphological and genomic characterization of iPSC clones is shown in Figure 7—figure supplement 2. iPSCs haematopoietic differentiation is shown in Figure 7—figure supplement 3. Embryoid Bodies and trilineage differentiation of iPSC clones is shown in Figure 7—figure supplement 4.
Figure 7—figure supplement 1.
Figure 7—figure supplement 1.. Characterization of iPSCs.
(A) Quantitative RT-PCR analysis of SOX2, NANOG, and OCT4 mRNA expression levels in healthy control and MYH9-RD clones. Expression levels were normalized relative to hESCs RC17. A control iPSC cell line (CTR2#6) was used as internal control. Results are presented as mean ± SEM (n = 2/clone; *p<0.05; **p<0.01). (B) Representative immunofluorescence staining of pluripotency markers OCT4, SOX2, NANOG, SSEA-4, and Tra-1–81.
Figure 7—figure supplement 2.
Figure 7—figure supplement 2.. Morphological and genomic characterization of iPSC clones.
(A) Representative phase-contrast images of healthy controls and mutated clones. Magnification ×10. (B) Representative karyotype analysis showed a normal karyotype (healthy controls: upper panel, 46,XX; MYH9-RD bottom panel, 46,XY).
Figure 7—figure supplement 3.
Figure 7—figure supplement 3.. iPSCs hematopoietic differentiation.
Representative phase-contrast microscope images of iPSC colonies at day 0, hematopoietic progenitor.
Figure 7—figure supplement 4.
Figure 7—figure supplement 4.. Embryoid Bodies and trilineage differentiation of iPSC clones.
Phase: day 4 embryoid body culture (10 x). After 14 days, differentiated cultures exhibited the presence of cells immune-positive for endodermal (a–FP), mesodermal (a-SMA), and ectodermal (bIII-Tubulin), germ-layer markers. Magnification: ×10.
Figure 8.
Figure 8.. Validation of the system with iPSC mutated clones.
(A) Megakaryocytes were differentiated from iPSCs of patients affected by MYH9-RD and cultured for 14 days in a petri dish before passing into the bone marrow device in presence of 10 ng/mL TPO supplemented or not with 500 ng/mL EPAG. (B) Representative immunofluorescence staining of CD61 megakaryocytes (i,ii) and confocal microscopy analysis (iii-vi) of 3D megakaryocyte culture imaged at the end of differentiation. Megakaryocytes are elongating proplatelet shafts, which assemble nascent platelets at their terminal ends, within the hollow space of silk pores (red = CD61, blue = silk, scale bars = 50 µm). (C) Representative flow cytometry analysis of CD41+CD42b+ megakaryocytes at the end of the culture and (D) statistical analysis of mean fluorescence intensity (MFI) of the markers (n = 3 TPO, n = 3 TPO +EPAG; p=NS). (E) Output was calculated as the number of CD41+CD42b+ cells in presence of TPO +EPAG with respect to the percentage of double-positive cells in presence of TPO alone (n = 3 TPO, n = 3 TPO +EPAG; *p<0.05). (F) Platelet number was calculated by counting beads after perfusing the chamber. The fold increase was calculated as the number of ex vivo platelet count in the presence of TPO +EPAG with respect to TPO alone (n = 3 TPO, n = 3 TPO +EPAG; *p<0.05). All results are presented as mean ± SD. The full data set is provided in Figure 8—source data 1.
Figure 9.
Figure 9.. Summary of the proposed workflow.
After sampling, hematopoietic stem and progenitors cell from patients can be differentiated into primary megakaryocytes (MKs) or transformed into induced Pluripotent Stem Cells (iPSCs). iPSC are subjected to quality check, expansion and banking. Megakaryocytic progenitors differentiated either from primary stem cells or iPSCs are seeded within a 3D bone marrow tissue device, cultured in the presence of the tested drug, and analyzed. After perfusion, platelets are collected and counted in order to assess patient-specific response. The figure of the microscope and tubes was adapted from Servier Medical Art licensed under a Creative Commons Attribution 3.0 Unported License (https://smart.servier.com).

Similar articles

Cited by

References

    1. Abbonante V, Di Buduo CA, Gruppi C, Malara A, Gianelli U, Celesti G, Anselmo A, Laghi L, Vercellino M, Visai L, Iurlo A, Moratti R, Barosi G, Rosti V, Balduini A. Thrombopoietin/TGF-β1 loop regulates megakaryocyte extracellular matrix component synthesis. Stem Cells. 2016;34:1123–1133. doi: 10.1002/stem.2285. - DOI - PubMed
    1. Abbonante V, Di Buduo CA, Gruppi C, De Maria C, Spedden E, De Acutis A, Staii C, Raspanti M, Vozzi G, Kaplan DL, Moccia F, Ravid K, Balduini A. A new path to platelet production through matrix sensing. Haematologica. 2017;102:1150–1160. doi: 10.3324/haematol.2016.161562. - DOI - PMC - PubMed
    1. Balduini CL, Pecci A, Noris P. Diagnosis and management of inherited thrombocytopenias. Seminars in Thrombosis and Hemostasis. 2013;39:161–171. doi: 10.1055/s-0032-1333540. - DOI - PubMed
    1. Balduini A, Di Buduo CA, Kaplan DL. Translational approaches to functional platelet production ex vivo. Thrombosis and Haemostasis. 2016;115:250–256. doi: 10.1160/TH15-07-0570. - DOI - PubMed
    1. Balduini CL, Melazzini F, Pecci A. Inherited thrombocytopenias-recent advances in clinical and molecular aspects. Platelets. 2017;28:3–13. doi: 10.3109/09537104.2016.1171835. - DOI - PubMed

Publication types

MeSH terms