

Alcohol consumption in the general population is associated with structural changes in multiple organ systems
- PMID: 34059199
- PMCID: PMC8192119
- DOI: 10.7554/eLife.65325
Alcohol consumption in the general population is associated with structural changes in multiple organ systems
Abstract
Background: Excessive alcohol consumption is associated with damage to various organs, but its multi-organ effects have not been characterised across the usual range of alcohol drinking in a large general population sample.
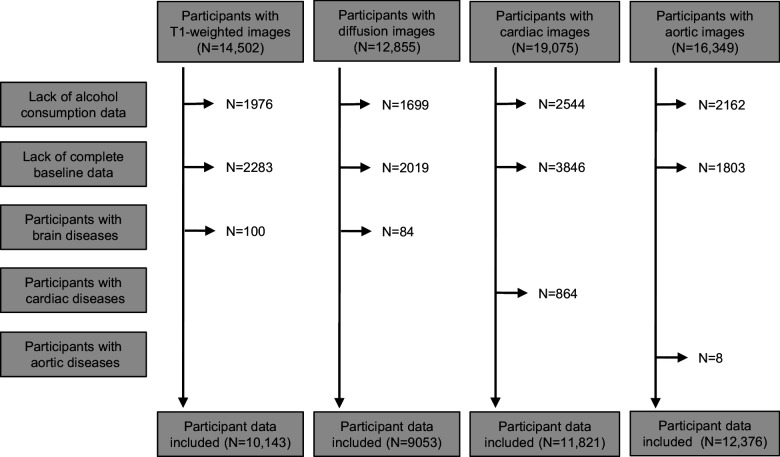
Methods: We assessed global effect sizes of alcohol consumption on quantitative magnetic resonance imaging phenotypic measures of the brain, heart, aorta, and liver of UK Biobank participants who reported drinking alcohol.
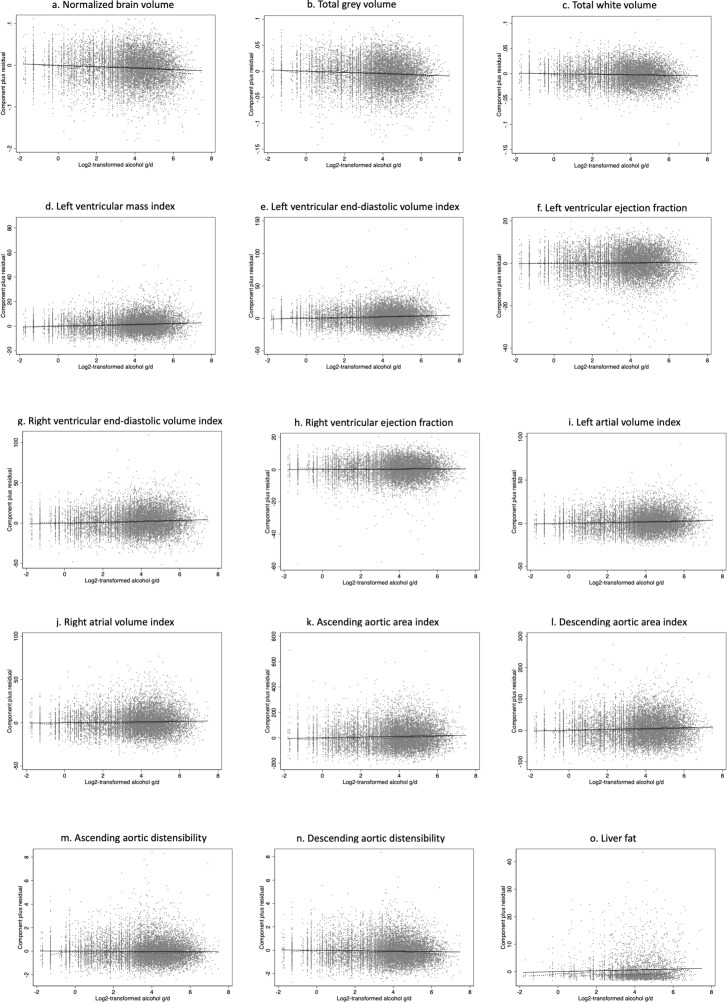
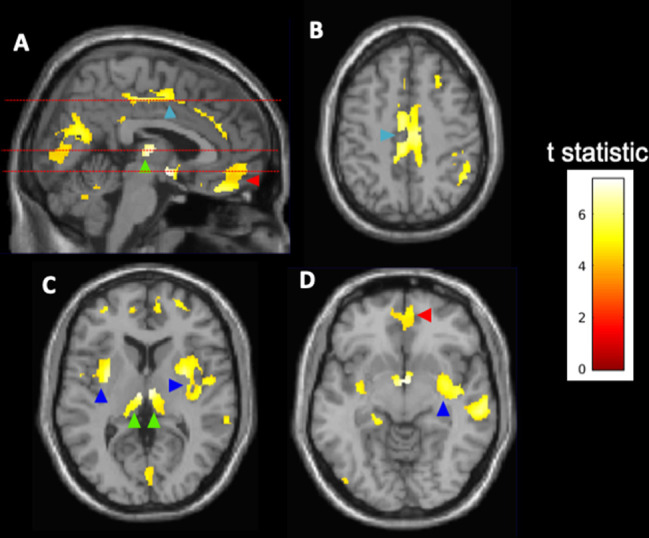
Results: We found a monotonic association of higher alcohol consumption with lower normalised brain volume across the range of alcohol intakes (-1.7 × 10⁻³ ± 0.76 × 10⁻³ per doubling of alcohol consumption, p=3.0 × 10⁻¹⁴). Alcohol consumption was also associated directly with measures of left ventricular mass index and left ventricular and atrial volume indices. Liver fat increased by a mean of 0.15% per doubling of alcohol consumption.
Conclusions: Our results imply that there is not a 'safe threshold' below which there are no toxic effects of alcohol. Current public health guidelines concerning alcohol consumption may need to be revisited.
Funding: See acknowledgements.
Keywords: alcohol consumption; aorta; brain; epidemiology; global health; heart; imaging; liver; none.
© 2021, Evangelou et al.
Conflict of interest statement
EE E.E. acknowledges consultancy fees from OpenDNA, HS, WB, RP, HG, PE No competing interests declared, PM PM acknowledges consultancy fees from Roche, Adelphi Communications, Celgene and Biogen. He has received honoraria or speakers' honoraria from Novartis, Biogen, Medscape, Adelphi Communications and Roche and has received research or educational funds from Biogen, Novartis, GlaxoSmithKline and Nodthera.
Figures
Similar articles
-
[Hypothetical Alcohol Consumption Interventions and Hepatic Steatosis: A Longitudinal Study in a Large Cohort].Sichuan Da Xue Xue Bao Yi Xue Ban. 2024 May 20;55(3):653-661. doi: 10.12182/20240560503. Sichuan Da Xue Xue Bao Yi Xue Ban. 2024. PMID: 38948274 Free PMC article. Chinese.
-
Sex-specific associations between alcohol consumption, cardiac morphology, and function as assessed by magnetic resonance imaging: insights form the UK Biobank Population Study.Eur Heart J Cardiovasc Imaging. 2021 Aug 14;22(9):1009-1016. doi: 10.1093/ehjci/jeaa242. Eur Heart J Cardiovasc Imaging. 2021. PMID: 33313691 Free PMC article.
-
Myocardial tissue and metabolism characterization in men with alcohol consumption by cardiovascular magnetic resonance and 11C-acetate PET/CT.J Cardiovasc Magn Reson. 2020 Apr 16;22(1):23. doi: 10.1186/s12968-020-00614-2. J Cardiovasc Magn Reson. 2020. PMID: 32299425 Free PMC article.
-
The relationship of average volume of alcohol consumption and patterns of drinking to burden of disease: an overview.Addiction. 2003 Sep;98(9):1209-28. doi: 10.1046/j.1360-0443.2003.00467.x. Addiction. 2003. PMID: 12930209 Review.
-
Alcoholic cardiomyopathy.J Cardiovasc Med (Hagerstown). 2010 Dec;11(12):884-92. doi: 10.2459/JCM.0b013e32833833a3. J Cardiovasc Med (Hagerstown). 2010. PMID: 20308914 Review.
Cited by
-
Longitudinal alcohol-related brain changes in older adults: The Sydney Memory and Ageing Study.Addict Biol. 2024 May;29(5):e13402. doi: 10.1111/adb.13402. Addict Biol. 2024. PMID: 38797559 Free PMC article.
-
Association between waist circumference and fatty liver disease in older adult population: a cross-sectional study in Urumqi.Front Public Health. 2025 Jul 8;13:1620261. doi: 10.3389/fpubh.2025.1620261. eCollection 2025. Front Public Health. 2025. PMID: 40697841 Free PMC article.
-
Identification of high likelihood of dementia in population-based surveys using unsupervised clustering: a longitudinal analysis.Alzheimers Res Ther. 2023 Nov 29;15(1):209. doi: 10.1186/s13195-023-01357-9. Alzheimers Res Ther. 2023. PMID: 38031083 Free PMC article.
-
Alcoholic liver disease: a new insight into the pathogenesis of liver disease.Arch Pharm Res. 2022 Jul;45(7):447-459. doi: 10.1007/s12272-022-01392-4. Epub 2022 Jun 27. Arch Pharm Res. 2022. PMID: 35761115 Review.
-
Chemical Constituents from the Fruits of Amomum kravanh and Their Role in Activating Alcohol Dehydrogenase.Molecules. 2023 Jun 20;28(12):4878. doi: 10.3390/molecules28124878. Molecules. 2023. PMID: 37375433 Free PMC article.
References
-
- Bai W, Sinclair M, Tarroni G, Oktay O, Rajchl M, Vaillant G, Lee AM, Aung N, Lukaschuk E, Sanghvi MM, Zemrak F, Fung K, Paiva JM, Carapella V, Kim YJ, Suzuki H, Kainz B, Matthews PM, Petersen SE, Piechnik SK, Neubauer S, Glocker B, Rueckert D. Automated cardiovascular magnetic resonance image analysis with fully convolutional networks. Journal of Cardiovascular Magnetic Resonance. 2018;20:65. doi: 10.1186/s12968-018-0471-x. - DOI - PMC - PubMed
-
- Bell S, Daskalopoulou M, Rapsomaniki E, George J, Britton A, Bobak M, Casas JP, Dale CE, Denaxas S, Shah AD, Hemingway H. Association between clinically recorded alcohol consumption and initial presentation of 12 cardiovascular diseases: population based cohort study using linked health records. BMJ. 2017;356:j909. doi: 10.1136/bmj.j909. - DOI - PMC - PubMed
Publication types
MeSH terms
Grants and funding
- MR/N026934/1/MRC_/Medical Research Council/United Kingdom
- MR/R0265051/1/MRC_/Medical Research Council/United Kingdom
- MC_QA137853/MRC_/Medical Research Council/United Kingdom
- MR/M024903/1/MRC_/Medical Research Council/United Kingdom
- G0601966/MRC_/Medical Research Council/United Kingdom
- MC_PC_17114/MRC_/Medical Research Council/United Kingdom
- G0100811/MRC_/Medical Research Council/United Kingdom
- WT_/Wellcome Trust/United Kingdom
- MC_PC_17228/MRC_/Medical Research Council/United Kingdom
- RE/18/4/34215/BHF_/British Heart Foundation/United Kingdom
- MR/R026505/2/MRC_/Medical Research Council/United Kingdom
- DH_/Department of Health/United Kingdom
- G0300665/MRC_/Medical Research Council/United Kingdom
- G9901399/MRC_/Medical Research Council/United Kingdom
- MR/L01341X/1/MRC_/Medical Research Council/United Kingdom
- G9409531/MRC_/Medical Research Council/United Kingdom
- G0900897/MRC_/Medical Research Council/United Kingdom
- G9409634/MRC_/Medical Research Council/United Kingdom
- MR/R0265051/2/MRC_/Medical Research Council/United Kingdom
- MR/K501013/1/MRC_/Medical Research Council/United Kingdom
- MR/S019669/1/MRC_/Medical Research Council/United Kingdom
LinkOut - more resources
Full Text Sources
Medical
