. 2021 May 31;7(1):128.
doi: 10.1038/s41420-021-00513-0.

P300/HDAC1 regulates the acetylation/deacetylation and autophagic activities of LC3/Atg8-PE ubiquitin-like system

Affiliations

P300/HDAC1 regulates the acetylation/deacetylation and autophagic activities of LC3/Atg8-PE ubiquitin-like system

Wenmei Wu et al. Cell Death Discov. .

Abstract

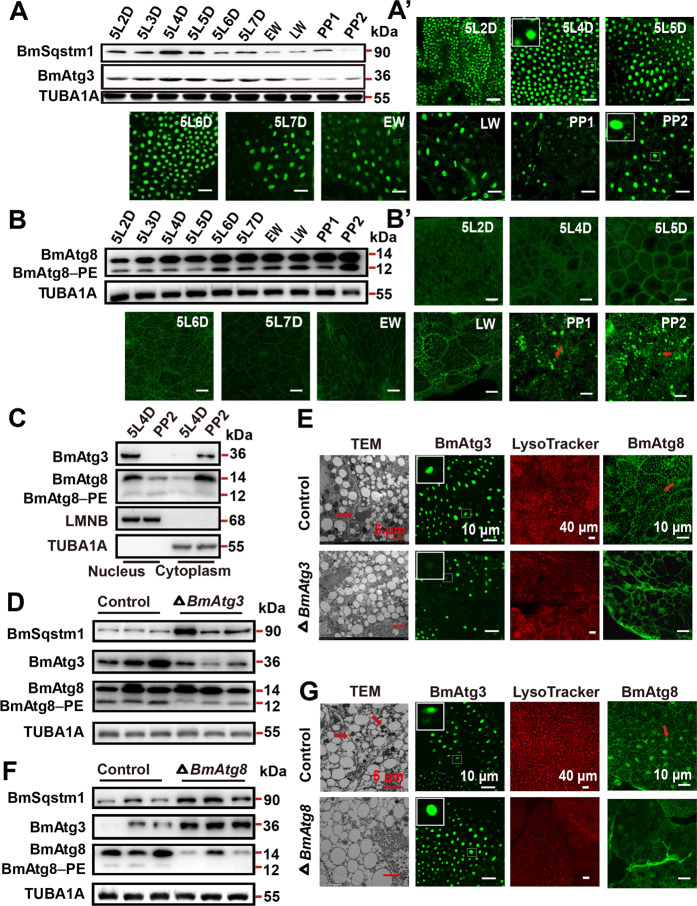
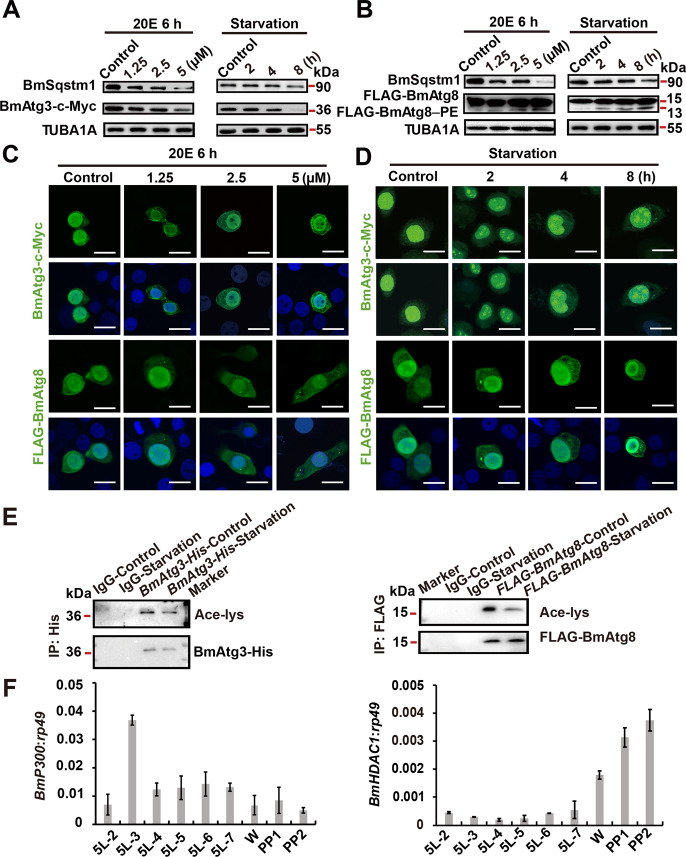
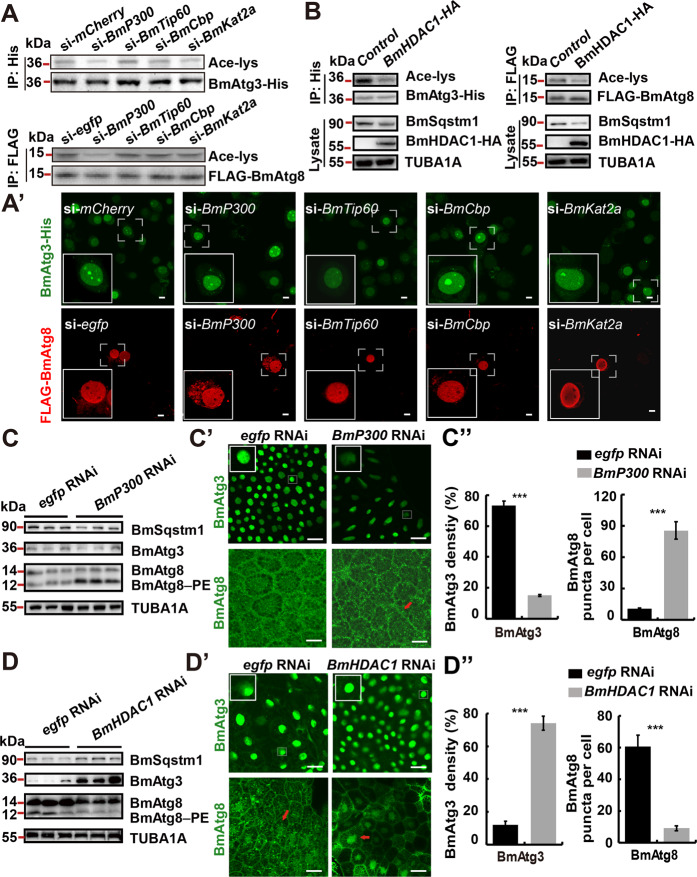
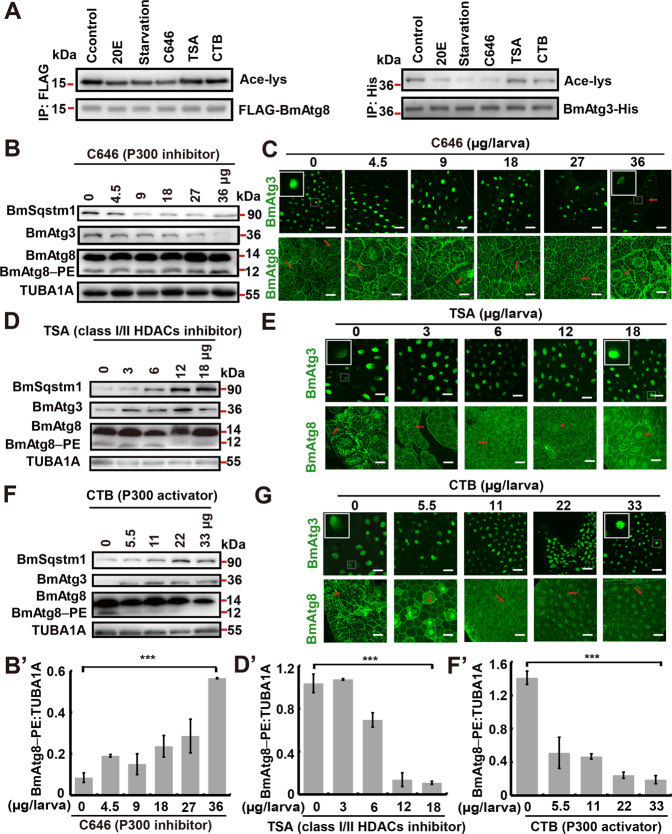
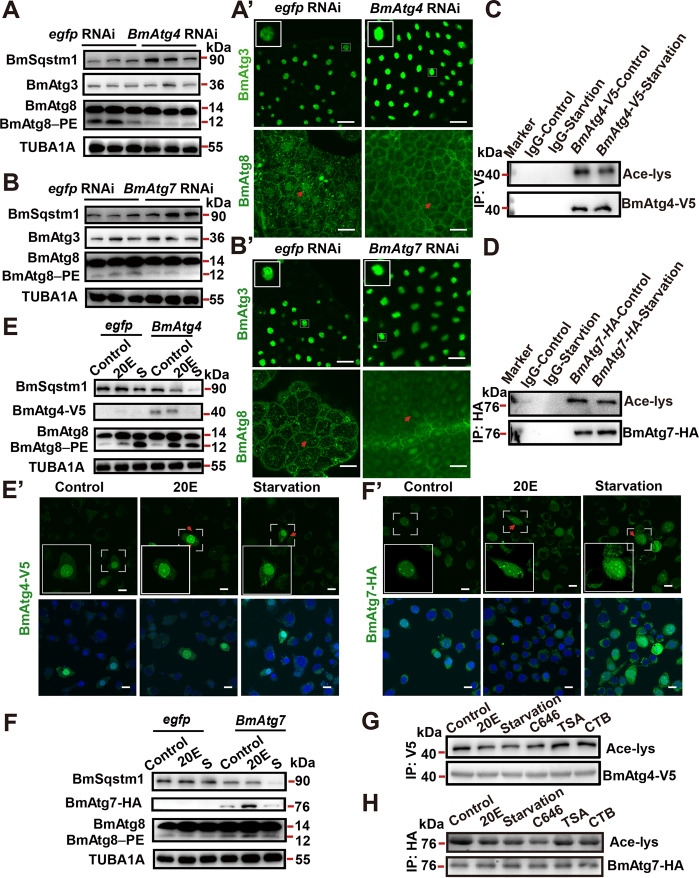
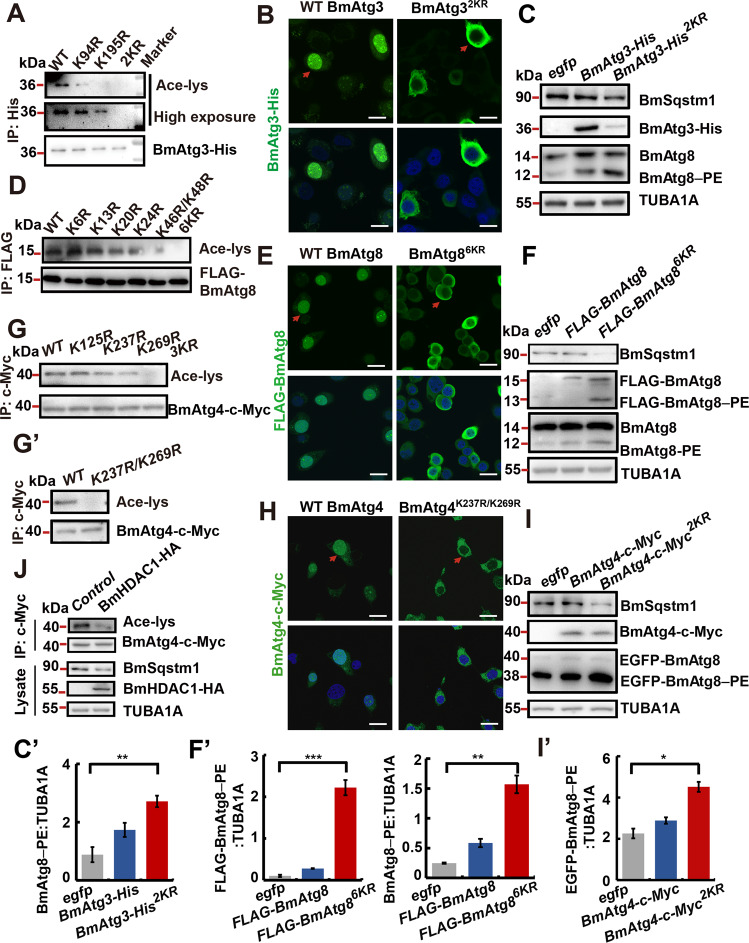
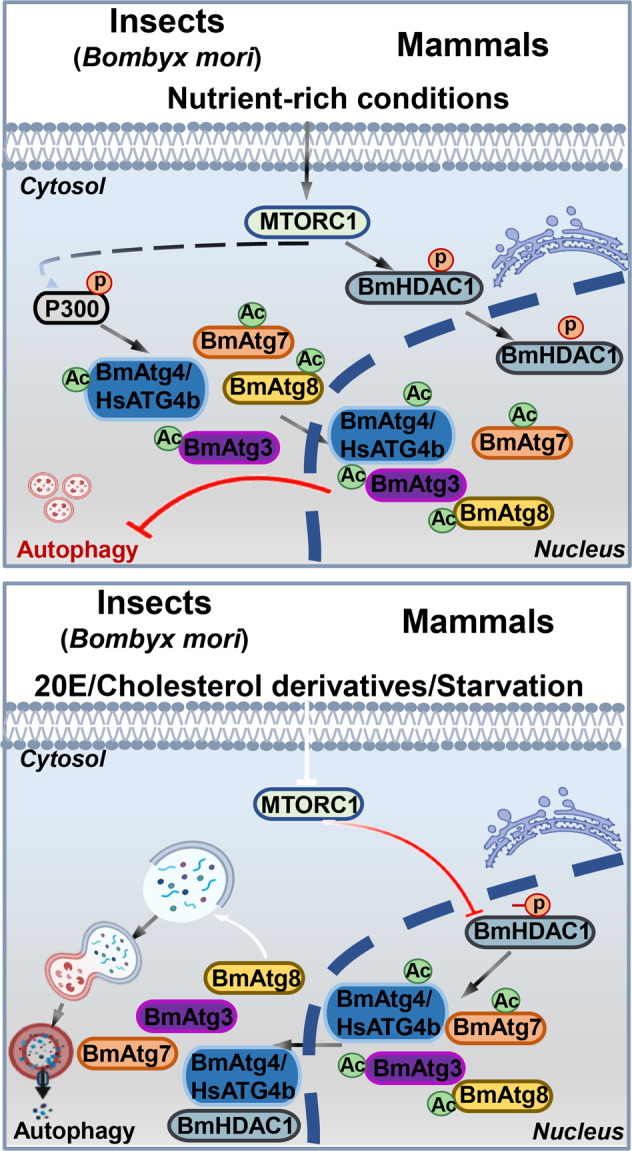
Protein acetylation plays potential roles in regulating autophagy occurrence. However, it varies greatly between yeast and mammals, and has not been thoroughly investigated in other organisms. Here, we reported that the components of BmAtg8-PE ubiquitin-like system (BmAtg3, BmAtg4, BmAtg7, and BmAtg8) in Bombyx mori were localized in the nucleus under nutrient-rich conditions, whereas they were exported to the cytoplasm upon autophagy induction. RNAi of BmP300 and inhibition of BmP300 activity resulted in nucleo-cytoplasmic translocation of BmAtg3 and BmAtg8, as well as premature induction of autophagy in the absence of stimulus. Conversely, RNAi of BmHDAC1 and inhibition of class I/II HADCs activities led to the nuclear accumulation of BmAtg3 and BmAtg8. In addition, acetylation sites in Atg proteins of BmAtg8-PE ubiquitin-like system were identified by mass spectrometry, and acetylation-site mutations caused nucleo-cytoplasmic translocation of BmAtg3, BmAtg4, and BmAtg8 along with autophagy promotion. Similarly, the subcellular localization of human ATG4b is determined by acetylation modification. In general, BmP300-mediated acetylation sequesters the components of BmAtg8-PE ubiquitin-like system in the nucleus, thus leading to the autophagy inhibition. Oppositely, BmHDAC1-mediated deacetylation leads to the nucleo-cytoplasmic translocation of the components of BmAtg8-PE ubiquitin-like system and promotes autophagy. This process is evolutionarily conserved between insects and mammals.


Conflict of interest statement

The authors declare no competing interests.

Figures

Fig. 1
Fig. 1. BmAtg8 and BmAtg3 are essential for autophagy induction in B. mori fat body.
A–A′ Protein levels of BmSqstm1 and BmAtg3 (A), immunofluorescent staining of BmAtg3 (A′) in B. mori fat body from 5L2D to PP2 stage. EW early wandering stage, LW later wandering stage. Scale bar: 10 µm. B–B′ Protein levels (B) and immunofluorescent staining (B′) of BmAtg8 in B. mori fat body from 5L2D to PP2 stage. Arrows: typical fat body cell. Scale bar: 10 µm. C Protein levels of BmAtg3 and BmAtg8 in the nucleus and cytoplasm at 5L4D and PP2 stages. D Protein levels of BmSqstm1, BmAtg3, and BmAtg8 after BmAtg3 knockout. E LysoTracker Red staining, TEM analysis, and immunofluorescent staining of BmAtg3 and BmAtg8 after BmAtg3 knockout. F Protein levels of BmSqstm1, BmAtg3, and BmAtg8 after BmAtg8 knockout. G LysoTracker Red staining, TEM analysis, and immunofluorescent staining of BmAtg3 and BmAtg8 after BmAtg8 knockout.
Fig. 2
Fig. 2. Nuclear export of BmAtg3 and BmAtg8 is associated with autophagy induction.
A Protein levels of BmSqstm1 and BmAtg3-c-Myc in BmAtg3-c-Myc-overexpressing BmN cells treated with 1, 2.5, and 5 μM 20E for 6 h or 2, 4, and 8 h starvation. B Protein levels of BmSqstm1 and FLAG-BmAtg8 in FLAG-BmAtg8-overexpressing BmN cells treated with 1, 2.5, and 5 μM 20E for 6 h or 2, 4, and 8 h starvation. C Immunofluorescent staining of BmAtg3-c-Myc and FLAG-BmAtg8 after 1, 2.5, and 5 μM 20E treatments for 6 h in BmN cells. Scale bar: 10 µm. D Immunofluorescent staining of BmAtg3-c-Myc and FLAG-BmAtg8 after 2, 4, or 8 h starvation in BmN cells. Scale bar: 10 µm. E Acetylation levels of BmAtg3 and BmAtg8 after starvation for 4 h. F Transcriptional levels of acetyltransferases BmP300 and deacetylase BmHDAC1 in B. mori fat body from 5L2D to PP2 stage.
Fig. 3
Fig. 3. BmP300 and BmHDAC1 oppositely regulate acetylation and nuclear localization of BmAtg3 and BmAtg8.
A–A′ Acetylation levels of BmAtg3-His and FLAG-BmAtg8 (A) and immunofluorescent staining of BmAtg3 and BmAtg8 (A′) after BmP300, BmTip60, BmCBP, or BmKat2a siRNA treatment for 24 h in BmN cells. Scale bar: 10 µm. B Protein levels of acetylated BmAtg3-His and FLAG-BmAtg8, and BmSqstm1 after co-overexpression of BmHDAC1 and BmAtg3-His/FLAG-BmAtg8. C–C″ Protein levels of BmAtg3, BmAtg8, and BmSqstm1 (C), immunofluorescent staining of BmAtg3 and BmAtg8 after BmP300 RNAi treatment for 24 h in the fat body (C′). Quantification of fluorescent BmAtg3 and BmAtg8 puncta in C′ (C″). Arrows: BmAtg8 puncta. Scale bar: 10 µm. D–D″ Protein levels of BmAtg3, BmAtg8, and BmSqstm1 (D) immunofluorescent staining of BmAtg3 and BmAtg8 after BmHDAC1 RNAi for 24 h in the fat body (D′). Quantification of fluorescent BmAtg3 and BmAtg8 puncta in D′ (D″). Scale bar: 10 µm.
Fig. 4
Fig. 4. P300 and class I/II HDAC activities oppositely regulate BmAtg3 and BmAtg8 nuclear localization and autophagy.
A Acetylation levels of BmAtg3-His and FLAG-BmAtg8 after 5 μM 20E, starvation, 800 nM C646, 20 µM TSA, or 20 µM CTB treatment for 6 h in BmN cells. IP immunoprecipitation. B–B′ Protein levels of BmSqstm1, BmAtg3, and BmAtg8 in the fat body after 4.5, 9, 18, 27, or 36 μg/larva C646 treatment for 24 h, 0 μg/larva treatment is used as control (B). Quantification of BmAtg8–PE in B (B′). Significance test was performed between the control and the highest dose. C Immunofluorescent staining of BmAtg3 and BmAtg8 in the fat body after 4.5, 9, 18, 27, or 36 μg/larva C646 treatment for 24 h. Arrows: typical treated cells. Scale bar: 10 µm. D–D′ Protein levels of BmSqstm1, BmAtg3, and BmAtg8 in the fat body after 3, 6, 12, or 18 μg/larva TSA treatment for 24 h (D). Quantification of BmAtg8–PE in D (D′). Significance test was performed between the control and the highest dose. E Immunofluorescent staining of BmAtg3 and BmAtg8 in the fat body after 3, 6, 12, or 18 μg/larva TSA treatment for 24 h. Scale bar: 10 µm. F–F′ Protein levels of BmAtg3, BmAtg8, and BmSqstm1 in the fat body after 5.5, 11, 22, or 33 μg/larva CTB treatment for 24 h (F). Quantification of BmAtg8–PE in F (F′). Significance test was performed between the control and the highest dose. G Immunofluorescent staining of BmAtg3 and BmAtg8 in the fat body after 5.5, 11, 22, or 33 μg/larva CTB treatment for 24 h. Scale bar: 10 µm.
Fig. 5
Fig. 5. Autophagic activities of BmAtg4 and BmAtg7 are accompanied by a variation of acetylation.
A–A′ Protein levels of BmSqstm1, BmAtg3, and BmAtg8 (A) and immunofluorescent staining of BmAtg3 and BmAtg8 (A’) in the fat body after BmAtg4 RNAi for 24 h. Scale bar: 10 µm. B–B′ Protein levels of BmSqstm1, BmAtg3, and BmAtg8 (B) and immunofluorescent staining of BmAtg3 and BmAtg8 (B′) in the fat body after BmAtg7 RNAi for 24 h. Scale bar: 10 µm. C Acetylation levels of BmAtg4-V5 after starvation for 4 h. D Acetylation levels of BmAtg7-HA after starvation for 4 h. E–E′ Protein levels of BmAtg8, BmSqstm1, and BmAtg4-V5 (E), and immunofluorescent staining of BmAtg4-V5 (E′) after 20E or starvation treatment for 4 h, S starvation. Scale bar: 10 µm. F–F′ Protein levels of BmSqstm1, BmAtg7-HA, and BmAtg8 (F), and immunofluorescent staining of BmAtg7-HA (F′) after 20E or starvation treatment for 4 h. Scale bar: 10 µm. G Acetylation levels of BmAtg4-V5 after 5 μM 20E, starvation, 800 nM C646, 20 µM TSA, or 20 µM CTB treatment for 6 h in BmN cells. H Acetylation levels of BmAtg7-HA after 5 μM 20E, starvation, 800 nM C646, 20 µM TSA, or 20 µM CTB treatment for 6 h in BmN cells.
Fig. 6
Fig. 6. Authenticity and autophagic activities of identified acetylation sites in BmAtg3, BmAtg4, and BmAtg8.
A Acetylation level of BmAtg3 after single and double mutation of acetylation sites. 2KR: double acetylation-site mutated from lysine (K) to arginine (R). B Immunofluorescent staining of BmAtg3 double acetylation-site mutant. Scale bar: 10 µm. C–C′ Protein levels of BmSqstm1, BmAtg8, and BmAtg3 after overexpression of double acetylation-site mutated BmAtg3 under nutrient-rich conditions (C). Quantification of BmAtg8–PE in C (C′). Significance test was performed between egfp and mutant overexpression. D Acetylation level of BmAtg8 after single and sextuple mutation of acetylation sites. E Immunofluorescent staining of BmAtg8 after sextuple mutation of acetylation sites. 6KR: sextuple acetylation site mutation from lysine to arginine. Scale bar: 10 µm. F–F′ Protein levels of BmSqstm1, FLAG-BmAtg8, and endogenous BmAtg8 after overexpression of sextuple acetylation-site mutated BmAtg8 under nutrient-rich conditions (F). Quantification of BmAtg8–PE and EGFP- BmAtg8–PE in F (F′). G–G′ Acetylation of BmAtg4 after single and triple (G), or double (G′) mutation of acetylation sites. H Immunofluorescent staining of BmAtg4 after double mutation of acetylation sites. Scale bar: 10 µm. I–I′ Protein levels of BmSqstm1 and EGFP-BmAtg8 after overexpression of double acetylation-site mutated BmAtg4 under nutrient-rich conditions (I). Quantification of EGFP-BmAtg8–PE in I (I′). J Acetylation of c-Myc-BmAtg4, and protein levels of BmSqstm1 and BmHDAC1 after BmHDAC1 overexpression.
Fig. 7
Fig. 7. A model for the regulation of autophagy mediated by acetyltransferase/deacetylase in B. mori and mammals.
Components of the LC3/Atg8–PE ubiquitin-like system are acetylated by acetyltransferase, such as BmP300, and then translocated from the cytoplasm to the nucleus under nutrient-rich conditions. Simultaneously, high MTOR activity phosphorylates the histone deacetylases BmHDAC1/HsHDAC1, resulting in their nuclear localization. 20E, cholesterol derivatives, and starvation, which inhibit MTOR signaling, leads to the dephosphorylation of BmHDAC1/HsHDAC1, and facilitates the deacetylation of Atg proteins from LC3/Atg8–PE ubiquitin-like system, subsequently promoting their nucleo-cytoplasmic translocation and autophagy occurrence in both B. mori and mammals.

Similar articles

Cited by

References

    1. Klionsky DJ, et al. Guidelines for the use and interpretation of assays for monitoring autophagy (3rd edition) Autophagy. 2020;12:1–222. doi: 10.1080/15548627.2015.1100356. - DOI - PMC - PubMed
    1. Schaaf MB, Keulers TG, Vooijs MA, Rouschop KM. LC3/GABARAP family proteins: autophagy-(un)related functions. FASEB J. 2016;30:3961–3978. doi: 10.1096/fj.201600698R. - DOI - PubMed
    1. Tanida I, Ueno T, Kominami E. Human light chain 3/MAP1LC3B is cleaved at its carboxyl-terminal Met121 to expose Gly120 for lipidation and targeting to autophagosomal membranes. J. Biol. Chem. 2004;279:47704–47710. doi: 10.1074/jbc.M407016200. - DOI - PubMed
    1. Ichimura Y, et al. A ubiquitin-like system mediates protein lipidation. Nature. 2000;408:488–492. doi: 10.1038/35044114. - DOI - PubMed
    1. Kaiser SE, et al. Noncanonical E2 recruitment by the autophagy E1 revealed by Atg7-Atg3 and Atg7-Atg10 structures. Nat. Struct. Mol. Biol. 2012;19:1242–1249. doi: 10.1038/nsmb.2415. - DOI - PMC - PubMed