. 2021 Jun 1;8(1):127.
doi: 10.1038/s41438-021-00567-2.

Mutation of SlARC6 leads to tissue-specific defects in chloroplast development in tomato

Affiliations

Mutation of SlARC6 leads to tissue-specific defects in chloroplast development in tomato

Jiang Chang et al. Hortic Res. .

Abstract

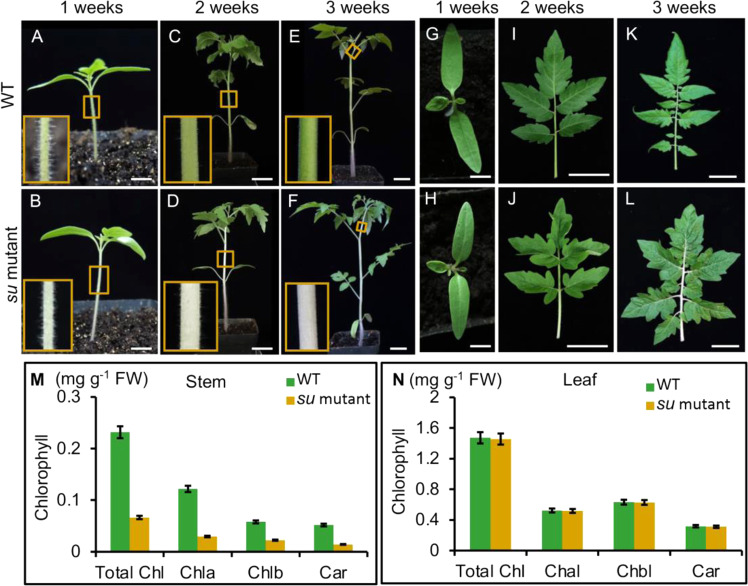
The proliferation and development of chloroplasts are important for maintaining the normal chloroplast population in plant tissues. Most studies have focused on chloroplast maintenance in leaves. In this study, we identified a spontaneous mutation in a tomato mutant named suffulta (su), in which the stems appeared albinic while the leaves remained normal. Map-based cloning showed that Su encodes a DnaJ heat shock protein that is a homolog of the Arabidopsis gene AtARC6, which is involved in chloroplast division. Knockdown and knockout of SlARC6 in wild-type tomato inhibit chloroplast division, indicating the conserved function of SlARC6. In su mutants, most mesophyll cells contain only one or two giant chloroplasts, while no chloroplasts are visible in 60% of stem cells, resulting in the albinic phenotype. Compared with mature tissues, the meristem of su mutants suggested that chloroplasts could partially divide in meristematic cells, suggesting the existence of an alternative mechanism in those dividing cells. Interestingly, the adaxial petiole cells of su mutants contain more chloroplasts than the abaxial cells. In addition, prolonged lighting can partially rescue the albinic phenotypes in su mutants, implying that light may promote SlACR6-independent chloroplast development. Our results verify the role of SlACR6 in chloroplast division in tomato and uncover the tissue-specific regulation of chloroplast development.


Conflict of interest statement

The authors declare no competing interests.

Figures

Fig. 1
Fig. 1. The phenotype of su mutants at the seedling stage.
A, B The hypocotyl of WT and su mutants; bars: 0.5 cm. CF The stems of WT and su mutants (2- and 3-week stages); bars: 3 cm. G, H The cotyledons and young leaves of WT and su mutants; bars: 0.5 cm. IL The leaves of WT and su mutants (2- and 3-week stages). The lower right insets in AF are magnified views of the corresponding boxed regions. Bars: 3 cm. M, N Comparison of chlorophyll contents in the stems and leaves of the WT and su mutant at the 3-week stage
Fig. 2
Fig. 2. Map-based cloning of Su.
A Mapping of Su by BSA-seq analysis. Significantly associated single-nucleotide polymorphisms (SNPs) were found between 63 and 66 Mb of chromosome 4. B Rough mapping of Su. The black line represents chromosome 4; characters above the line show markers used in the rough mapping; characters behind the line show the number of recombinations. The interval between markers M17 and M31 is 2.14 Mb. A total of 456 individuals with albinic stems were used in the rough mapping. C Fine mapping of Su. The interval between markers M28 and M220 is 531.8 Kb. A total of 515 individuals with white stems were used in the fine mapping. D Candidate genes in the target region. Boxes with arrows represent open reading frames (ORFs) in the target region according to the tomato genome (SL2.4). ORFs above the line are located in the positive strand of the chromosome, and ORFs below the line are in the antisense strand. The red box with arrow shows the target gene. E Gene structure of ORF8. The black line shows the coding sequence of ORF8, which encodes 819 amino acids. The hatched boxes represent domains of ORF8. The red lightning bolt shows the mutation site of ORF8 in LA0628
Fig. 3
Fig. 3. Functional verification of ORF8 by virus-induced gene silencing (VIGS).
AI The phenotype of VIGS-ORF8 plants. AC Plants injected with Agrobacterium containing empty TRV2 were used as the negative control. DF VIGS-PDS plants were used as the positive control. GI The VIGS-ORF8 plants. J Protoplasts from the mesophyll of the negative plants (the left channel) and VIGS-ORF8 plants (the right channel). K Protoplasts from the stem of the negative plants (the left channel) and VIGS-ORF8 plants (the right channel). The panels filled with crosses show that there are no undivided chloroplasts in the negative plants. Both undivided and divided chloroplasts could be found in the stems of VIGS-ORF8 plants
Fig. 4
Fig. 4. Functional verification of ORF8 by CRISPR.
A Slorf8 edited alleles found in the transgenic plants. Blue boxes represent exons, black boxes represent introns, and pink boxes represent UTR regions. The sgRNA and PAM sequence are shown. Two homozygous edited lines were used in this study, one showing a G insertion and one a G deletion. B Wild-type (WT) plants were used as the negative control. C The phenotype of the Slorf8 ko-2 line. Bars: 1 cm
Fig. 5
Fig. 5. Visualization of the chloroplast and thylakoid.
The chloroplast phenotype in the leaves of WT (AC) and su mutants (DF) under DIC. Cross-sections of the leaves of WT (A) and su mutants (D); cross-sections of the palisade tissues of WT (B) and su mutants (E); mesophyll protoplasts from WT (C) and su mutants (F). Bars: 10 μm. The chloroplast phenotype in the stem of WT (GI) and su mutants (JL) under DIC. Cross-sections of the stem of WT (G, H) and su mutants (J, K). Stem protoplasts from WT (I) and su mutants (L). The red arrows mark cells containing chloroplasts. Bars: 10 μm. The ultrastructure of chloroplasts from the leaves of WT (MO) and su mutants (PR). The ultrastructure of chloroplasts from the stems of WT (SU) and su mutants (VX). Black and red arrowheads mark granum and stromal thylakoids, respectively. Bars:10 μm (M, P, S, V); bars: 500 nm (N, O, Q, R, T, U, W, X)
Fig. 6
Fig. 6. TEM observation of the chloroplasts in the meristem.
TEM micrographs showing longitudinal sections of the shoot apical meristem in WT (A, B) and su mutants (C, D). B, D The upper right insets show the chloroplast in the shoot apical meristem (bar: 1 μm). n nucleus. The red triangles point to the proplastids and chloroplasts. Bar: 10 μm. E, F TEM micrographs showing the transverse section of the region beneath the meristem. The red stars mark the chloroplast. Bar: 10 μm. G Schematic showing the position of TEM observations in the meristem. The yellow square shows the position of images in AD. The green square shows the position of images in E, F
Fig. 7
Fig. 7. Light can increase the chloroplast number in su mutants.
The adaxial (A) and abaxial (B) surfaces of the petioles of WT. Bar: 0.5 cm. C The cross-section of WT petiole. The magnified views represent the adaxial and abaxial surfaces of the WT petiole. Bar (C): 1 mm. The adaxial (D) and abaxial (E) surfaces of the su mutant petiole. Bar: 0.5 cm. F The cross-section of the petiole in su mutants. The magnified views represent the adaxial and abaxial surfaces of the petiole in su mutants. Bar (C): 1 mm. Stems of WT and su mutants grown under conditions of 10 h day/14 h night (GJ) or 16 h day/8 h night (KN). IJ, MN Sections of the stem in WT and su mutants. Leaves of WT and su mutants grown under conditions of 10 h day/14 h night (OQ) or 16 h day/8 h night (RT). Q There were one or two giant chloroplasts in the leaf protoplasts from su mutants grown at 10 h day/14 h night. T There were one to four giant chloroplasts in each leaf protoplast from su mutants grown at 16 h days/8 h night. U Statistical analysis of the percentage of cells containing chloroplasts (CC) in the total epidermal cell population. The stems of su mutants grown under conditions of 10 h day/14 h night (10 h day) or 16 h day/8 h night (16 h day) were analyzed. The bars represent the standard deviation (SDs) of 50 biological replicates. The asterisk indicates a significant difference by t-test: *0.01 < P < 0.05. V Statistical analysis of the percentage of protoplasts containing chloroplasts (CC) in the total protoplast population. The stems of su mutants grown under conditions of 10 h day/14 h night (10 h day) or 16 h day/8 h night (16 h day) were used for protoplast isolation. In addition, some protoplasts from the stems of su mutants grown on a 10 h day/14 h night were exposed to light for an additional 5 h. The bars represent the standard deviation (SD) of five biological replicates. W Qualification of chloroplasts in protoplasts. The x-axis shows su mutants grown under lighting conditions of 10 h day/14 h night (10 h) or 16 h day/8 h night (16 h). The y-axis shows the proportion of chloroplasts in each protoplast. The blue column shows the proportion of protoplasts containing one chloroplast; the red column shows the proportion of protoplasts containing two chloroplasts; and so on. Fifty protoplasts were quantified for the treatment of 16 h days/8 h night, and eighty protoplasts were quantified for the treatment of 10 h day/14 h night

Similar articles

Cited by

References

    1. Waters MT, Langdale JA. The making of a chloroplast. EMBO J. 2009;28:2861–2873. doi: 10.1038/emboj.2009.264. - DOI - PMC - PubMed
    1. Marrison JL, et al. The distinctive roles of five different ARC genes in the chloroplast division process in Arabidopsis. Plant J. 1999;18:651–662. doi: 10.1046/j.1365-313x.1999.00500.x. - DOI - PubMed
    1. Possingham JV, Lawrence ME. Controls to chloroplast division. Int. Rev. Cytol. 1983;84:1–56. doi: 10.1016/S0074-7696(08)61014-1. - DOI
    1. Pyke KA, Leech RM. Chloroplast division and expansion is radically altered by nuclear mutations in Arabidopsis thaliana. Plant Physiol. 1992;99:1005–1008. doi: 10.1104/pp.99.3.1005. - DOI - PMC - PubMed
    1. Pyke KA, Leech RM. A genetic analysis of chloroplast division and expansion in Arabidopsis thaliana. Plant Physiol. 1994;104:201–207. doi: 10.1104/pp.104.1.201. - DOI - PMC - PubMed