. 2021 May 31;12(1):3321.
doi: 10.1038/s41467-021-23843-0.

Impaired calcium signaling in astrocytes modulates autism spectrum disorder-like behaviors in mice

Affiliations

Impaired calcium signaling in astrocytes modulates autism spectrum disorder-like behaviors in mice

Qian Wang et al. Nat Commun. .

Abstract

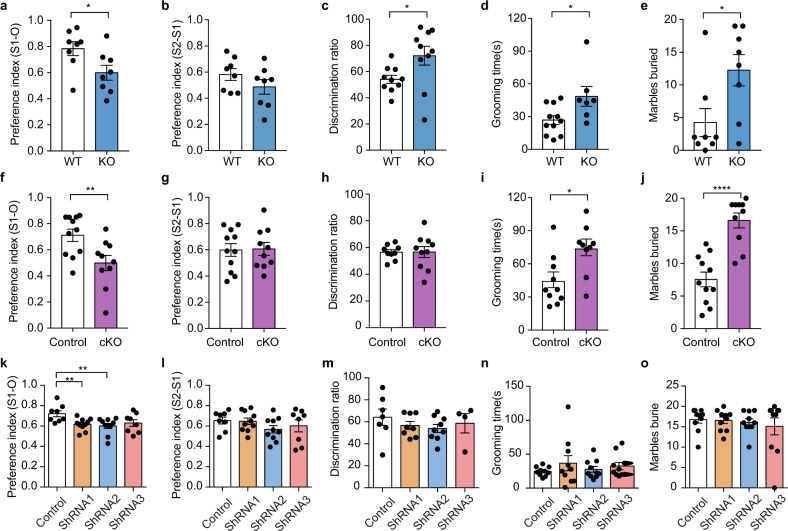
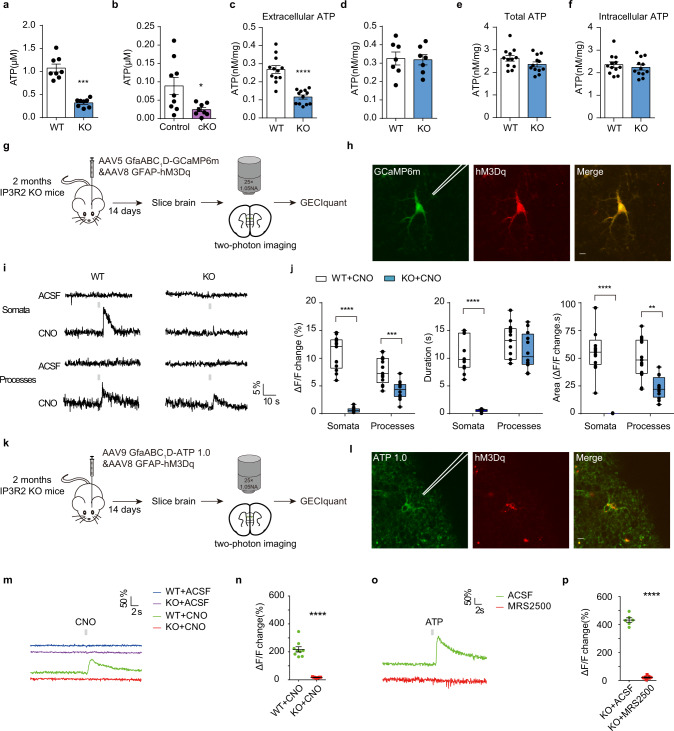
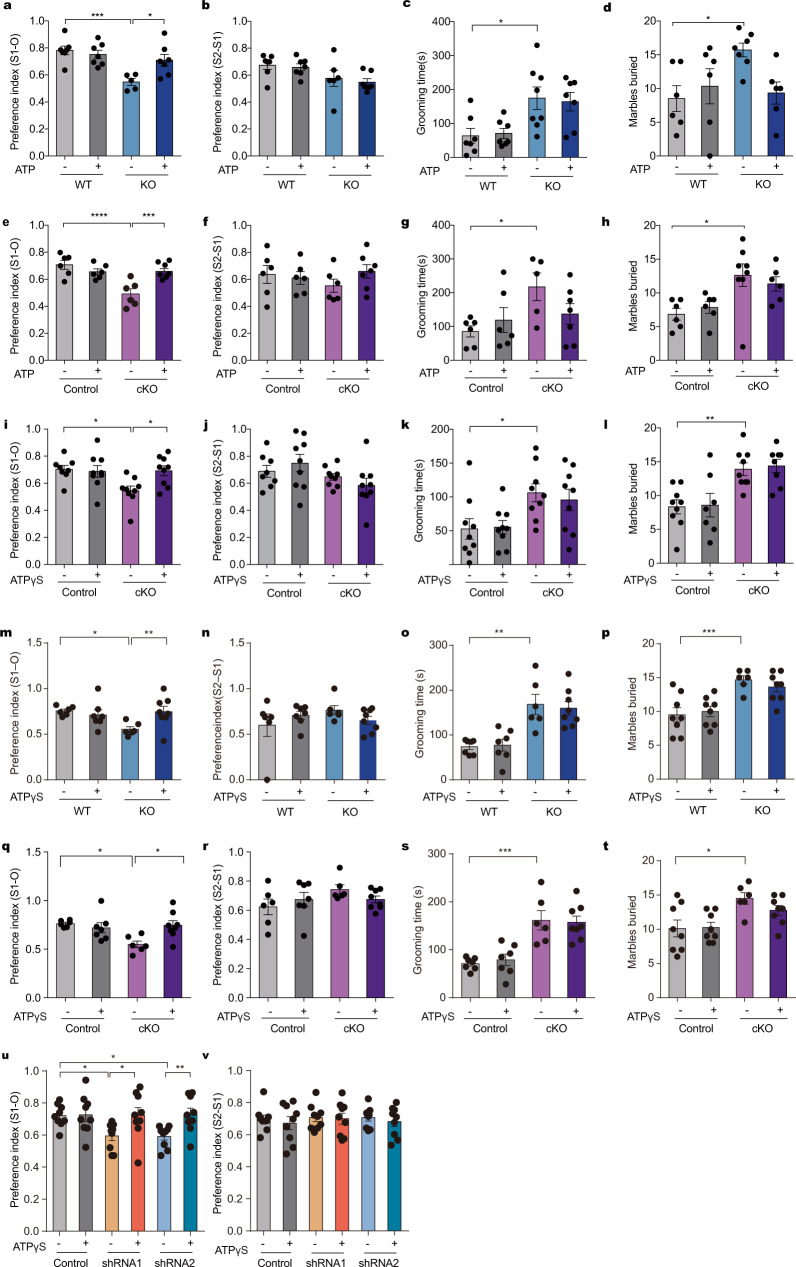
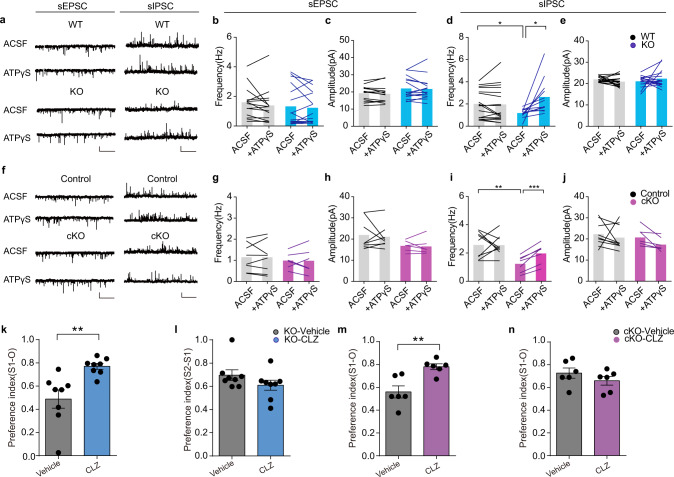
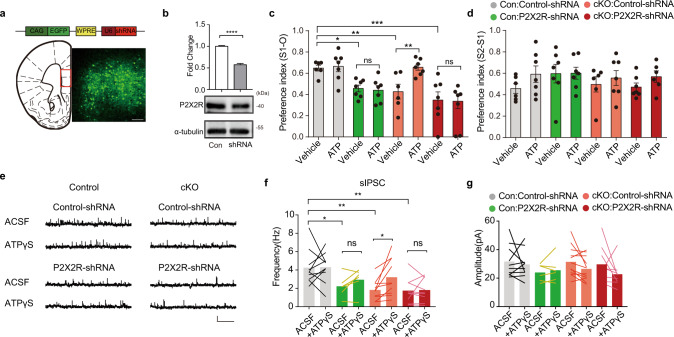
Autism spectrum disorder (ASD) is a common neurodevelopmental disorder. The mechanisms underlying ASD are unclear. Astrocyte alterations are noted in ASD patients and animal models. However, whether astrocyte dysfunction is causal or consequential to ASD-like phenotypes in mice is unresolved. Type 2 inositol 1,4,5-trisphosphate 6 receptors (IP3R2)-mediated Ca2+ release from intracellular Ca2+ stores results in the activation of astrocytes. Mutations of the IP3R2 gene are associated with ASD. Here, we show that both IP3R2-null mutant mice and astrocyte-specific IP3R2 conditional knockout mice display ASD-like behaviors, such as atypical social interaction and repetitive behavior. Furthermore, we show that astrocyte-derived ATP modulates ASD-like behavior through the P2X2 receptors in the prefrontal cortex and possibly through GABAergic synaptic transmission. These findings identify astrocyte-derived ATP as a potential molecular player in the pathophysiology of ASD.


Conflict of interest statement

The authors declare no competing interests.

Figures

Fig. 1
Fig. 1. IP3R2 null mutant (IP3R2 KO) and Aldh1L1-CreER:IP3R2loxp/loxp (IP3R2 cKO) mice exhibit ASD-like behaviors.
a, b Impaired social interaction in IP3R2 KO mice in the three-chamber test. a Social preference (object versus stranger 1, S1-O, t14 = 2.353, P = 0.0338, n = 8). b Social novelty recognition (S2-S1, t14 = 1.341, P = 0.2013, n = 8). c Enhanced recognition memory in IP3R2 KO mice in the novel object recognition test (U = 20, P = 0.0232, n = 10). d, e Increased repetitive behavior in IP3R2 KO mice in the self-grooming test (d t18 = 2.471, P = 0.0251, n = 11/7) and the marble-burying test (e t14 = 2.488, P = 0.0261, n = 8). f, g Same as (a, b) but for IP3R2 cKO mice (f t19 = 2.873, P = 0.0097, n = 11/10; g t19 = 0.9303, P = 0.3639, n = 11/10). h Same as (c) but for IP3R2 cKO mice (U = 40, P = 0.7197, n = 9/10). i, j Same as (d, e) but for IP3R2 cKO mice (i t17 = 2.845, P = 0.0112, n = 10/9; j t19 = 5.633, P = 0.2 × 10−4, n = 11/10). k, l Same as (a, b) but for IP3R2 knockdown C57BL/6 J mice (k Control vs. ShRNA1, t16 = 0.3078, p = 0.0072, n = 8/10; Control vs. shRNA2, t16 = 0.3065, p = 0.0074, n = 8/10; l Control vs. shRNA1, t16 = 0.1498, p = 0.8828, n = 8/10; Control vs. shRNA2, t16 = 1.704, p = 0.1076, n = 8/10). m Same as (c) but for IP3R2 knockdown C57BL/6J mice. n, o Same as (d, e) but for IP3R2 knockdown C57BL/6J mice. WT, wild-type mice; KO, IP3R2 null mutant mice; control, Aldh1L1-CreER mice; cKO, IP3R2 cKO mice. Data are presented as mean ± SEM; two-tailed unpaired t test (a, b, d, e, f, g, i, j, k, l, m); Mann–Whitney U-test (c, h, n, o). *P < 0.05, **P < 0.01, ****P < 0.0001. Each data point represents an individual mouse. Comparisons with no asterisk had a P > 0.05 and were considered not significant. Source data are provided as a Source data file.
Fig. 2
Fig. 2. Astrocytic ATP release is impaired in IP3R2 KO mice.
a, b ATP levels in the mPFC of IP3R2 KO (a U = 0, P = 0.0002, n = 8) and IP3R2 cKO (b U = 14, P = 0.0360, n = 9/8) mice. IP3R2loxp/loxp mice were used as control (b). c, d ATP levels in the culture medium of astrocytes (c, t22 = 6.397, P = 0.3 × 10−5, n = 12) or neurons (d t12 = 0.1578, P = 0.8772, n = 7) from IP3R2 KO and WT mice. e, f Total ATP levels (e t22 = 1.620, P = 0.1195, n = 12) and intracellular ATP levels (f t22 = 0.6959, P = 0.4938, n = 12) in astrocytes from IP3R2 KO and WT mice. g Schematic experimental approach. h Two-photon calcium imaging of an hM3Dq&GCaMP6m-expressing astrocyte, with an adjacently placed glass pipette. Scale bar, 5 μm. i Representative fluorescence traces from an hM3Dq&GCaMP6m-expressing astrocyte treated with CNO or ACSF in IP3R2 WT and KO mice. A gray line represents the 200 ms of 10 mM CNO application. j Summary of the results from all imaged cells (WT vs. KO, ΔF/F change, somata: t23 = 12.473, P = 0, processes: t23 = 4.271, P = 0.286 × 103; duration, somata: t23 = 11.826, P = 0, processes: t23 = 1.305, P = 0.2058; area, somata: t23 = 7.839, P = 0, processes: t23 = 3.239, P = 0.3622 × 10−2; n = 13/12 cells from 3 mice each). Box plots present, in ascending order, minimum sample value, first quartile, median, third quartile, and maximum sample value. k Schematic experimental approach. l Same as (h) but for an hM3Dq- and ATP1.0-expressing astrocyte. Scale bar, 5 μm. m Same as (i) but for an hM3Dq- and ATP1.0-expressing astrocyte. Representative movies are shown as Supplementary Videos 1-4. n Summary of the results from all imaged cells (t16 = 10.79, P = 0.5 × 10−5, n = 9 cells from 3 mice each). o Representative fluorescence traces from hM3Dq- and ATP1.0-expressing astrocytes pre-treated with ACSF or 30 μM MRS2500 (a P2Y1R antagonist) in IP3R2 KO mice. p Summary of the results from all imaged cells (t13 = 25.20, P = 0.1 × 10−5, n = 6/9 cells from 3 mice each). Data are presented as mean ± SEM. *P < 0.05, **P < 0.01, ***P < 0.001, ****P < 0.0001. Two-tailed unpaired t test (af, j, n, p). Source data are provided as a Source data file.
Fig. 3
Fig. 3. Rescue of social behaviors by acute ATP or ATPγS treatment in IP3R2 mutant mice.
a, b Intraperitoneal (i.p.) injection of 125 mg/kg ATP restored social interaction in IP3R2 KO mice (a F3,23 = 8.876, P = 0.0004; KOvehicle vs. KOATP, P = 0.0155; b F3,23 = 2.925, P = 0.0553; n = 7,7,6,7). c, d i.p. ATP treatment did not affect repetitive behaviors (c F3,25 = 5.323, P = 0.0056, n = 7,7,8,7; d F3,21 = 3.372, P = 0.0377, n = 6,6,7,6). e, f Same as (a, b) but for IP3R2 cKO mice (e F3,21 = 13.95, P = 0.32 × 10−4; cKOvehicle vs. cKOATP, P = 0.371 × 10−3; f F3,21 = 0.7249, P = 0.5484; n = 6,6,6,7). g, h Same as (c, d) but for IP3R2 cKO mice (g F3,20 = 2.761, P = 0.0689, n = 6,6,5,7; h F3,22 = 4.761, P = 0.0105, n = 6,6,8,6). i, j Intracerebroventricular (i.c.v.) injection of ATPγS (50 µM) restored social interaction in IP3R2 cKO mice (i F3,31 = 4.238, P = 0.0127; cKOvehicle vs. cKOATPγs, P = 0.0339; j F3,31 = 2.059, P = 0.126; n = 8,9,9,9). k, l i.c.v. ATPγS treatment did not affect repetitive behaviors (k F3,32 = 3.942, P = 0.0168, n = 9; l F3,29 = 8.058, P = 0.0005, n = 9,7,9,8). m, n Same as (j) but for intra-mPFC injection in IP3R2 KO mice (m F3,23 = 3.401, P = 0.0348; KOvehicle vs. KOATPγS, P = 0.0099; n F3,23 = 0.9799, P = 0.4194; n = 6,7,6,8). o, p Intra-mPFC ATPγS treatment did not affect repetitive behaviors (o F3,24 = 11.87, P = 0.58 × 10−4, n = 7,7,6,8; p F3,26 = 9.106, P = 0.0003, n = 8,8,6,8). q, r Same as (m, n) but for IP3R2 cKO mice (q F3,23 = 4.721, P = 0.0104; cKOvehicle vs. cKOATPγs, P = 0.0186; r F3,23 = 1.314, P = 0.2939; n = 6,7,6,8). s, t Same as (o, p) but for IP3R2 cKO mice (s F3,24 = 13.62, P = 0.22 × 10−4, n = 7,7,6,8; t F3,26 = 4.789, P = 0.0087, n = 8,8,6,8). u, v Same as (m, n) but for IP3R2 knockdown mice (u F5,48 = 3.954, P = 0.0044; shRNA1vehicle vs. shRNA1ATPγs, P = 0.0108; shRNA2vehicle vs. shRNA2ATPγs, P = 0.0063; v F5,48 = 0.2194, P = 0.9525; n = 9). Each data point represents an individual mouse. Data are presented as mean ± SEM. *P < 0.05, **P < 0.01, ***P < 0.001, ****P < 0.0001. One-way ANOVA with Tukey’s (al, nt, v) or Fisher’s LSD (m, u) multiple comparison post hoc test. Source data are provided as a Source data file.
Fig. 4
Fig. 4. IP3R2 mutant mice exhibit impaired GABAergic neurotransmission, which can be restored by ATPγS treatment.
a sEPSC and sIPSC recordings with and without ATPγS (25 µM) treatment in mPFC layer 5 pyramidal neurons from WT and IP3R2 KO slices. Scale bars: 20 pA, 2 s. be Bar graphs showing sEPSC and sIPSC frequency (b, d: WTACSF vs. KOACSF, two-tailed unpaired t-test, t27 = 2.173, P = 0.0387, n = 17/12; WTACSF vs. WTATPγS, two-tailed paired t-test, t16 = 0.3945, P = 0.6984, n = 17; KOACSF vs. KOATPγS, two-tailed paired t-test, t11 = 2.905, P = 0.0143, n = 12) and amplitude (c, e) in WT and IP3R2 KO slices with and without ATPγS treatment. IP3R2 KO mice exhibited impaired GABAergic neurotransmission that was restored by ATPγS treatment. f Same as (a) but for IP3R2 cKO slices. Scale bars: 20 pA, 2 s. gj Bar graphs showing sEPSC and sIPSC frequency (g, i controlACSF vs. cKOACSF, two-tailed unpaired t-test, t14 = 3.163, P = 0.0069, n = 7/9; controlACSF vs. controlATPγs, two-tailed paired t-test, t8 = 0.1744, P = 0. 8659, n = 9; cKOACSF vs. cKOATPγs, two-tailed paired t-test, t6 = 6.462, P = 0.0007, n = 7) and amplitude (h, j) in control and IP3R2 cKO slices. k, l Rescue of social behaviors in IP3R2 KO mice upon acute clonazepam (CLZ, 0.0625 mg/kg, i.p.) treatment in the three-chamber test (k U = 3, P = 0.0011; l t14 = 1.399, P = 0.1836, n = 8). m, n Same as (k, l) but for IP3R2 cKO mice (m t10 = 3.757, P = 0.0037; n t10 = 1.153, P = 0.2758, n = 6). Each data point represents an individual mouse (kn). Data are presented as the mean ± SEM. Two-tailed unpaired t test (ln). Mann–Whitney U-test (k). *P < 0.05, **P < 0.01, ***P < 0.001. Source data are provided as a Source data file.
Fig. 5
Fig. 5. P2X2 receptors in the prefrontal cortex mediate the beneficial effects of ATP on ASD-like behaviors.
a A schematic of the AAV vector carrying P2X2R-shRNA (top). The viral expression of P2X2R-shRNA (bottom right) and the injection site in the mPFC (bottom left, red box, scale bar: 100 µm). b Western blot showing P2X2R knockdown in the mPFC with AAV-P2X2R-shRNA (two-tailed unpaired t-test, t6 = 12.71, P = 0.15 × 10−4, n = 4). c, d i.p. injection of ATP (125 mg/kg) rescued social interaction in IP3R2 cKO mice, and this effect was blocked by P2X2R knockdown (c F7,45 = 6.973, P = 0.7 × 10−5; Con:Control-shRNAvehicle vs. Con:P2X2R-shRNAvehicle, P = 0.0142; Con:Control-shRNAvehicle vs. cKO:Control-shRNAvehicle, P = 0.0066; Con:Control-shRNAvehicle vs. cKO:P2X2R-shRNAvehicle, P = 0.0002; Con:P2X2R-shRNAvehicle vs. Con:P2X2R-shRNAATP, P = 0.8171; cKO:Control-shRNAvehicle vs. cKO:Control-shRNAATP, P = 0.0037; cKO:P2X2R-shRNAvehicle vs. cKO:P2X2R-shRNAATP, P = 0.8931; d F7,45 = 0.8109, P = 0.5830; n = 6,7,7,7,6,7,7,7). e sIPSC recordings with and without ATPγS (25 µM) treatment in mPFC layer 5 pyramidal neurons from control and IP3R2 cKO mice injected with control-shRNA or P2X2R-shRNA. f, g Bar graphs showing sIPSC frequency (f Con:Control-shRNAACSF vs. Con:P2X2R-shRNAACSF, two-tailed unpaired t-test, t14 = 2.381, P = 0.0320, n = 10/6; Con:Control-shRNAACSF vs. cKO:control-shRNAACSF, two-tailed unpaired t-test, t18 = 3.539, P = 0.0023, n = 10; Con:Control-shRNAACSF vs. cKO:P2X2R-shRNAACSF, two-tailed unpaired t-test, t17 = 3.273, P = 0.0045, n = 9/10; Con:P2X2R-shRNAACSF vs. Con:P2X2R-shRNAATPγs, two-tailed paired t-test, t5 = 2.001, P = 0.1018, n = 6; cKO:Control-shRNAACSF vs. cKO:Control-shRNAATPγs, two-tailed paired t-test, t9 = 2.777, P = 0.0215, n = 10; cKO:P2X2R-shRNAACSF vs. cKO:P2X2R-shRNAATPγs, two-tailed paired t-test, t8 = 0.1624, P = 0.8750, n = 9) and amplitude (g) with or without ATPγS (25 µM) treatment in mPFC layer 5 pyramidal neurons from control and IP3R2 cKO mice injected with control-shRNA or P2X2R-shRNA. P2X2R knockdown prevented the enhancing effect of ATPγS (25 µM) on sIPSC frequency in IP3R2 cKO slices. Scale bars: 20 pA, 2 s. Each data point represents an individual mouse (c, d). Data are presented as the mean ± SEM. *P < 0.05, **P < 0.01, ***P < 0.001, ****P < 0.0001. ns, no significant difference. One-way ANOVA with Fisher’s LSD multiple comparison post hoc test (c, d). Source data are provided as a Source data file.

Similar articles

Cited by

References

    1. Bourgeron T. From the genetic architecture to synaptic plasticity in autism spectrum disorder. Nat. Rev. Neurosci. 2015;16:551–563. doi: 10.1038/nrn3992. - DOI - PubMed
    1. de la Torre-Ubieta L, Won H, Stein JL, Geschwind DH. Advancing the understanding of autism disease mechanisms through genetics. Nat. Med. 2016;22:345–361. doi: 10.1038/nm.4071. - DOI - PMC - PubMed
    1. Nelson SB, Valakh V. Excitatory/inhibitory balance and circuit homeostasis in autism spectrum disorders. Neuron. 2015;87:684–698. doi: 10.1016/j.neuron.2015.07.033. - DOI - PMC - PubMed
    1. Tabuchi K, et al. A neuroligin-3 mutation implicated in autism increases inhibitory synaptic transmission in mice. Science. 2007;318:71–76. doi: 10.1126/science.1146221. - DOI - PMC - PubMed
    1. Scuderi C, Verkhratsky A. The role of neuroglia in autism spectrum disorders. Prog. Mol. Biol. Transl. Sci. 2020;173:301–330. doi: 10.1016/bs.pmbts.2020.04.011. - DOI - PubMed

Publication types

MeSH terms