

Aspiration dynamics generate robust predictions in heterogeneous populations
- PMID: 34059670
- PMCID: PMC8166829
- DOI: 10.1038/s41467-021-23548-4
Aspiration dynamics generate robust predictions in heterogeneous populations
Abstract
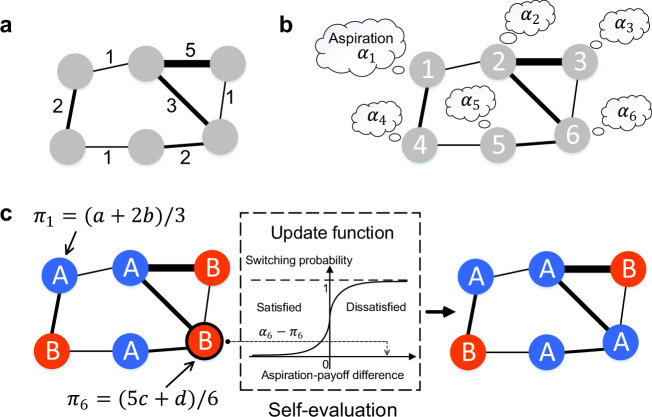
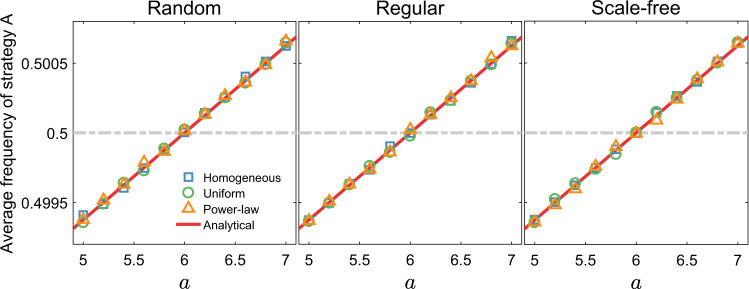
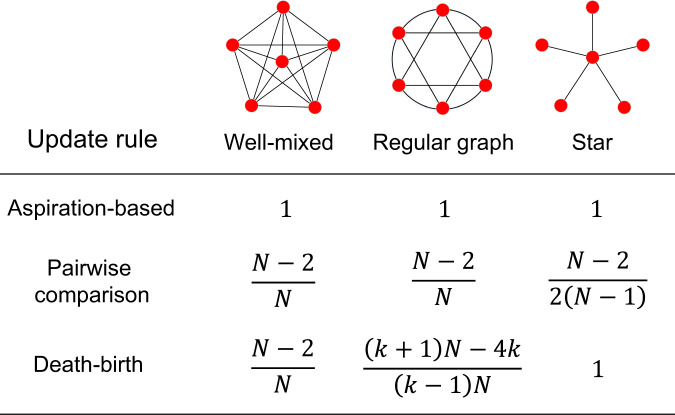
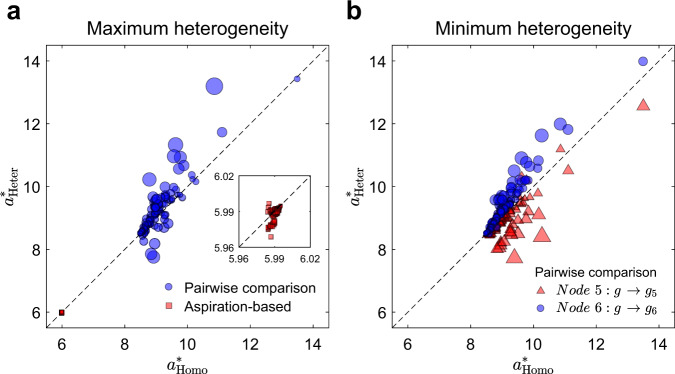
Update rules, which describe how individuals adjust their behavior over time, affect the outcome of social interactions. Theoretical studies have shown that evolutionary outcomes are sensitive to model details when update rules are imitation-based but are robust when update rules are self-evaluation based. However, studies of self-evaluation based rules have focused on homogeneous population structures where each individual has the same number of neighbors. Here, we consider heterogeneous population structures represented by weighted networks. Under weak selection, we analytically derive the condition for strategy success, which coincides with the classical condition of risk-dominance. This condition holds for all weighted networks and distributions of aspiration levels, and for individualized ways of self-evaluation. Our findings recover previous results as special cases and demonstrate the universality of the robustness property under self-evaluation based rules. Our work thus sheds light on the intrinsic difference between evolutionary dynamics under self-evaluation based and imitation-based update rules.
Conflict of interest statement
The authors declare no competing interests.
Figures
Similar articles
-
Aspiration dynamics of multi-player games in finite populations.J R Soc Interface. 2014 Mar 5;11(94):20140077. doi: 10.1098/rsif.2014.0077. Print 2014 May 6. J R Soc Interface. 2014. PMID: 24598208 Free PMC article.
-
Evolution of cooperation in social dilemmas under the coexistence of aspiration and imitation mechanisms.Phys Rev E. 2020 Sep;102(3-1):032120. doi: 10.1103/PhysRevE.102.032120. Phys Rev E. 2020. PMID: 33075988
-
Aspiration dynamics in structured population acts as if in a well-mixed one.Sci Rep. 2015 Jan 26;5:8014. doi: 10.1038/srep08014. Sci Rep. 2015. PMID: 25619664 Free PMC article.
-
Evolutionary game dynamics of combining the imitation and aspiration-driven update rules.Phys Rev E. 2019 Aug;100(2-1):022411. doi: 10.1103/PhysRevE.100.022411. Phys Rev E. 2019. PMID: 31574646
-
Social traits, social networks and evolutionary biology.J Evol Biol. 2017 Dec;30(12):2088-2103. doi: 10.1111/jeb.13195. Epub 2017 Nov 4. J Evol Biol. 2017. PMID: 29044796 Review.
Cited by
-
Evolutionary dynamics of behavioral motivations for cooperation.Nat Commun. 2025 Apr 29;16(1):4023. doi: 10.1038/s41467-025-59366-1. Nat Commun. 2025. PMID: 40301382 Free PMC article.
-
Evolutionary dynamics on sequential temporal networks.PLoS Comput Biol. 2023 Aug 7;19(8):e1011333. doi: 10.1371/journal.pcbi.1011333. eCollection 2023 Aug. PLoS Comput Biol. 2023. PMID: 37549167 Free PMC article.
-
Optimization of institutional incentives for cooperation in structured populations.J R Soc Interface. 2023 Feb;20(199):20220653. doi: 10.1098/rsif.2022.0653. Epub 2023 Feb 1. J R Soc Interface. 2023. PMID: 36722070 Free PMC article.
-
Evolutionary multiplayer games on graphs with edge diversity.PLoS Comput Biol. 2019 Apr 1;15(4):e1006947. doi: 10.1371/journal.pcbi.1006947. eCollection 2019 Apr. PLoS Comput Biol. 2019. PMID: 30933968 Free PMC article.
-
Deterministic theory of evolutionary games on temporal networks.J R Soc Interface. 2024 May;21(214):20240055. doi: 10.1098/rsif.2024.0055. Epub 2024 May 29. J R Soc Interface. 2024. PMID: 38807526 Free PMC article.
References
-
- Nowak, M. A. Evolutionary Dynamics (Harvard Univ. Press, 2006).
-
- Nowak MA, May RM. Evolutionary games and spatial chaos. Nature. 1992;359:826–829. doi: 10.1038/359826a0. - DOI
Publication types
LinkOut - more resources
Full Text Sources
