. 2021 May 31;12(1):3256.
doi: 10.1038/s41467-021-23482-5.

Mechanically activated ion channel Piezo1 modulates macrophage polarization and stiffness sensing

Affiliations

Mechanically activated ion channel Piezo1 modulates macrophage polarization and stiffness sensing

Hamza Atcha et al. Nat Commun. .

Abstract

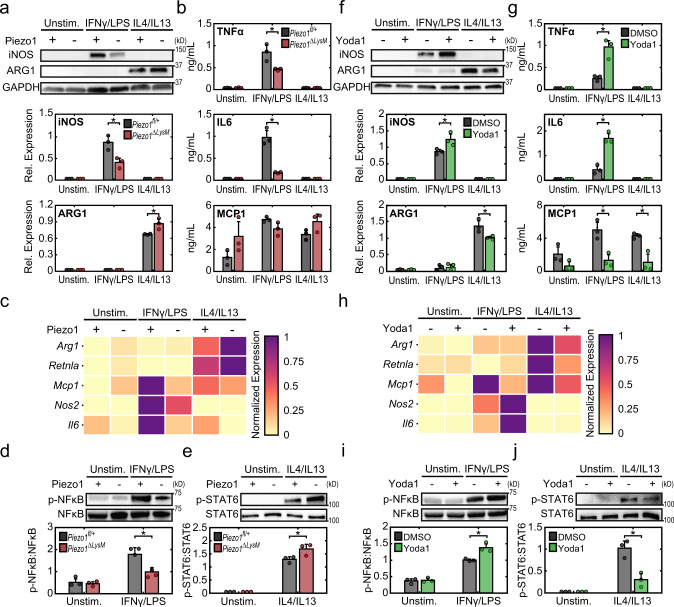
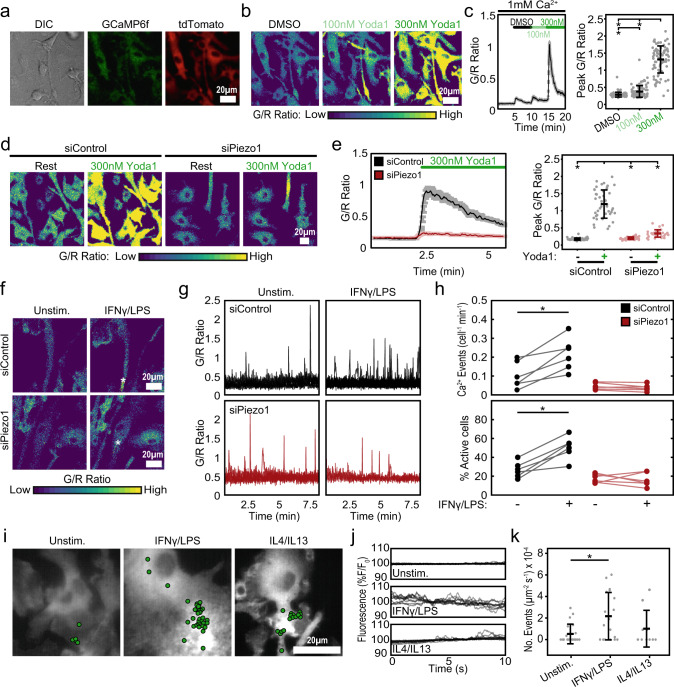
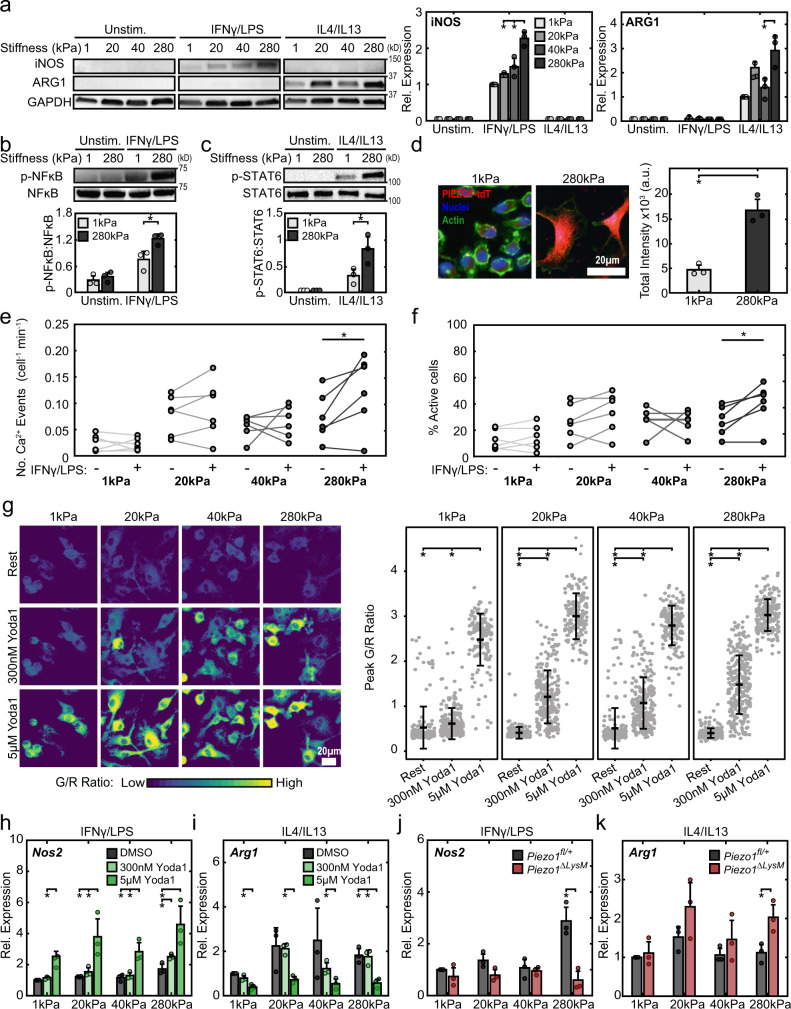
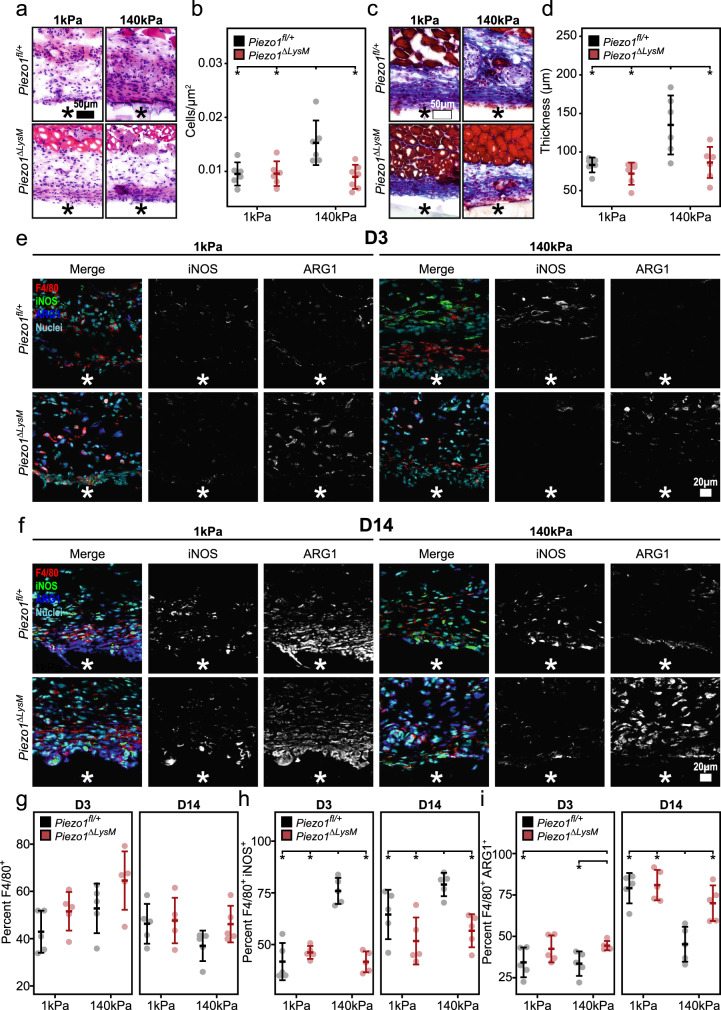
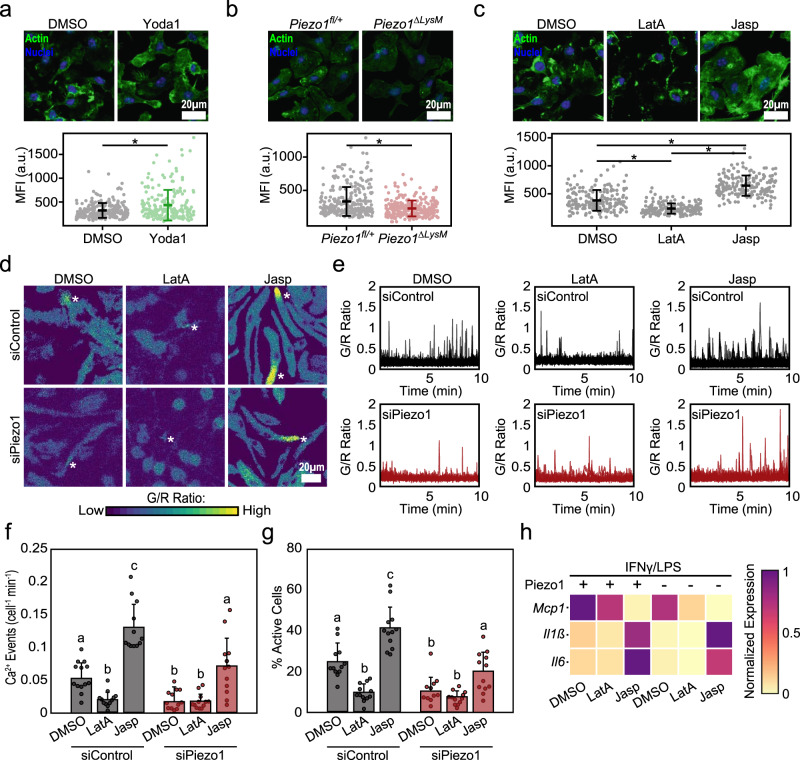
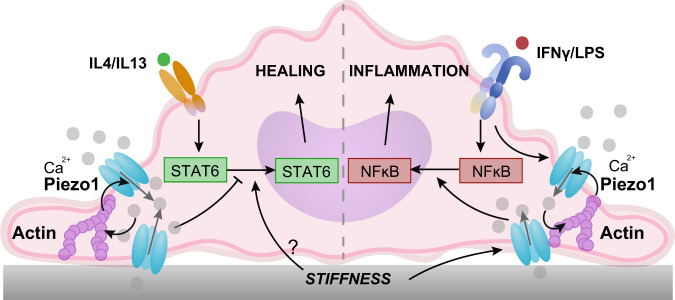
Macrophages perform diverse functions within tissues during immune responses to pathogens and injury, but molecular mechanisms by which physical properties of the tissue regulate macrophage behavior are less well understood. Here, we examine the role of the mechanically activated cation channel Piezo1 in macrophage polarization and sensing of microenvironmental stiffness. We show that macrophages lacking Piezo1 exhibit reduced inflammation and enhanced wound healing responses. Additionally, macrophages expressing the transgenic Ca2+ reporter, Salsa6f, reveal that Ca2+ influx is dependent on Piezo1, modulated by soluble signals, and enhanced on stiff substrates. Furthermore, stiffness-dependent changes in macrophage function, both in vitro and in response to subcutaneous implantation of biomaterials in vivo, require Piezo1. Finally, we show that positive feedback between Piezo1 and actin drives macrophage activation. Together, our studies reveal that Piezo1 is a mechanosensor of stiffness in macrophages, and that its activity modulates polarization responses.


Conflict of interest statement

The authors declare no competing interests.

Figures

Fig. 1
Fig. 1. Piezo1 regulates cytokine-induced macrophage activation.
a Representative Western blots (top) and quantification (bottom) of iNOS, ARG1, and GAPDH of Piezo1fl/+ and Piezo1ΔLysM BMDMs incubated with media (Unstim.), IFNγ/LPS (0.3 ng/mL of each), or IL4/IL13 (0.1 ng/mL of each). b TNFα, IL6, and MCP1 secretion from Piezo1fl/+ and Piezo1ΔLysM BMDMs incubated with the indicated conditions, as measured by ELISA. c Relative gene expression of inflammatory and healing markers in Piezo1fl/+ and Piezo1ΔLysM BMDMs incubated with the indicated conditions, as measured by qPCR. Gene expression is shown relative to the highest expressing condition. d, e Representative Western blots (top) and quantification (bottom) of p-NFκB/NFκB of Piezo1fl/+ and Piezo1ΔLysM BMDMs incubated with media (Unstim.) or IFNγ/LPS for 1 h (d) and p-STAT6/STAT6 of Piezo1fl/+ and Piezo1ΔLysM BMDMs incubated with media (Unstim.) or IL4/IL13 for a period of 1 h (e). f Representative Western blots (top) and quantification (bottom) of iNOS, ARG1, and GAPDH of BMDMs exposed to DMSO or 5 µM Yoda1 and stimulated with media (Unstim.), IFNγ/LPS (0.3 ng/mL of each), or IL4/IL13 (0.1 ng/mL of each). g TNFα, IL6, and MCP1 secretion from BMDMs exposed to DMSO or 5 µM Yoda1 and incubated in the indicated conditions, as measured by ELISA. h Relative gene expression of inflammatory and healing markers of BMDMs exposed to DMSO or 5 µM Yoda1 incubated in the indicated conditions, as measured by qPCR. Gene expression is shown relative to the highest expressing condition. ij Representative Western blots (top) and quantification (bottom) of p-NFκB/NFκB of wild-type BMDMs exposed to DMSO or Yoda1 and stimulated with media (Unstim.) or IFNγ/LPS for 2 h (d) and p-STAT6/STAT6 of Piezo1fl/+ and Piezo1ΔLysM BMDMs incubated with media (Unstim.) or IL4/IL13 for a period of 1 h. Error bars denote Mean ± SD for three independent experiments, * p < 0.05 as determined by two-tailed Student’s t test. Phosphorylated and total forms of transcription factors were obtained from loading equal amounts of protein in separate gels and the resulting blots were processed in parallel. Source data including exact p-values are provided as a Source Data file.
Fig. 2
Fig. 2. Regulation of Ca2+ influx by Piezo1 channels in macrophages.
a Representative differential interference contrast (DIC) and fluorescence images showing expression of Salsa6f probe in BMDMs isolated from Vav1-Salsa6f mice, tdTomato is displayed in red and GCaMP6f is displayed in green. b Green:Red (G/R) ratio images showing Ca2+ responses to Yoda1 in Salsa6f+ BMDMs when exposed to DMSO (black), 100 nM (light green), and 300 nM (dark green) Yoda1, all in 1 mM Ca2+ Ringer solution. c G/R traces averaged across all cells in a field of view over time (left) and quantification of peak G/R ratios per cell (right) of Salsa6f+ BMDMs in response to Yoda1. N = 87 cells, representative of three independent experiments, error bars denote Mean ± SD, * p < 0.05 as determined by two-tailed Mann–Whitney U test). d Representative images showing Ca2+ responses to 300 nM Yoda in Salsa6f+ BMDMs treated with either non-target (siControl) or Piezo1 (siPiezo1) siRNA. e G/R traces averaged across all cells in a field of view over time (left) and quantification of peak G/R intensities per cell (right) of siControl and siPiezo1 treated BMDMs exposed to Ringer solution (Rest) or 300 nM Yoda1 in Ringer solution. N = 46 and 31 cells for siControl and siPiezo1 conditions, representative of three independent experiments, error bars denote Mean ± SD, * p < 0.05 as determined by two-tailed Mann–Whitney U test). fh Representative G/R ratio images (f), traces of individual Ca2+ events (g), and quantification of number of Ca2+ events (normalized for cell number and time) and fraction of cells showing Ca2+ elevations (h) taken from a time-lapse video of siControl and siPiezo1 treated Salsa6f+ BMDMs following acute addition of Ringer solution (Unstim.) or Ringer solution containing 100 ng/mL IFNγ/LPS. Asterisks denote the occurrence of a Ca2+ event. Each data point in (h) denotes a single video (N = 6 videos, * p < 0.05 as determined by two-tailed paired t test). ik Representative images overlaid with centroids denoting Ca2+ flickers in green (i) and traces of individual Ca2+ flickers (j) recorded in unstimulated, 0.3 ng/mL IFNγ/LPS, and 0.1 ng/mL IL4/IL13 stimulated Salsa6f+ BMDMs using high speed TIRF microscopy. k Frequency of Ca2+ flickers in unstimulated, IFNγ/LPS, and IL4/IL13 stimulated BMDMs. Each data point represents the frequency of Ca2+ flickers in a single video each composed of one or more cells. N = 21, 18, and 10 fields of view for Unstim., IFNγ/LPS and IL4/IL13 conditions, respectively. Error bars denote Mean ± SD, and * p < 0.05 as determined by two-tailed Mann–Whitney U test). Source data including exact p-values are provided as a Source Data file.
Fig. 3
Fig. 3. Stiffness-dependent Piezo1 expression/activity modulates macrophage activation.
a Representative Western blots (left) and quantification (right) of iNOS, ARG1, and GAPDH of BMDMs seeded on 1, 20, 40, and 280 kPa polyacrylamide gels and incubated with media (Unstim.), 0.3 ng/mL IFNγ/LPS, or 0.1 ng/mL IL4/IL13. Data normalized to the 1 kPa IFNγ/LPS condition. Samples were derived from the same experiment and the resulting blots were processed in parallel. b, c Representative Western blots (top) and quantification (bottom) of p-NFκB/NFκB (b) and p-STAT6/STAT6 (c) in wild type BMDMs seeded on 1 and 280 kPa polyacrylamide gels and stimulated with IFNγ/LPS or IL4/IL13, respectively. Phosphorylated and total forms of transcription factors were obtained from loading equal amounts of protein in separate gels and the resulting blots were processed in parallel. d Representative immunofluorescent images (left) and quantification of fluorescence (right) of Piezo1P1-tdT BMDMs seeded on polyacrylamide gels, tdTomato is displayed in red. Quantification of e number of Ca2+ events (normalized for cell number and time) and f fraction of cells showing Ca2+ elevations in unstimulated BMDMs seeded on 1, 20, 40, and 280 kPa polyacrylamide surfaces following acute addition of Ringer solution (Unstim.) or Ringer solution with 100 ng/mL IFNγ/LPS, captured by confocal microscopy. Each data point is calculated from a 10-min time-lapse video (N = 6 for each stiffness). g Representative G/R ratio images (left) and quantification of peak G/R intensities of BMDMs seeded on polyacrylamide gels of indicated stiffness and exposed to DMSO, 300 nM Yoda1, and 5 µM Yoda1. N = 107, 248, 145 cells on 1 kPa, n = 118, 239, 169 cells on 20 kPa, n = 113, 250, 183 cells on 40 kPa, and n = 106, 274, 184 cells on 280 Pa and exposed to Rest, 300 nM Yoda1, or 5 µM Yoda1, respectively. Data representative of three independent experiments. h Relative Nos2 gene expression of BMDMs seeded on surfaces of indicated stiffness, exposed to DMSO, 300 nM Yoda1, or 5 µM Yoda1, and stimulated with 0.3 ng/mL IFNγ/LPS. Data normalized to 1 kPa DMSO control. i Relative Arg1 gene expression of BMDMs seeded on surfaces of indicated stiffness, exposed to DMSO, 300 nM Yoda1, or 5 µM Yoda1, and stimulated with 0.1 ng/mL IL4/IL13. Data normalized to 1 kPa DMSO control. j Relative Nos2 gene expression Piezo1fl/+ and Piezo1ΔLysM BMDMs seeded on surfaces of indicated stiffness and stimulated with 0.3 ng/mL IFNγ/LPS. Data normalized to 1 kPa Piezo1 control. k Relative Arg1 gene expression of Piezo1fl/+ and Piezo1ΔLysM BMDMs seeded on surfaces of indicated stiffness, and stimulated with 0.1 ng/mL IL4/IL13. Data normalized to 1 kPa Piezo1fl/+ controls. Error bars denote Mean ± SD for three separate experiments, * p < 0.05 as determined by two-tailed paired t test (a, e, hk), two-tailed Student’s test (bd), or Mann–Whitney U test (g). Source data including exact p-values are provided as a Source Data file.
Fig. 4
Fig. 4. Piezo1 modulates the foreign body response and macrophage activation in response to stiff material implants.
ad Representative H&E (a) and Masson’s trichrome (c) stained tissue surrounding soft (1 kDa) and stiff (140 kDa) PEGDA material implanted in Piezo1fl/+ and Piezo1ΔLysM mice for a period of 14 days. Quantification of immune cell infiltrate normalized to area (b) and average collagen capsule thickness (d). N = 6 for Piezo1fl/+ mice treated with soft and stiff implants as well as Piezo1ΔLysM treated with soft implants, and n = 7 for Piezo1fl/+ and Piezo1ΔLysM mice treated with stiff implants. e, f Representative immunohistochemistry images of tissue collected 3 days (D3, e) and 14 days (D14, f) post-implantation and stained for F4/80, iNOS, ARG1, and Hoechst. g Quantification of percent cells that stained positive for F4/80. h Quantification of percent cells that stained positive for F4/80 and iNOS. i Quantification of percent cells that stained positive for F4/80 and ARG1. Material location indicated with asterisk. N = 5 and error bars denote Mean ± SD for n ≥ 5, * p < 0.05 as determined by two-tailed Student’s t test. Source data including exact p-values are provided as a Source Data file.
Fig. 5
Fig. 5. Piezo1-mediated regulation of actin influences macrophage inflammatory activation.
a Representative images (top) and quantification (bottom) of actin mean fluorescent intensity (MFI) of wild-type BMDMs following 1 h treatment with DMSO or Yoda1. N = 229 and 201 cells examined over three independent experiments for DMSO and Yoda1 treatment. b Representative images (top) and quantification (bottom) of actin MFI of Piezo1fl/+ and Piezo1ΔLysM BMDMs. N = 277 and 279 cells examined over three independent experiments for Piezo1fl/+ and Piezo1ΔLysM BMDMs. c Representative images (top) and quantification (bottom) of actin MFI in BMDMs following one-hour treatment with DMSO, 500 nM latrunculinA (LatA), or 500 nM jasplakinolide (Jasp). N = 195, 177, and 191 cells examined over three independent experiments for DMSO, LatA, and Jasp treatment. dg Representative G/R ratio images (d), traces of individual Ca2+ events (e), and quantification of number of Ca2+ events (normalized for cell number and time) and fraction of cells showing Ca2+ elevations, (f, g) taken from a time-lapse video of siControl and siPiezo1 treated Salsa6f+ BMDMs following addition of DMSO, LatA, or Jasp in Ringer solution containing 100 ng/mL IFNγ/LPS. Asterisks denote the occurrence of a Ca2+ event. Each data point in (f, g) denotes a single video (N = 12 videos). h Relative Il6, Il1b, and Mcp1 gene expression in Piezo1fl/+ and Piezo1ΔLysM BMDMs exposed to DMSO, LatA, or Jasp and stimulated with IFNγ/LPS for 6 hrs. Gene expression is shown relative to the highest expressing condition. For (ac), error bars denote Mean ± SD, * p < 0.05 as determined by two-tailed Mann–Whitney U test. For (f, g), error bars denote Mean ± SD for n = 3, groups not connected by the same letter are statistically different (p < 0.05) as determined by two-tailed Student’s t test. Source data including exact p-values are provided as a Source Data file.
Fig. 6
Fig. 6. Stiffness-dependent modulation of Piezo1 activity modulates macrophage activation.
Activation of Piezo1 by IFNγ/LPS on stiff substrates promotes actin polymerization, which enhances channel mediated Ca2+ influx. Positive regulation between actin and Piezo1 enhances inflammation through activation of the transcription factor, NFκB and upregulation of inflammatory markers, including iNOS, TNFα and IL6. Ca2+ influx through Piezo1 channels on stiff substrates inhibits the activation of the transcription factor STAT6 and expression of healing markers, such as ARG1. Other stiffness mediated and Piezo1 independent mechanisms likely upregulate STAT6 activation in vitro.

References

    1. Biswas SK, Mantovani A. Macrophage plasticity and interaction with lymphocyte subsets: cancer as a paradigm. Nat. Immunol. 2010;11:889–896. doi: 10.1038/ni.1937. - DOI - PubMed
    1. Mosser DM, Edwards JP. Exploring the full spectrum of macrophage activation. Nat. Rev. Immunol. 2008;8:958. doi: 10.1038/nri2448. - DOI - PMC - PubMed
    1. Sica A, Mantovani A. Macrophage plasticity and polarization: in vivo veritas. J. Clin. Invest. 2012;122:787–795. doi: 10.1172/JCI59643. - DOI - PMC - PubMed
    1. Li J, Chen J, Kirsner R. Pathophysiology of acute wound healing. Clin. Dermatol. 2007;25:9–18. doi: 10.1016/j.clindermatol.2006.09.007. - DOI - PubMed
    1. Hsieh JY, et al. Differential regulation of macrophage inflammatory activation by fibrin and fibrinogen. Acta Biomater. 2017;47:14–24. doi: 10.1016/j.actbio.2016.09.024. - DOI - PMC - PubMed

Publication types

MeSH terms