. 2021 May 31;12(1):3249.
doi: 10.1038/s41467-021-23440-1.

Impact of COVID-19 outbreaks and interventions on influenza in China and the United States

Affiliations

Impact of COVID-19 outbreaks and interventions on influenza in China and the United States

Luzhao Feng et al. Nat Commun. .

Abstract

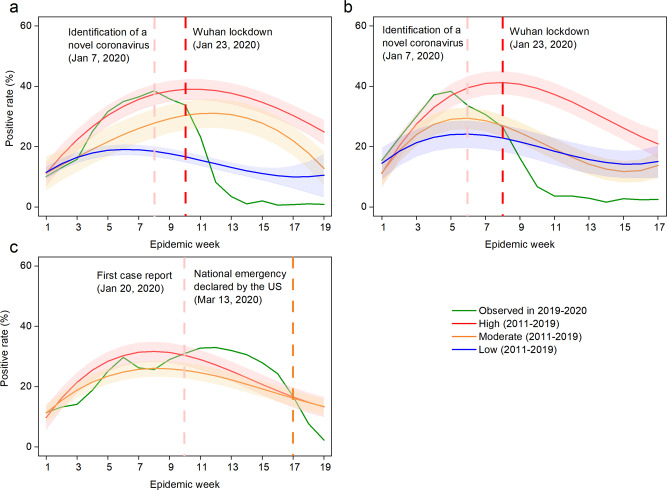
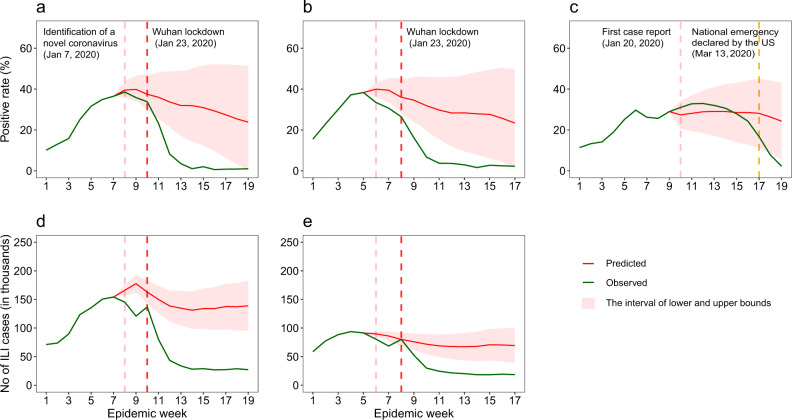
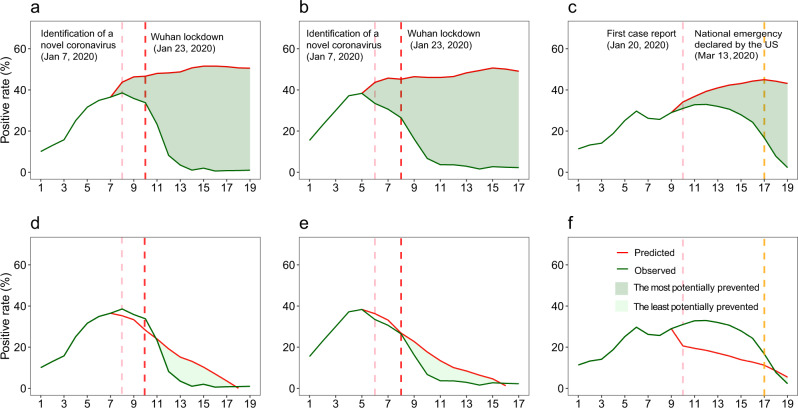
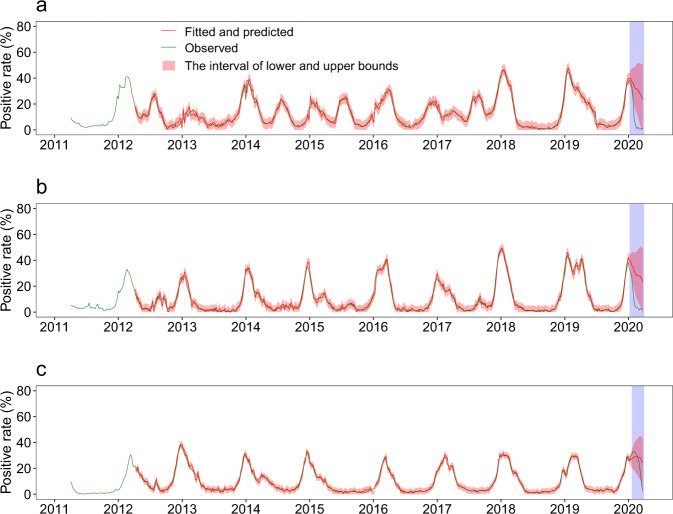
Coronavirus disease 2019 (COVID-19) was detected in China during the 2019-2020 seasonal influenza epidemic. Non-pharmaceutical interventions (NPIs) and behavioral changes to mitigate COVID-19 could have affected transmission dynamics of influenza and other respiratory diseases. By comparing 2019-2020 seasonal influenza activity through March 29, 2020 with the 2011-2019 seasons, we found that COVID-19 outbreaks and related NPIs may have reduced influenza in Southern and Northern China and the United States by 79.2% (lower and upper bounds: 48.8%-87.2%), 79.4% (44.9%-87.4%) and 67.2% (11.5%-80.5%). Decreases in influenza virus infection were also associated with the timing of NPIs. Without COVID-19 NPIs, influenza activity in China and the United States would likely have remained high during the 2019-2020 season. Our findings provide evidence that NPIs can partially mitigate seasonal and, potentially, pandemic influenza.


Conflict of interest statement

The authors declare no competing interests.

Figures

Fig. 1
Fig. 1. Observed seasonal influenza activity in 2019–2020 and predicted levels using 2011–2019 historical data.
a Southern China. b Northern China. c The US. The intensity of influenza activity was divided into three levels in China: high, moderate, and low, corresponding to high (≥25%), moderate (20–25%), and low (<20%) average test positivity rates for all epidemic weeks within a monitoring year from 2011 to 2019, while that of was two levels (high and moderate) in the US under the same classification standard. The fitted curve for each intensity level is presented with lower and upper bounds (shaded color). The pink vertical line indicates when China (a, b) first identified SARS-CoV-2 and the United States (c) first reported COVID-19 cases. The red vertical dashed lines indicate the start of the Wuhan lockdown. The orange vertical line indicates the national emergency declaration by the US. The abscissa represents the epidemic week of winter–spring seasons. The influenza test positivity rates = the number of positive samples of influenza virus test/the number of test samples × 100%.
Fig. 2
Fig. 2. Observed seasonal influenza activity in mainland China and the US in 2019–2020, compared to estimates by ARIMA models under a counterfactual scenario of no COVID-19 and related interventions.
a Positive rate of influenza tests in Southern China. b Positive rate of influenza tests in Northern China. c Positive rate of influenza tests in the US. d Number (No.) of influenza-like cases reported in Southern China. e No. of influenza-like cases reported in Northern China. Lower and upper bounds of estimates are provided. The pink vertical dashed lines indicate when China (a, b and d, e) first identified SARS-CoV-2 and the US (c) first reported case of COVID-19. The red vertical dashed lines indicate the start of the lockdown in Wuhan, January 23, 2020. The orange vertical dashed line indicates the declaration of a national emergency by the US on March 13, 2020.
Fig. 3
Fig. 3. Potential impact of COVID-19 outbreaks and interventions on seasonal influenza intensities in mainland China and the US, 2019–2020.
ac Comparisons of observed influenza activities with the upper bounds predicted with 2011–2019 expectations under a counterfactual scenario of no COVID-19 outbreaks and related interventions in Southern China (a), Northern China (b), and the US (c). df Comparisons of observed influenza activities with the upper bounds of estimates under the counterfactual scenario in Southern China (d), Northern China (e), and the US (f). The pink vertical dashed lines indicate when China identified SARS-CoV-2 and the US first reported cases of COVID-19. The red vertical dashed lines indicate the start of the lockdown in Wuhan, January 23, 2020. The orange vertical dashed lines indicate the declaration of a national emergency by the US on March 13, 2020. Potentially prevented in influenza activity = (area under the predicted epidemic curve without COVID-19 outbreaks and NPIs − area under the observed epidemic curve)/area under the predicted epidemic curve without COVID-19 outbreaks and NPIs × 100%.
Fig. 4
Fig. 4. Observed, fitted, and predicted influenza test positivity rate from 2011 to 2020.
a Southern China. b Northern China. c The US. The blue shaded parts indicate the estimates under normal seasonal influenza activities and shows 95% confidence intervals of estimates.

References

    1. World Health Organization. Timeline: WHO’s COVID-19 Response (accessed 20 December 2020); https://www.who.int/emergencies/diseases/novel-coronavirus-2019/interact....
    1. The Novel Coronavirus Pneumonia Emergency Response Epidemiology Team. The epidemiological characteristics of an outbreak of 2019 Novel Coronavirus Diseases (COVID-19)—China, 2020. China CDC Wkly. 2020;2:113–122. doi: 10.46234/ccdcw2020.032. - DOI - PMC - PubMed
    1. Tan W, et al. A novel coronavirus genome identified in a cluster of pneumonia cases—Wuhan, China 2019−2020. China CDC Wkly. 2020;2:61–62. doi: 10.46234/ccdcw2020.017. - DOI - PMC - PubMed
    1. Yang J, et al. Disease burden and clinical severity of the first pandemic wave of COVID-19 in Wuhan, China. Nat. Commun. 2020;11:5411. doi: 10.1038/s41467-020-19238-2. - DOI - PMC - PubMed
    1. Zhu N, et al. A novel coronavirus from patients with pneumonia in China, 2019. N. Engl. J. Med. 2020;382:727–733. doi: 10.1056/NEJMoa2001017. - DOI - PMC - PubMed

Publication types

MeSH terms