. 2021 May 31;12(1):3258.
doi: 10.1038/s41467-021-23539-5.

Model-based analysis uncovers mutations altering autophagy selectivity in human cancer

Affiliations

Model-based analysis uncovers mutations altering autophagy selectivity in human cancer

Zhu Han et al. Nat Commun. .

Abstract

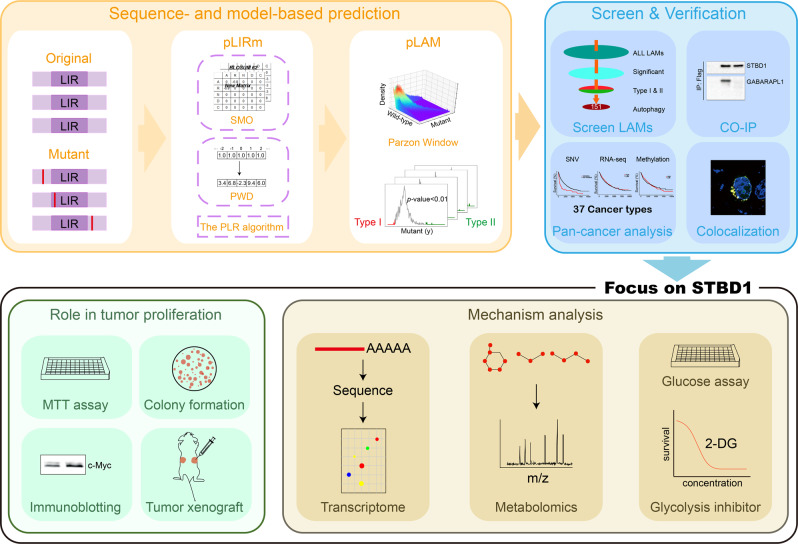
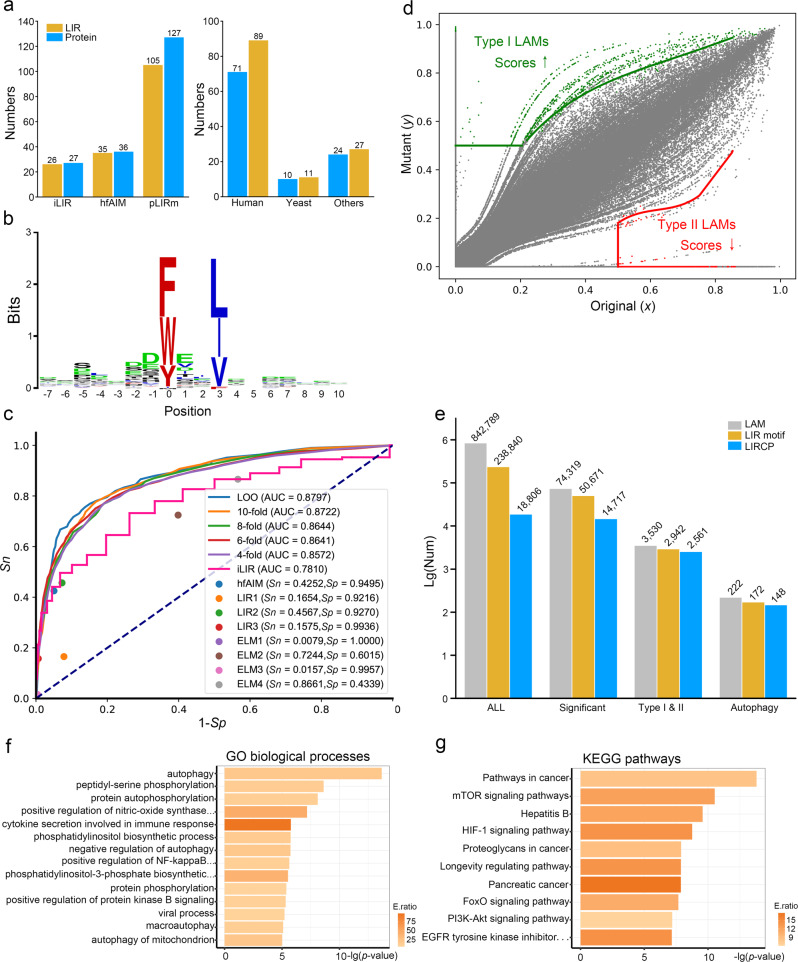
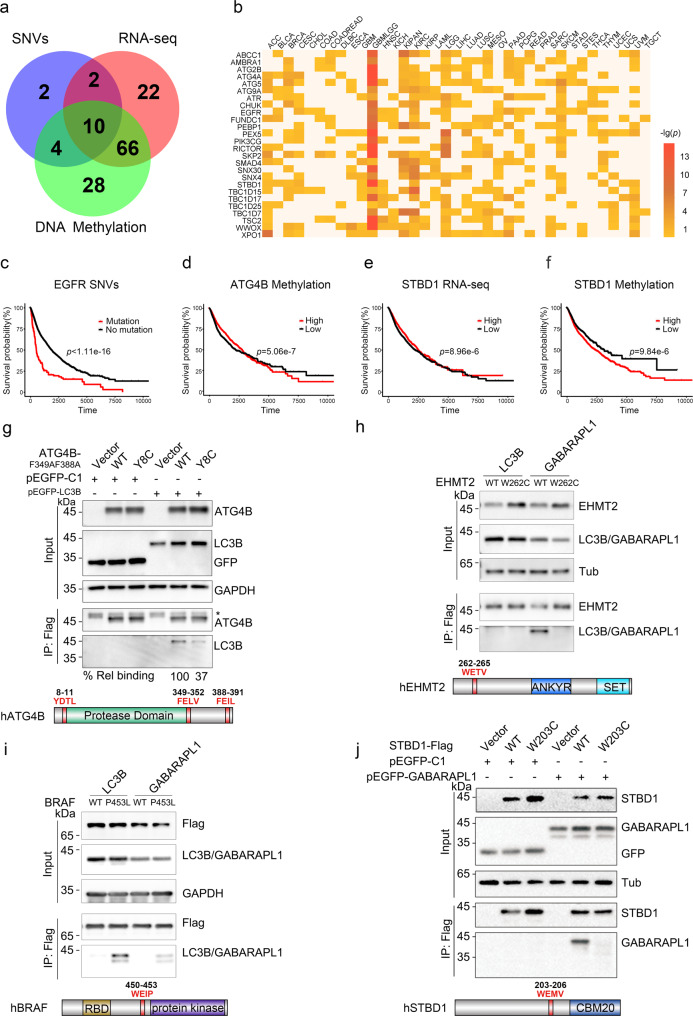
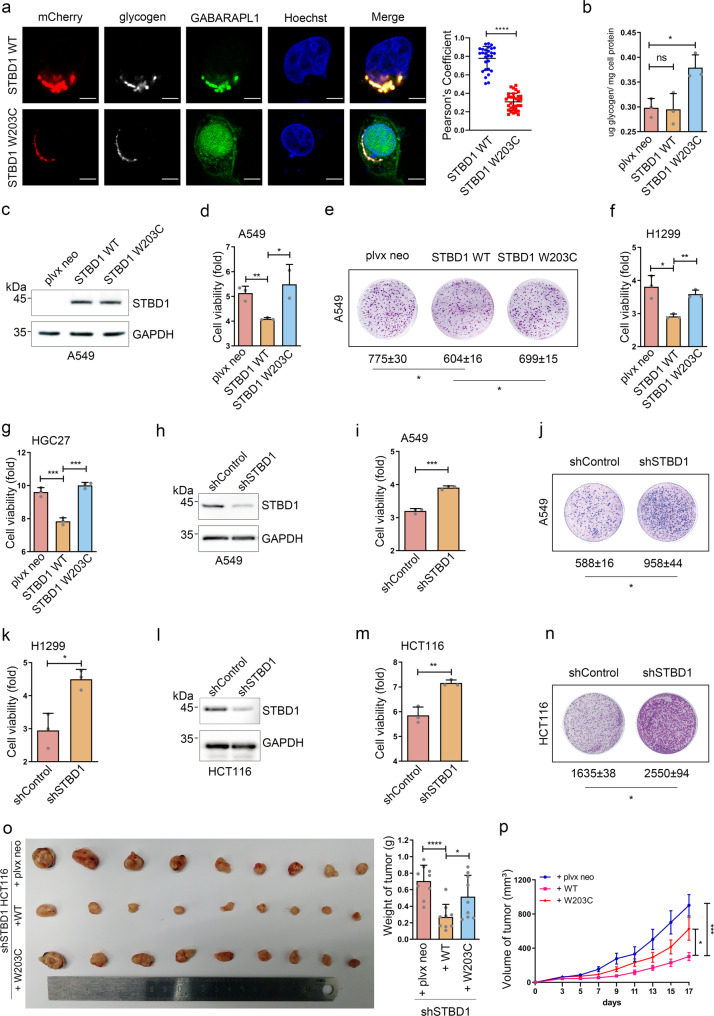
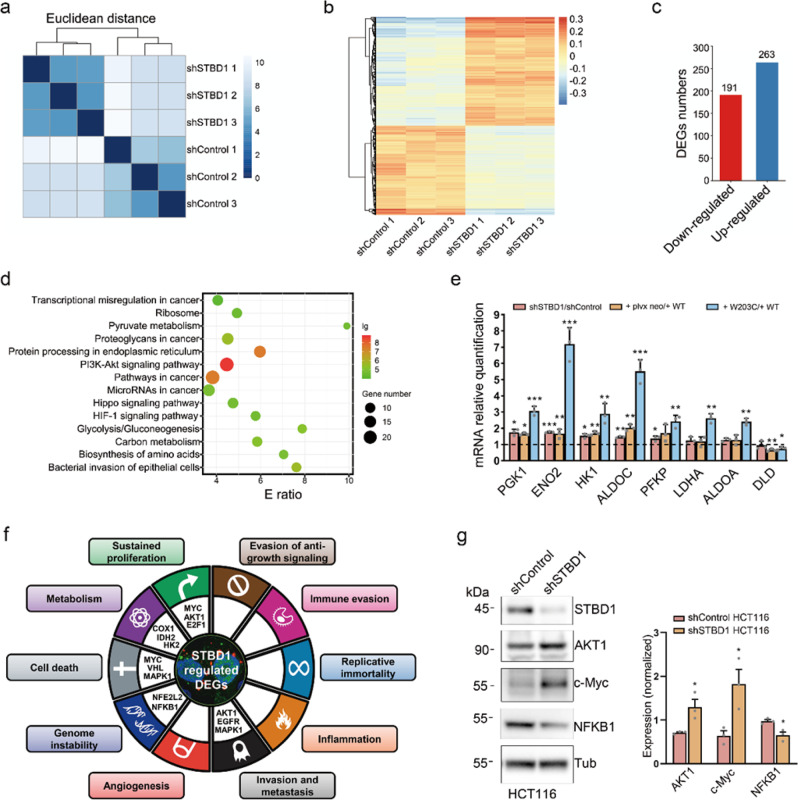
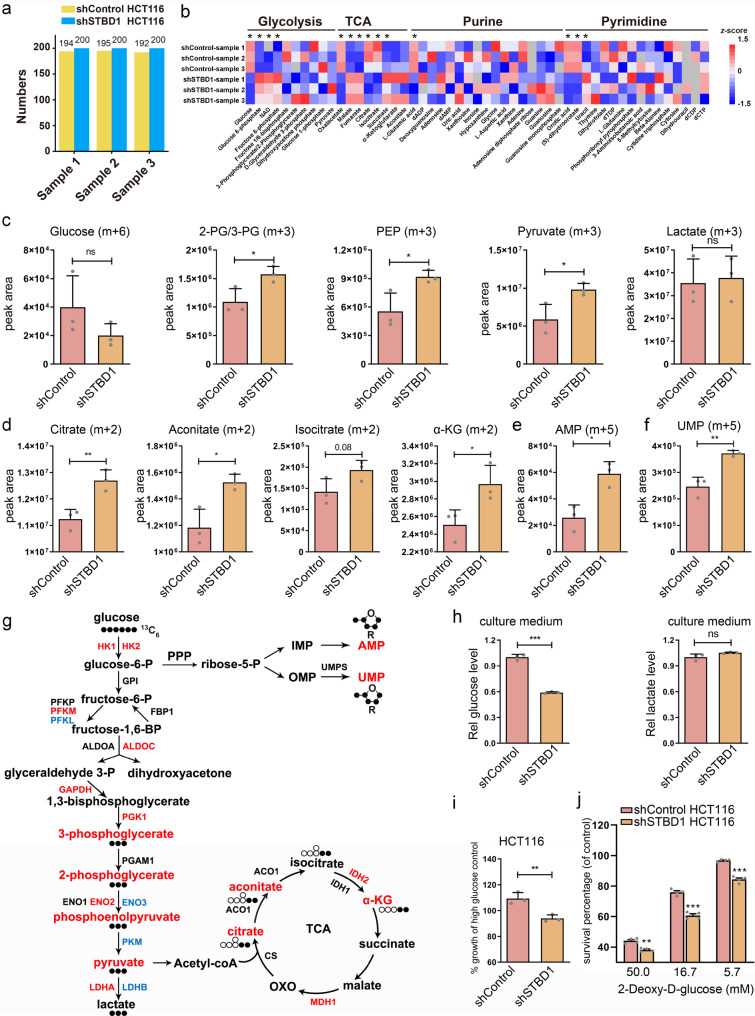
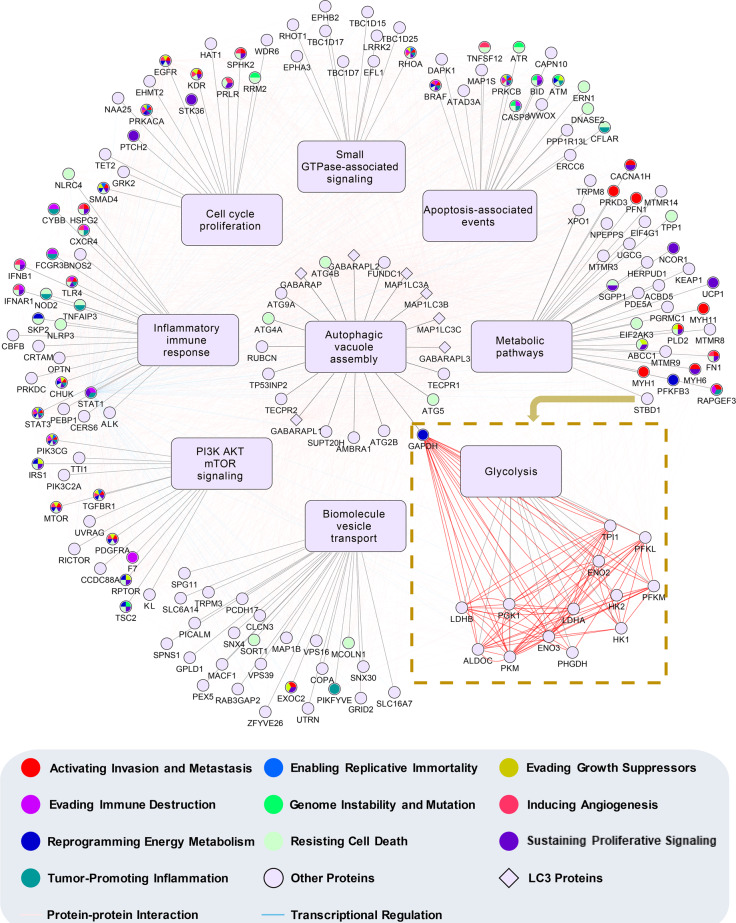
Autophagy can selectively target protein aggregates, pathogens, and dysfunctional organelles for the lysosomal degradation. Aberrant regulation of autophagy promotes tumorigenesis, while it is far less clear whether and how tumor-specific alterations result in autophagic aberrance. To form a link between aberrant autophagy selectivity and human cancer, we establish a computational pipeline and prioritize 222 potential LIR (LC3-interacting region) motif-associated mutations (LAMs) in 148 proteins. We validate LAMs in multiple proteins including ATG4B, STBD1, EHMT2 and BRAF that impair their interactions with LC3 and autophagy activities. Using a combination of transcriptomic, metabolomic and additional experimental assays, we show that STBD1, a poorly-characterized protein, inhibits tumor growth via modulating glycogen autophagy, while a patient-derived W203C mutation on LIR abolishes its cancer inhibitory function. This work suggests that altered autophagy selectivity is a frequently-used mechanism by cancer cells to survive during various stresses, and provides a framework to discover additional autophagy-related pathways that influence carcinogenesis.


Conflict of interest statement

The authors declare no competing interests.

Figures

Fig. 1
Fig. 1. Major steps of iCAL.
i Design a sequence-based predictor, pLIRm, and develop a model-based approach, pLAM; ii computational prioritization of potential LAMs that significantly influence cLIR motifs, and then pan-cancer analysis and experimental validation of predicted LAM-containing LIRCPs; iii combine transcriptomics, metabolomics with additional experimental assays to study the role and mechanism of STBD1 in tumor proliferation; Co-IP co-immunoprecipitation.
Fig. 2
Fig. 2. Computational prioritization of highly potential LAM-containing LIRCPs.
a A comparison of known LIR motifs and corresponding proteins collected by iLIR, hfAIM, and pLIRm, as well as the distribution of our collected data in H. sapiens and S. cerevisiae and other species (Supplementary Data 1). b A sequence logo of known LIR motifs was generated by WebLogo (http://weblogo.berkeley.edu/logo.cgi). c A comparison of pLIRm to other methods, including iLIR, hfAIM, three LIR motifs (WXXL, [ADEFGLPRSK][DEGMSTV][WFY][DEILQTV][ADEFHIKLMPSTV][ILV], and [DE][DEST][WFY][DELIV]x[ILV]),,, and four ELM motifs ([EDST].{0,2}[WFY]..P, [EDST].{0,2}[WFY][^RKPG][^PG][ILV], [EDST].{0,2}LVV, and [EDST].{0,2}[WFY]..[ILVFY]). d The model-based algorithm pLAM for predicting Type I and Type II LAMs that potentially increase and decrease the binding affinity of cLIR motifs to LC3, respectively. e The distribution of numbers of potential LAMs, LIR motifs and LIRCPs reserved in each step of pLAM. f, g The GO- and KEGG-based enrichment analyses of finally reserved LAM-containing LIRCPs.
Fig. 3
Fig. 3. LAMs in ATG4B, EHMT2, BRAF, and STBD1 found in cancer patients impair their interactions with ATG8.
a The association of LAM-containing LIRCPs and human cancer at SNV, RNA-seq, and DNA methylation levels. b The expression levels of LAM-containing ATG proteins and autophagy regulators across different cancer types. c Mutated EGFR is associated with a shorter survival rate. d Low DNA methylation level of ATG4B is associated with a longer survival rate. e High mRNA expression level of STBD1 is associated with a longer survival rate. f Low DNA methylation level of STBD1 is associated with a longer survival rate. In cf, significance (p value) is determined by a two-sided log-rank test. g HEK293T cells were co-transfected with Flag-tagged ATG4B wild-type (WT) or Y8C and GFP-tagged LC3B for 24 h. All ATG4B plasmids were made in the F349A/F388A background to minimize the roles of LIR2 and LIR3. Control cells were transfected with an empty vector. One-tenth of the cell lysate was prepared as input, and the rest was used for immunoprecipitation with anti-Flag Sepharose 4B gel followed by immunoblotting with indicated antibodies. The band of LC3B was quantified by Image J and normalized to the level of ATG4B WT, and labeled below the blots. Schematic representation of human ATG4B with red fonts indicating the LIR motif. *IgG heavy chain. h, i HEK293T cells were co-transfected with Flag-tagged EHMT2 (160–360 aa) or BRAF and GFP-tagged LC3B or GABARAPL1 for 24 h. Control cells (vector) were transfected with an empty vector. One-tenth of the cell lysate was prepared as input, and the rest was used for immunoprecipitation (IP) with anti-Flag Sepharose 4B gel followed by immunoblotting with indicated antibodies. Schematic representation of human EHMT2 and BRAF with red fonts indicating the LIR motif. j HEK293T cells were co-transfected with Flag-tagged STBD1 WT or W203C and GFP-tagged GABARAPL1 for 24 h. Control cells (vector) were transfected with an empty vector. One-tenth of the cell lysate was prepared as input, and the rest was used for immunoprecipitation with anti-Flag Sepharose 4B gel followed by immunoblotting with indicated antibodies. Schematic representation of human STBD1 with red fonts indicating the LIR motif. Experiments gj were performed in triplicate.
Fig. 4
Fig. 4. STBD1 inhibits tumor growth in vitro and in vivo.
a Confocal immunofluorescence of HeLa cells co-transfected with mCherry-STBD1 WT or W203C, and GFP-tagged GABARAPL1 for 24 h. Glycogen was stained anti-glycogen monoclonal antibody IV58B6 (white) with Nuclei was stained with Hoechst (blue). Images were captured using the Olympus FV-1000. Pearson’s coefficients of glycogen and GABARAPL1 were calculated using image J. Each dot represents the value of one cell. Scale bar, 20 μm. b The glycogen content of HCT116 cells stably expressing plvx neo, STBD1 WT or STBD1 W203C, respectively, was assessed using a glycogen assay kit. c Control A549 cells (plvx neo) and A549 cells stably overexpressing STBD1 WT or W203C were lysed for immunoblotting to determine the protein levels of STBD1 and GAPDH. d Control A549 cells (plvx neo) and A549 cells stably overexpressing STBD1 WT or STBD1 W203C were cultured for 72 h. The cell viability was assessed using the MTT assay and normalized to that of 0 h. e Control A549 cells (plvx neo) and A549 cells stably overexpressing STBD1 WT or STBD1 W203C were cultured for 20 days, then stained by crystal violet. The number of colonies was analyzed using Image J. f, g Control H1299/HGC27 cells (plvx neo) and H1299/HGC27 cells stably expressing STBD1 WT or W203C were cultured for 72 h. Cell viability was then assessed using the MTT assay and normalized to that of 0 h. h The protein levels of STBD1 in shControl (control shRNA) and shSTBD1 A549 cells were determined by immunoblotting. i shControl (control shRNA) and shSTBD1 A549 cells were cultured for 72 h. The cell viability was then assessed using the MTT assay and normalized to that of 0 h. j shControl and shSTBD1 A549 cells were cultured for 20 days, then stained by crystal violet. The number of colonies was analyzed using Image J. k shControl and shSTBD1 H1299 cells were cultured for 72 h. The cell viability was then assessed using the MTT assay and normalized to that of 0 h. l The protein levels of STBD1 in shControl and shSTBD1 HCT116 cells were determined by immunoblotting. m shControl and shSTBD1 HCT116 cells were cultured for 72 h. The cell viability was then assessed using the MTT assay and normalized to that of 0 h. n shControl and shSTBD1 HCT116 cells were cultured for 20 days, then stained by crystal violet. The number of colonies was analyzed using Image J. o Nude mice (n = 9) were injected subcutaneously on the back of the neck or both flanks with shSTBD1/plvx neo, shSTBD1/WT, or shSTBD1/W203C HCT116 cells, respectively. Images show the dissected tumors and tumor weights 17 days after injection. p Tumor volume was measured over time after injection in mice as in (o). Experiments in an were performed in triplicate. ap Statistical data are presented as mean ± SD. Statistical comparisons were performed using an unpaired t test. ****p < 0.0001, ***p < 0.001, **p < 0.01, *p < 0.05.
Fig. 5
Fig. 5. Depletion of STBD1 alters multiple genes critical for glycolysis.
a Three biological replicates of shControl and shSTBD1 HCT116 cells were clustered together in RNA-seq. b Heatmap of differentially expressed genes in shControl and shSTBD1 HCT116 cells. c The numbers of down-regulated or up-regulated genes in differentially expressed genes. d The KEGG-based enrichment analysis of biological pathway of differentially expressed genes. e mRNA levels of several genes responsible for glycolysis were determined by RT-PCR and normalized using TUBB mRNA. These relative mRNA levels in shSTBD1 vs. shControl HCT116 cells, shSTBD1/W203C vs. shSTBD1/WT cells, and shSTBD1/WT vs. shSTBD1/plvx neo cells were shown. f Enrichment analysis of cancer hallmark traits affected by STBD1 depletion. Representative hallmark genes are shown in the circle. g Protein levels of STBD1, AKT1, c-Myc, and NFKB1 (p50) in shControl and shSTBD1 HCT116 cells were determined by immunoblotting and normalized using Tubulin or GAPDH. Experiments in e, g were performed in triplicate. Statistical data are presented as mean ± SD. Statistical comparisons were performed using an unpaired t test. ***p < 0.001, **p < 0.01, *p < 0.05.
Fig. 6
Fig. 6. Depletion of STBD1 promotes glycolysis in colorectal cancer cells.
a The number of metabolites identified in each sample by targeted metabolomic profiling. Three biological replicates were performed. b Heatmap showing metabolites in several major pathways detected by targeted metabolomic profiling, from shSTBD1 and shControl HCT116 cells, respectively. For each metabolite, its levels in the six samples were normalized using the z-score method. cf shControl and shSTBD1 HCT116 cells were cultured with 13C6-glucose-containing medium for 12 h, and then cells were harvested for analysis by LC–MS/MS. 3-PG 3-phosphoglycerate, 2-PG 2-phosphoglycerate, PEP phosphoenolpyruvate, α-KG α-Ketoglutarate. g Mapping metabolites and genes whose abundance changed significantly in shSTBD1 HCT116 cells vs. shControl HCT116 cells to a pathway map. Metabolites and genes (p < 0.05) were shown. Filled circles, 13C-labeled carbon atoms; open circles, unlabeled carbon atoms; blue, downregulated; red, upregulated. h shControl and shSTBD1 HCT116 cells were cultured for 48 h, and then the medium was collected to determine the concentration of glucose and lactate concentrations. The lactate or glucose concentration was normalized to the total protein concentration, and the relative concentration was further normalized to that of the shControl HCT116 cells. i shControl and shSTBD1 HCT116 cells were cultured in a low glucose medium for 72 h. The cell viability was then assessed using the MTT assay and normalized to that of cells grown in a high glucose medium. j shControl and shSTBD1 HCT116 cells were incubated in indicated concentrations of 2-DG for 48 h. The cell survival rate in each group was evaluated by the MTT assay, and normalized to that of the control group (0 mM). Experiments hj were performed in triplicate. Statistical data are presented as mean ± SD. Statistical comparisons were performed using an unpaired t test. ***p < 0.001, **p < 0.01, *p < 0.05, ns (not significant), p > 0.05.
Fig. 7
Fig. 7. A LIRCP-regulating network that connects autophagy and carcinogenesis.
The 148 LAM-containing ATG proteins and autophagy regulators were classified into nine groups based on their major biological function. Both PPIs and transcriptional regulations were incorporated for these proteins if available. The downstream pathway, glycolysis, and corresponding proteins in the pathway regulated by STBD1 were also integrated.

Comment in

Similar articles

Cited by

References

    1. Levine B, Kroemer G. Biological functions of autophagy genes: a disease perspective. Cell. 2019;176:11–42. doi: 10.1016/j.cell.2018.09.048. - DOI - PMC - PubMed
    1. Rybstein MD, Bravo-San Pedro JM, Kroemer G, Galluzzi L. The autophagic network and cancer. Nat. Cell Biol. 2018;20:243–251. doi: 10.1038/s41556-018-0042-2. - DOI - PubMed
    1. Rabinowitz JD, White E. Autophagy and metabolism. Science. 2010;330:1344–1348. doi: 10.1126/science.1193497. - DOI - PMC - PubMed
    1. Marshall RS, Hua Z, Mali S, McLoughlin F, Vierstra RD. ATG8-binding UIM proteins define a new class of autophagy adaptors and receptors. Cell. 2019;177:e724. doi: 10.1016/j.cell.2019.02.009. - DOI - PMC - PubMed
    1. Alemu EA, et al. ATG8 family proteins act as scaffolds for assembly of the ULK complex: sequence requirements for LC3-interacting region (LIR) motifs. J. Biol. Chem. 2012;287:39275–39290. doi: 10.1074/jbc.M112.378109. - DOI - PMC - PubMed

Publication types

MeSH terms