Investment incentive reduced by climate damages can be restored by optimal policy
- PMID: 34059680
- PMCID: PMC8167106
- DOI: 10.1038/s41467-021-23547-5
Investment incentive reduced by climate damages can be restored by optimal policy
Abstract
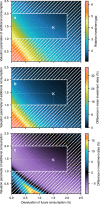
Increasing greenhouse gas emissions are likely to impact not only natural systems but economies worldwide. If these impacts alter future economic development, the financial losses will be significantly higher than the mere direct damages. So far, potentially aggravating investment responses were considered negligible. Here we consistently incorporate an empirically derived temperature-growth relation into the simple integrated assessment model DICE. In this framework we show that, if in the next eight decades varying temperatures impact economic growth as has been observed in the past three decades, income is reduced by ~ 20% compared to an economy unaffected by climate change. Hereof ~ 40% are losses due to growth effects of which ~ 50% result from reduced incentive to invest. This additional income loss arises from a reduced incentive for future investment in anticipation of a reduced return and not from an explicit climate protection policy. Under economically optimal climate-change mitigation, however, optimal investment would only be reduced marginally as mitigation efforts keep returns high.
Conflict of interest statement
The authors declare no competing interests.
Figures


Similar articles
-
Paris Climate Agreement passes the cost-benefit test.Nat Commun. 2020 Jan 27;11(1):110. doi: 10.1038/s41467-019-13961-1. Nat Commun. 2020. PMID: 31988294 Free PMC article.
-
Health co-benefits from air pollution and mitigation costs of the Paris Agreement: a modelling study.Lancet Planet Health. 2018 Mar;2(3):e126-e133. doi: 10.1016/S2542-5196(18)30029-9. Epub 2018 Mar 2. Lancet Planet Health. 2018. PMID: 29615227
-
Approximate calculations of the net economic impact of global warming mitigation targets under heightened damage estimates.PLoS One. 2020 Oct 7;15(10):e0239520. doi: 10.1371/journal.pone.0239520. eCollection 2020. PLoS One. 2020. PMID: 33027254 Free PMC article.
-
A comprehensive review of climate change impacts, adaptation, and mitigation on environmental and natural calamities in Pakistan.Environ Monit Assess. 2019 Dec 16;192(1):48. doi: 10.1007/s10661-019-7956-4. Environ Monit Assess. 2019. PMID: 31844992 Review.
-
Global climate change: the quantifiable sustainability challenge.J Air Waste Manag Assoc. 2014 Sep;64(9):979-94. doi: 10.1080/10962247.2014.923351. J Air Waste Manag Assoc. 2014. PMID: 25282995 Review.
Cited by
-
Lessons from COVID-19 for managing transboundary climate risks and building resilience.Clim Risk Manag. 2022;35:100395. doi: 10.1016/j.crm.2022.100395. Epub 2022 Jan 11. Clim Risk Manag. 2022. PMID: 35036298 Free PMC article.
References
-
- Field, C. et al. IPCC, 2014: Climate Change 2014: Impacts, Adaptation, and Vulnerability. Part A: Global and Sectoral Aspects. Contribution of Working Group II to the Fifth Assessment Report of the Intergovernmental Panel on Climate Change (Cambridge University Press, 2014).
-
- Frieler K, et al. Limiting global warming to 2∘ c is unlikely to save most coral reefs. Nat. Clim. Change. 2012;2:1–6. doi: 10.1038/nclimate1355. - DOI
-
- Schellnhuber S, Rahmstorf HJ, Winkelmann R. Why the right climate target was agreed in paris. Nat. Clim. Change. 2016;6:649–653. doi: 10.1038/nclimate3013. - DOI
-
- Burke M, Emerick K. Adaptation to climate change: evidence from us agriculture. Am. Econ. J: Econ. Policy. 2016;8:106–140.
Publication types
LinkOut - more resources
Full Text Sources
Miscellaneous

