. 2021 May 31;12(1):3251.
doi: 10.1038/s41467-021-23224-7.

Locomotor deficits in a mouse model of ALS are paralleled by loss of V1-interneuron connections onto fast motor neurons

Affiliations

Locomotor deficits in a mouse model of ALS are paralleled by loss of V1-interneuron connections onto fast motor neurons

Ilary Allodi et al. Nat Commun. .

Abstract

ALS is characterized by progressive inability to execute movements. Motor neurons innervating fast-twitch muscle-fibers preferentially degenerate. The reason for this differential vulnerability and its consequences on motor output is not known. Here, we uncover that fast motor neurons receive stronger inhibitory synaptic inputs than slow motor neurons, and disease progression in the SOD1G93A mouse model leads to specific loss of inhibitory synapses onto fast motor neurons. Inhibitory V1 interneurons show similar innervation pattern and loss of synapses. Moreover, from postnatal day 63, there is a loss of V1 interneurons in the SOD1G93A mouse. The V1 interneuron degeneration appears before motor neuron death and is paralleled by the development of a specific locomotor deficit affecting speed and limb coordination. This distinct ALS-induced locomotor deficit is phenocopied in wild-type mice but not in SOD1G93A mice after appearing of the locomotor phenotype when V1 spinal interneurons are silenced. Our study identifies a potential source of non-autonomous motor neuronal vulnerability in ALS and links ALS-induced changes in locomotor phenotype to inhibitory V1-interneurons.


Conflict of interest statement

The authors declare no competing interests.

Figures

Fig. 1
Fig. 1. Preferential glycinergic innervation of motor neurons innervating fast-twitch fatigable muscle fibers and loss in a SOD1G93A mouse model.
Microphotographs depicting glycinergic inputs onto MMP9+ fast motor neurons (ac) and ErrBeta+ slow motor neurons (eg) in a GlyT2GFP mouse. Motor neuron somata were selected and synapses were reconstructed for quantifications as shown in the masks in (d) and (h). Quantifications (qr) expressed as synaptic particles and corrected for motor neuron area, show higher synaptic density in MMP9+ motor neurons for both synaptophysin (SYN) (MMP9 = 566 ± 60.75 and ErrBeta  = 417.19 ± 17.5; two-tailed t test, P = 0.0317, t = 2.354, df = 16; N = 9 independent mice) and GlyT2GFP (MMP9 = 274.4 ± 29.25 and ErrBeta = 142.75 ± 39.77; two-tailed t test, P = 0.0008, t = 4.100, df = 16; N = 9 independent mice) markers. Innervation of fast (ik) and slow (mo) motor neurons in GlyT2GFP mice crossed with SOD1G93A mice at postnatal day (P) 63 and their respective synaptic densities (l, p). Quantifications of synaptic density were performed at P45, P63, and P84 for SYN (s) and GlyT2GFP (t) markers. MMP9+ motor neurons showed progressive reduction of SYN+ (one-way ANOVA and Dunnett’s post hoc, F(3,14) = 7.004, P45 P = 0.6992, P63 P = 0.0382, P84 P = 0.0027; N = 3 independent mice per timepoint) and GlyT2GFP+ inputs (one-way ANOVA and Dunnett’s post hoc, F(3, 14) = 16.742, P45 P = 0.0121, P63 P = 0.0015, P84  P= 0.00007; N = 3 independent mice per timepoint) when compared with ErrBeta+ motor neurons (SYN + one-way ANOVA and Dunnett’s post hoc, F(3, 14) = 2.224, P45 P = 0.7919, P63 P = 0.1285, P84 P = 0.9495; N = 3 independent mice per timepoint) (GlyT2GFP+ one-way ANOVA and Dunnett’s post hoc, F(3, 14) = 2.732, P45 P = 0.057, P63 P = 0.9999, P84 P = 0.9694; N = 3 independent mice per timepoint). MMP9 (a, i) or ErrBeta (e, m) in blue, SYN (c, g, k, o) in red and GlyT2GFP (b, f, j, n) in green. Scale bar in (o) =50 μm representative for all images. A minimum of 200 motor neurons was quantified per condition. In all graphs, data are presented as mean values ± SEM. Source data are provided as a Source Data file.
Fig. 2
Fig. 2. Neuromuscular junction (NMJ) innervation assessment in the fast-twitch fatigable Tibialis Anterior (TA) (c) and Gastrocnemius (GN) (d) muscles and in the slow-twitch Soleus (SOL) (e) muscle. a Weights of the SOD1G93A mice included in the study and used for comparison with the multiple crossing conditions.
Differences in weights are observed from postnatal day 90 (two-tailed multiple t tests, P90 P = 0.00008, t = 4.773, df = 24; P120 P = 0.0000003, t = 7.125, df = 23; P140 P = 0.0012, t = 5.713, df = 6; N = 15 independent mice per condition). NMJ were categorized either as fully innervated, shown by + in (b), or as partially innervated, shown as * in (b), or as empty, shown as # in (b). Significant denervation in TA (c) (one-way ANOVA and Dunnett’s post hoc, F(3, 12) = 9.767, P63 P = 0.0200, P84 P = 0.0005) and GN (d) was in P63 mice (one-way ANOVA and Dunnett’s post hoc, F(3, 12) = 19.36, P63 P = 0.0003, P84 P = 0.0001). e In SOL, significant denervation was much later starting from P84 (one-way ANOVA and Dunnett’s post hoc, F(3, 12) = 20.82, P84 P = 0.00005) (wt N = 8, SOD1G93A P45 N = 3, P63 N = 4, P84 N = 4 independent mice). Scale bar in (b) =50 μm. A minimum of 800 NMJs were analyzed per condition. In all graphs, data are presented as mean values ± SEM. Source data are provided as a Source Data file.
Fig. 3
Fig. 3. Fast motor neurons receive stronger V1 interneuron innervation than slow motor neurons and V1 synapses are lost in the SOD1G93A mouse model.
a Experimental approach: an AAV-phSyn1(S)-FLEX-tdTomato-T2A-SypEGFP-WPRE virus was delivered by intraspinal injections in En1cre or SOD1G93A;En1cre mice at P42. b In En1cre mice, MMP9+ fast motor neurons were found to receive more inputs than ErrBeta+ slow motor neurons (MMP9 = 49.2 ± 11.4 and ErrBeta = 33.2 ± 9; two-tailed t test, P = 0.0401, t = 2.447, df = 8; N = 5 independent mice per condition). Synaptic terminals are GFP+ while En1cre interneurons are TdTomato+ (c, e, h, j). Synaptic density analysis performed on fast motor neurons in En1cre (c) and SOD1G93A;En1cre mice (e); masks are shown in (d) and (f), respectively. Percentage of synaptic density (g) in MMP9+ motor neurons revealed a dramatic reduction in GFP+ terminals in SOD1G93A compared to control conditions (two-tailed t test, P= 0.00005, t = 7.783, df = 8; N = 5 independent mice per condition). ErrBeta+ motor neurons were analyzed in En1cre (h) and SOD1G93A;En1cre mice (j), and synaptic density was reconstructed (i, k) and quantified (l). Percentage of synaptic density in slow motor neurons showed also a reduction in GFP+ terminals in ALS mice (two-tailed t test, P = 0.0245, t = 2.764, df = 8; N = 5 independent mice per condition). TdTomato in red, GFP in green and MMP9 (c, e) or ErrBeta (h, j) in blue. Scale bar in (j) =50 μm representative for all images. A minimum of 300 motor neurons was quantified per condition. In all graphs, data are presented as mean values ± SEM. Source data are provided as a Source Data file.
Fig. 4
Fig. 4. En1 positive neuron reduction from postnatal day 63 in the SOD1G93A mouse.
a Microphotograph of a wild-type mouse hemicord after RNAscope in situ hybridization at postnatal day 63. Chat in green, En1 in orange and DAPI in blue. b Magnification of Chat and En1 expression in control conditions and c at P63 in a SOD1G93A mouse. d Quantifications of En1 positive neurons in control conditions versus postnatal day 45, 63, and 84 in the ALS mouse model. There was a reduction at P63 to about 75% and to about 68% at P84 compared to age-matching wild-types (one-way ANOVA and Dunnett’s post hoc, F(3, 14) = 13.45, P45 P = 0.3108, P63 P = 0.0010, P84 P = 0.0003; wt N =9, SOD1G93A N = 3 mice per timepoint). e Intensity-measurements of En1 positive dots present within the quantified neurons showed no differences among the different timepoints, indicating that En1 neurons still present in the SOD1G93A mouse do not show lower transcript expression at these than earlier timepoints (two-way ANOVA and Tukey’s multiple comparisons test, F(2, 12) = 0.02754, P45 P = 0.9990, P63 P = 0.9998, P84 P = 1; N = 3 independent mice per condition per timepoint). Scale bar in (a) =200 μm, scale bar in (c) =50 μm representative also for (b). A minimum of 60 pictures (as shown in (bc)) was quantified per condition. In all graphs, data are presented as mean values ± SEM. Source data are provided as a Source Data file.
Fig. 5
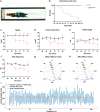
Fig. 5. SOD1G93A mice between postnatal day 49 and 63 show locomotor deficits.
a Example of tracking approach performed on recorded videos with DeepLabCut analysis tool. Colored circles show digital markers placed on the animals to extrapolate tracks for analysis. b Performance of wild-type (wt) and SOD1G93A mice on treadmill at a speed of 20 cm/s. Percentage shows that between P49 and P63 46.2% of the SOD1G93A mice cannot perform the task (median = 77; two-tailed Gehan–Breslow–Wilcoxon test, P = 0.0003, Chi square = 12.92, df = 1; N = 11 independent mice per condition). At a longitudinal time scale, mice show a progressive reduction of speed (two-way ANOVA and Dunnett’s post hoc, F(5, 105) = 3.020, P63 P = 0.0060, P70 P = 0.0085, P77 P = 0.0027, P84 P = 0.00009; wt N = 8 mice, SOD1G93A N =15 mice) compared to control mice (c) as well as a progressive reduction in peak acceleration (d) (two-way ANOVA and Dunnett’s post hoc, F(5, 126) = 0.9761, P84 P = 0.0468; wt N = 8 mice, SOD1G93A N =15 mice), stride length (e) (two-way ANOVA and Dunnett’s post hoc, F(5, 105) = 1.441, P = 0.2157; wt N = 8 mice, SOD1G93A N = 15 mice) and step frequency (f) (two-way ANOVA and Dunnett’s post hoc, F(5, 105) = 1.951, P84 P = 0.0167; wt N =8 mice, SOD1G93A N = 15 mice) when compared to wild-type mice. Hindlimb left-right alternation was compared before (g) and after (h) Onset of locomotor phenotype. Blue dots represent single steps of a given animal before and after onset. Gray arrows depict mean vectors of the average direction of all steps. Phase values at 180 degrees correspond to strict alternation. Stride analysis in (i) shows the out of phase pattern of the hindlimbs during locomotion which was extracted for coordination analysis. In all graphs, data are presented as mean values ± SEM. Source data are provided as a Source Data file.
Fig. 6
Fig. 6. Characterization of the Onset of locomotor phenotype.
Performance of SOD1G93A mice before and after Onset of locomotor phenotype is characterized by loss of speed (a) (two-tailed t test, P = 0.00008, t = 6.350, df = 10; N = 11 mice), reduction in peak acceleration (b) (two-tailed t test, P = 0.0118, t = 3.072, df = 10; N = 11 mice), decrease in stride length (c) (two-tailed t test, P = 0.0036, t = 3.779, df = 10; N = 11 mice) and step frequency (d) (two-tailed t test, P = 0.0004, t = 5.273, df = 10; N = 11 mice). Moreover, SOD1G93A mice showed increased dragging events when trying to cope with the speed of the belt, drag counts in (e) (two-tailed t test, P =0.0196, t = 2.776, df = 10; N = 11 mice) and drag duration in (f) (two-tailed t test, P =0.0068, t = 3.395, df = 10; N = 11 independent mice). Dotted lines show averages for wild-type (wt) mice in all parameters included in the analysis. g Quantifications of left-right alternation showed as circular plots. Perfect alternation corresponds to a phase of 180 degrees. Data from individual animals are plotted for each condition (orange-empty SOD1 pre-symptomatic, orange-full SOD1 onset, black wild-type). The mean vectors for each condition are represented in the respective colors. There is no difference in the mean phase for the different conditions (two-tailed Watson–Williams test, SOD1G93A pre-symptomatic vs SOD1G93A onset P = 0.1582; wt vs SOD1G93A pre-symptomatic P = 0.1004; wt vs SOD1G93A onset P = 0.3261; N = 11 mice, n = 15 steps per mouse). h Grip strength shows progressive but late decline of low force performance in the SOD1G93A starting from P90 (one-way ANOVA and Dunnett’s post hoc, F (4, 27) = 45.89, P90 P = 0.00009, P120 P = 0.00009, P140 P = 0.00009; P45 N = 4, N = 7 mice for all other timepoints). In all graphs, data are presented as mean values ± SEM. Source data are provided as a Source Data file.
Fig. 7
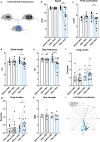
Fig. 7. Dampening of spinal V1 interneuron activity recapitulates the Onset of locomotor phenotype.
a Mouse genetic approach used to express inhibitory DREADDs specifically in En1+ spinal interneurons. En1cre mouse strain was crossed with HoxB8FlipO;RC::FPDi animals. After CNO administration, En1cre;HoxB8FlipO;RC::Di mice (blue bars) show loss of locomotor speed b compared to their performance before administration of CNO (one-way ANOVA and Sidak’s post hoc, F(3, 38) = 7.058, P = 0.0005; controls N = 9 mice, En1cre;HoxB8FlipO;RC::Di N = 12 mice). Dual conditional mice also showed decrease of peak acceleration (c) (one-way ANOVA and Sidak’s post hoc, F(3, 38) = 3.792, P = 0.0064; controls N = 9 mice, En1cre;HoxB8FlipO;RC::Di N = 12 mice) and reduction in stride length (d) (one-way ANOVA and Sidak’s post hoc, F(3, 38) = 2.137, P = 0.0355; controls N = 9 mice, En1cre;HoxB8FlipO;RC::Di N = 12 mice) and step frequency (e) (one-way ANOVA and Sidak’s post hoc, F(3, 38) = 6.148, P = 0.0013; controls N = 9 mice, En1cre;HoxB8FlipO;RC::Di N = 12 mice). Mice also showed increased dragging duration (one-way ANOVA and Sidak’s post hoc, F(3, 38) = 2.625, P = 0.0416; controls N = 9 mice, En1cre;HoxB8FlipO;RC::Di N = 12 mice) (g), although they did not show an increased number of drags (f) (one-way ANOVA and Sidak’s post hoc, F(3, 38) = 1.436, P = 0.2578; controls N = 9 mice, En1cre;HoxB8FlipO;RC::Di N = 12 mice). Grip strength remained unchanged before and after CNO administration (h) (one-way ANOVA and Sidak’s post hoc, F(3, 18) = 0.2763, P = 0.6486; control N = 4, En1cre;HoxB8FlipO;RC::Di N = 7 mice) as well as left-right alternation (blue-empty = En1cre;HoxB8FlipO;RC::Di before CNO; blue-full  = En1cre;HoxB8FlipO;RC::Di after CNO; black-empty = control before CNO; black-full = control after CNO) (i) (two-tailed Watson–Williams test, P = 0.1294; controls N = 9 mice, En1cre;HoxB8FlipO;RC::Di N = 12 mice, n = 15 steps per mouse). CNO administration did not have any effect on control animals (black bars and black arrows; N = 9 mice). In all graphs, data are presented as mean values ± SEM. Source data are provided as a Source Data file.
Fig. 8
Fig. 8. Ankle and knee joints show hyperflexion in SOD1G93A mice and after silencing of En1 positive neurons.
a Photograph showing the lateral view of a mouse analyzed with DeepLabCut tracking software. Dots mark iliac crest, hip, knee, ankle, foot and toe. Stick figures depicting the relative position of the analyzed joints in wild-type (b) and in SOD1G93A mice after Onset of locomotor phenotype (c) during a complete step cycle, stance phase in gray. Stick figures of En1cre;HoxB8FlipO; RC::Di mice before (d) and after (e) CNO treatment show similar changes in hyperflexion of the ankle and knee joints as in the SOD1G93A mice after onset. Quantification of the changes in angles of hip in wild-type versus SOD1G93A conditions (fg, j) show no differences (two-tailed t test, P = 0.2059, t = 1.344, df = 11), while knee (lm, p) (two-tailed t test, P = 0.0196, t = 2.729, df = 11), ankle (rs, v) (two-tailed t test, P = 0.0483, t = 2.221, df = 11) and foot (xy; ab) (two-tailed t test, P = 0.0052, t = 3.469, df = 11) are significantly different between the two conditions (wt N = 8 mice, SOD1G93A N = 5 mice). Quantifications of the joint angles after CNO administration mimics the SOD1G93A mice after onset. While no changes were observed in the hip angle (hi, k) (two-tailed t test, P = 0.7901, t = 0.2722, df = 12) angles of knee (no, q) (two-tailed t test, P = 0.0212, t = 2.650, df = 12), ankle (tu; w) (two-tailed t test, P = 0.0140, t = 2.873, df = 12) and foot (z-aa; ac) (two-tailed t test, P = 0.0071, t = 3.239, df = 12) were significantly different before and after CNO treatment (En1cre;HoxB8FlipO;RC::Di N = 7 independent mice). In all graphs, data are presented as mean values ± SEM. Error bands in (fi), (lo), (ru) and (s-aa) represent SD. Source data are provided as a Source Data file.
Fig. 9
Fig. 9. Dampening of spinal V1 interneuron activity does not have an effect in SOD1G93A mice after Onset of locomotor phenotype.
a Mouse crossing utilized to assess specific spinal V1 interneuron silencing in a SOD1G93A mouse model. SOD1G93A;En1cre mice were crossed with HoxB8FlipO;RC::FPDi. SOD1G93A mice that did not carry the intersectional expression were used as controls. After CNO administration quadruple transgenics (magenta bars) did not show changes in speed (b) (one-way ANOVA and Sidak’s post hoc, F(3, 18) = 0.02417, P = 0.9977; control N = 7 independent mice, quadruple transgenics N = 4 independent mice) nor in peak acceleration (c) (one-way ANOVA and Sidak’s post hoc, F(3, 18) = 0.08636, P = 0.9982; control N = 7 mice, quadruple transgenics N = 4 mice). Also stride length (d) (one-way ANOVA and Sidak’s post hoc, F(3, 18) = 1.211, P = 0.5915; control N = 7 mice, quadruple transgenics N = 4 mice) and step frequency (e) remained unchanged (one-way ANOVA and Sidak’s post hoc, F(3, 18) = 0.02689, P = 0.9602; control N = 7 mice, quadruple transgenics N = 4 mice). SOD1G93A;En1cre;HoxB8FlipO;RC::Di mice did not show more dragging events (fg) after CNO administration (drag counts one-way ANOVA and Sidak’s post hoc, F(3, 18) = 1.914, P = 0.4302; drag duration one-way ANOVA and Sidak’s post hoc, F(3, 18) = 1.839, P = 0.5068; control N = 7 mice, quadruple transgenics N = 4 mice). h CNO administration did not have any effects on grip strength in SOD1G93A;En1cre;HoxB8FlipO;RC::Di mice (one-way ANOVA and Sidak’s post hoc, F(3, 18) = 0.1216, P = 0.9380; control N = 7 mice, quadruple transgenics N = 4 mice). SOD1G93A not carrying dual intersectional expression did not show any changes after CNO administration (orange bars). Dotted lines show averages for wild-type (wt) animals in all parameters included in the analysis. i Left-right alternation remained unaltered after CNO administration in both SOD1G93A;En1cre;HoxB8FlipO;RC::Di mice and SOD1G93A controls (two-tailed Watson–Williams test, P = 0.3682; n = 15 independent steps per mouse). In all graphs, data are presented as mean values ± SEM. Source data are provided as a Source Data file.

References

    1. Kanning KC, Kaplan A, Henderson CE. Motor neuron diversity in development and disease. Annu. Rev. Neurosci. 2010;33:409–440. doi: 10.1146/annurev.neuro.051508.135722. - DOI - PubMed
    1. Nijssen J, Comley LH, Hedlund E. Motor neuron vulnerability and resistance in amyotrophic lateral sclerosis. Acta Neuropathol. 2017;133:863–885. doi: 10.1007/s00401-017-1708-8. - DOI - PMC - PubMed
    1. Pun S, Santos AF, Saxena S, Xu L, Caroni P. Selective vulnerability and pruning of phasic motoneuron axons in motoneuron disease alleviated by CNTF. Nat. Neurosci. 2006;9:408–419. doi: 10.1038/nn1653. - DOI - PubMed
    1. Hegedus J, Putman CT, Gordon T. Time course of preferential motor unit loss in the SOD1 G93A mouse model of amyotrophic lateral sclerosis. Neurobiol. Dis. 2007;28:154–164. doi: 10.1016/j.nbd.2007.07.003. - DOI - PubMed
    1. Frey D, et al. Early and selective loss of neuromuscular synapse subtypes with low sprouting competence in motoneuron diseases. J. Neurosci. 2000;20:2534–2542. doi: 10.1523/JNEUROSCI.20-07-02534.2000. - DOI - PMC - PubMed

Publication types

MeSH terms