. 2021 May 31;11(1):11376.
doi: 10.1038/s41598-021-89765-5.

High glucose induced c-Met activation promotes aggressive phenotype and regulates expression of glucose metabolism genes in HCC cells

Affiliations

High glucose induced c-Met activation promotes aggressive phenotype and regulates expression of glucose metabolism genes in HCC cells

Hande Topel et al. Sci Rep. .

Abstract

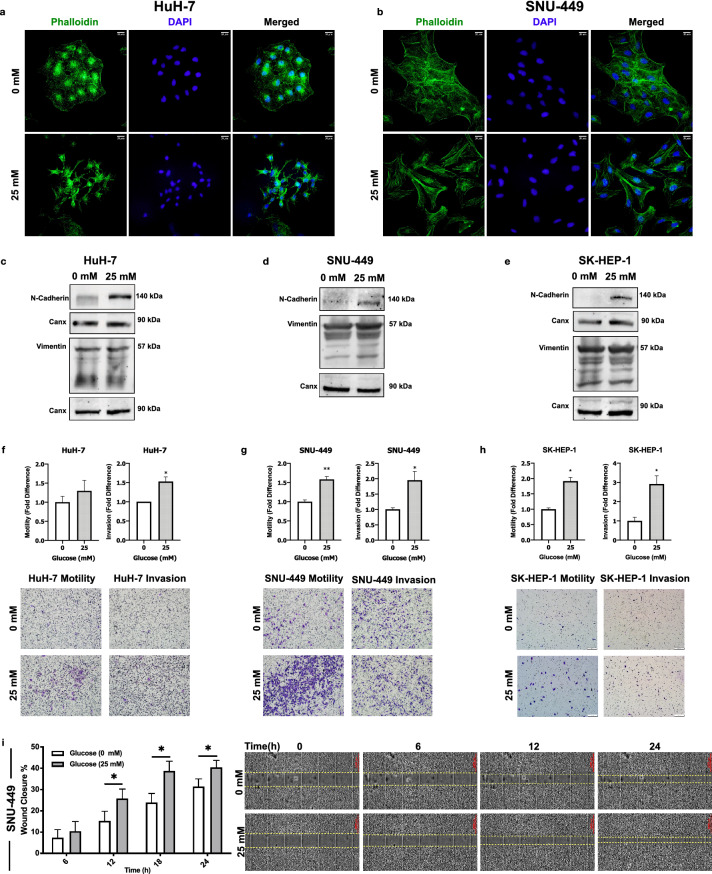
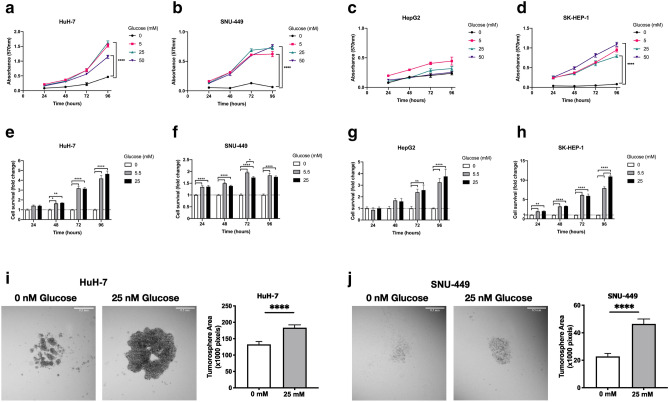
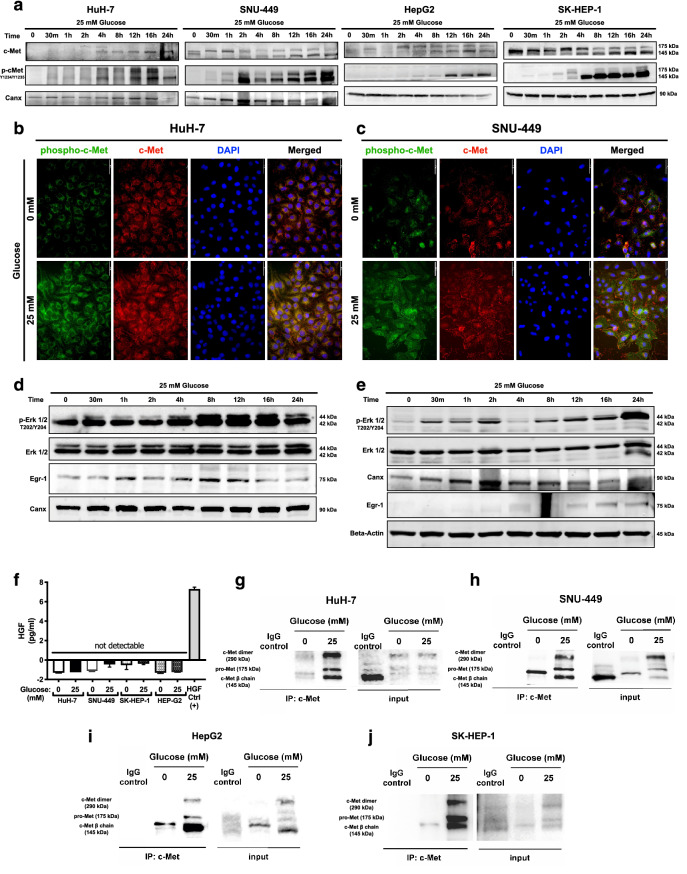
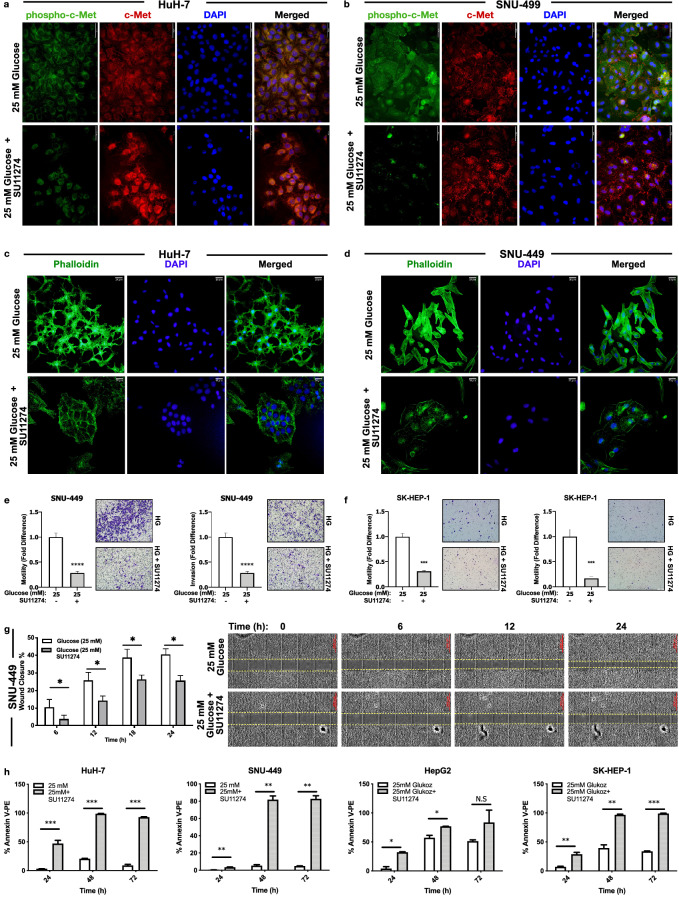
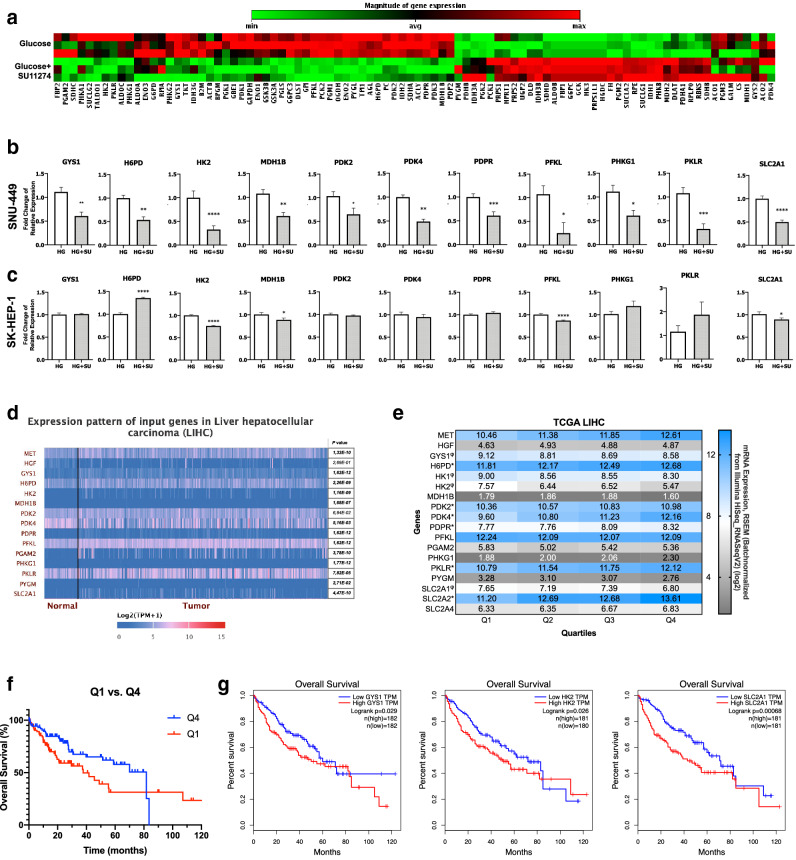
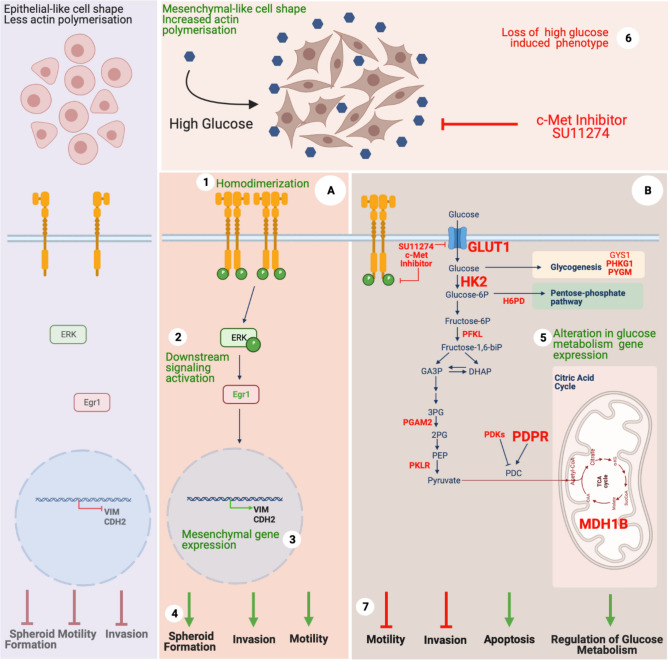
Hepatocellular carcinoma (HCC) is strongly associated with metabolic dysregulations/deregulations and hyperglycemia is a common metabolic disturbance in metabolic diseases. Hyperglycemia is defined to promote epithelial to mesenchymal transition (EMT) of cancer cells in various cancers but its molecular contribution to HCC progression and aggressiveness is relatively unclear. In this study, we analyzed the molecular mechanisms behind the hyperglycemia-induced EMT in HCC cell lines. Here, we report that high glucose promotes EMT through activating c-Met receptor tyrosine kinase via promoting its ligand-independent homodimerization. c-Met activation is critical for high glucose induced acquisition of mesenchymal phenotype, survival under high glucose stress and reprogramming of cellular metabolism by modulating glucose metabolism gene expression to promote aggressiveness in HCC cells. The crucial role of c-Met in high glucose induced EMT and aggressiveness may be the potential link between metabolic syndrome-related hepatocarcinogenesis and/or HCC progression. Considering c-Met inhibition in hyperglycemic patients would be an important complementary strategy for therapy that favors sensitization of HCC cells to therapeutics.


Conflict of interest statement

The authors declare no competing interests.

Figures

Figure 1
Figure 1
High glucose promoted mesenchymal phenotype and induced motility and invasion in HCC cell lines. Immunofluorescence imaging of Alexa-488-conjugated Phalloidin labeling of F-actin stress fibrils in (a) HuH-7 and (b) SNU-449 cells in no- and high-glucose (25 mM) supplemented culture conditions. Immunoblotting of cell cytoskeleton EMT biomarkers N-cadherin and Vimentin expressions in (c) HuH-7, (d) SNU-449 and (e) SK-HEP-1 cells. Graphical presentation of fold difference in motility and invasion of (f) HuH-7, (g) SNU-449 and (h) SK-HEP-1 cells cultured in no- and high-glucose supplemented media analyzed by trans-well motility and invasion assays. Graphical presentation of (i, left) wound closure percentage of SNU-449 cells after 6-, 12-, 18- and 24-h incubation in no- and high-glucose supplemented culture conditions. Wound-healing graphical presentation represents 3 independent experiments. Combined microscopic images of (i, right) SNU-449 wound healing assay from automated microscope for real-time live cell imaging on 0, 6th, 12th and 24th hours. Full length blots are presented in Supplementary. All graphs of experiments are presented as the mean ± SEM of at least 3 independent experiments. Statistical analyses were performed and column graphs were generated using GraphPad Prism version 8.2.1 for MacOS, GraphPad Software, San Diego, California USA, https://www.graphpad.com .* p ≤ 0.05, ** p ≤ 0.01, *** p ≤ 0.001, **** p ≤ 0.0001.
Figure 2
Figure 2
High glucose did not induce glucose toxicity but enhanced spheroid formation in HCC cells. Analysis of toxicity of (a) HuH-7, (b) SNU-449, (c) HepG2 and (d) SK-HEP-1 cells in response to increasing glucose concentrations (0, 5, 25, 50 mM) with MTT assay. Cell survival is represented as absorbance (570 nm). Analyses of cell survival differences of (e) HuH-7, (f) SNU-449, (g) HepG2 and (h) SK-HEP-1 cells in no-, normo- (5.5 mM) and hyperglycemic-glucose (25 mM) conditions by SRB. Brightfield images and graphical presentation of hanging-drop spheroid formation assay performed with (i) HuH-7 and (j) SNU-449 cells in no- and high-glucose (25 mM glucose) supplemented conditions. Spheroid area is calculated with ImageJ. All graphs of experiments are presented as the mean ± SEM of at least 3 independent experiments. Statistical analyses were performed and graphs were generated using GraphPad Prism version 8.2.1 for MacOS, GraphPad Software, San Diego, California USA, https://www.graphpad.com. * p ≤ 0.05, ** p ≤ 0.01, *** p ≤ 0.001, **** p ≤ 0.0001.
Figure 3
Figure 3
High glucose exposure activated c-Met and downstream signaling via promoting ligand-independent homodimerization. (a) Immunoblotting of time-dependent c-Met protein expression and activation phosphorylations (Y1234/Y1235) in response to high glucose treatment in HuH-7, HepG2, SNU-449, and SK-HEP-1 cells. Immunofluorescence imaging of Alexa-594-labeled c-Met protein and Alexa-488 labeled c-Met activation phosphorylations (Y1234/Y1235) in response to no- and high-glucose (25 mM) conditions in (b) HuH-7 and (c) SNU-499 cells. Cell nuclei were counterstained with DAPI staining. Immunoblotting of time-dependent expressions of Erk1/2 activation phosphorylations (T202/Y204), Erk1/2 total protein and Egr-1 protein in response to high glucose stimulation in (d) HuH-7 and (e) SNU-449 cells. Calnexin (Canx) immunoblotting performed as an internal control. (f) Graphical presentation of HGF secretion analysis with ELISA. Conditioned media of HCC cells cultured in no- and high-glucose supplemented conditions were analyzed with sandwich ELISA. Crosslinking-immunoprecipitation assay for analyzing c-Met homodimerization under no- and high-glucose (25 mM) conditions in (g) HuH-7, (h) SNU-449, (i) HepG2 and (j) SK-HEP-1 cells. After starvation and indicated treatments for 16 h, proteins were crosslinked with Sulfo-EGS, c-Met was immunoprecipitated and immunoblotted with c-Met targeting primary antibody. Full length blots are presented in Supplementary. Column graph was generated using GraphPad Prism version 8.2.1 for MacOS, GraphPad Software, San Diego, California USA, https://www.graphpad.com.
Figure 4
Figure 4
High glucose increased cell aggressiveness reversed by inhibition of c-Met activation. Representative images showing protein expression of c-Met (Alexa-594 labeled) and phospho-Met (Y1234/Y1235), (Alexa-488 labelled) in (a) HuH-7 and (b) SNU-449 cells. Representative images showing F-actin stress fibrils (Alexa-488-conjugated Phalloidin labelled) in (c) HuH-7 and (d) SNU-449 cells. Cell nucleus is counterstained with DAPI staining. Graphical presentation of fold change of (e) motility and invasion in SNU-449 and (f) SK-HEP-1 cells in trans-well motility and invasion assays. Graphical presentation of (g) wound closure percentage of SNU-449 cells after 6-, 12-, 18- and 24-h incubation. Wound-healing graphical presentation represents 3 independent experiments. Combined microscopic images of SNU-449 wound healing assay from automated microscope for real-time live cell imaging on 0, 6th, 12th and 24th hours. Percentage of Annexin-V/PI positive HCC cells (h) in high glucose and c-Met inhibition conditions measured by flow cytometry. All data represented in this figure are from indicated HCC cells that are cultured with high-glucose control and high-glucose + SU11274 (2.5 µM) supplemented conditions. All graphs of experiments are presented as the mean ± SEM of at least 3 independent experiments. Statistical analyses were performed and graphs were generated using GraphPad Prism version 8.2.1 for MacOS, GraphPad Software, San Diego, California USA, https://www.graphpad.com. *p ≤ 0.05, ** p ≤ 0.01, *** p ≤ 0.001, **** p ≤ 0.0001.
Figure 5
Figure 5
The effect of c-Met kinase activity inhibition on glycolytic gene expression patterns in HCC. Heat-map of glucose metabolism gene expression analysis by RT-qPCR array in SNU-449 cells cultured in high glucose (25 mM) and high glucose together with c-Met-specific kinase inhibitor SU11274 (2.5 μM) (a). RT-qPCR validation of genes differentially expressed in RT-qPCR array experiments (GYS1, H6PD, HK2, MDH1B, PDK2, PDK4, PDPR, PFKL, PHKG1, PKLR) and glucose transporter GLUT1 (SLC2A1) in SNU-449 (b) and SK-HEP-1 cells treated with high glucose (25 mM) and high glucose together with c-Met-specific kinase inhibitor SU11274 (2.5 μM) (c). Heat-map presentation of indicated genes’ expression in normal and tumor tissue samples from patients in TCGA-LIHC dataset. Expression heat-map and adjusted p-values were generated with UALCAN from TCGA-LIHC dataset (d). Comparative expression analysis of indicated genes in TCGA-LIHC quartiles that were grouped according to MET expression (e). φ: significantly lower in high-MET quartile, *: significantly higher in high-MET quartile. Overall survival of patients in Low-MET and High-MET expression group based on TCGA data (f). Overall survival of patients in Low-GYS1 and High-GYS1 (left graph), Low-HK2 and High-HK2 (middle graph) and Low-SLC2A1 and High-SLC2A1 (right graph) expression groups based on TCGA data (g). Graphs (g) were generated by UALCAN. RT-qPCR graphs are presented as the mean ± SEM of at least 3 independent experiments. Statistical analyses were performed, and column graphs, heat-map image (e) and survival graph (f) were generated using GraphPad Prism version 8.2.1 for MacOS, GraphPad Software, San Diego, California USA, https://www.graphpad.com. * p ≤ 0.05, ** p ≤ 0.01, *** p ≤ 0.001, **** p ≤ 0.0001.
Figure 6
Figure 6
Graphical illustration of high glucose induced EMT via c-Met activation, its downstream signaling and associated biological cellular responses in high glucose and c-Met inhibited conditions. Green and red colored mechanisms represent active and inhibited c-Met signaling conditions, respectively. Molecular mechanisms defined in this study are summarized and numbered as following: (1) High glucose induces ligand-independent homodimerization of c-Met which in turn (2) activation of c-Met and downstream signaling, (3) promotes mesenchymal phenotype via inducing Vimentin (VIM) and N-Cadherin (CDH2) expression, (4) induces motility, invasion and spheroid formation ability. (5) Inhibition of c-Met activity by a small molecule inhibitor (SU11274) alters expression of glucose metabolism genes, (6) reverses high glucose induced mesenchymal-like phenotype and (7) aggressive behavior and eventually sensitizes HCC cells to glucose toxicity and promotes apoptosis. c-Met activated (A) and inhibited (B) conditions. Glucose metabolism genes which are confirmed with only one cell line are typed in with standard fonts, two cell lines are typed in with “bold” fonts and the genes confirmed in both in-vitro and bioinformatic analyses are typed with “big bold” fonts. Created with BioRender.com.

References

    1. Center MM, Jemal A. International trends in liver cancer incidence rates. Cancer Epidemiol. Biomark. Prevent. 2011;20:2362–2368. doi: 10.1158/1055-9965.EPI-11-0643. - DOI - PubMed
    1. Wong MC, et al. International incidence and mortality trends of liver cancer: A global profile. Sci. Rep. 2017;7:45846. doi: 10.1038/srep45846. - DOI - PMC - PubMed
    1. Garcia-Jimenez C, et al. From obesity to diabetes and cancer: Epidemiological links and role of therapies. Br. J. Cancer. 2016;114:716–722. doi: 10.1038/bjc.2016.37. - DOI - PMC - PubMed
    1. Lopez R, et al. Hyperglycemia enhances the proliferation of non-tumorigenic and malignant mammary epithelial cells through increased leptin/IGF1R signaling and activation of AKT/mTOR. PLoS ONE. 2013;8:e79708. doi: 10.1371/journal.pone.0079708. - DOI - PMC - PubMed
    1. Vasconcelos-Dos-Santos A, et al. Hyperglycemia exacerbates colon cancer malignancy through hexosamine biosynthetic pathway. Oncogenesis. 2017;6:e306. doi: 10.1038/oncsis.2017.2. - DOI - PMC - PubMed

Publication types

MeSH terms