

Fluorescent base analogues in gapmers enable stealth labeling of antisense oligonucleotide therapeutics
- PMID: 34059711
- PMCID: PMC8166847
- DOI: 10.1038/s41598-021-90629-1
Fluorescent base analogues in gapmers enable stealth labeling of antisense oligonucleotide therapeutics
Abstract
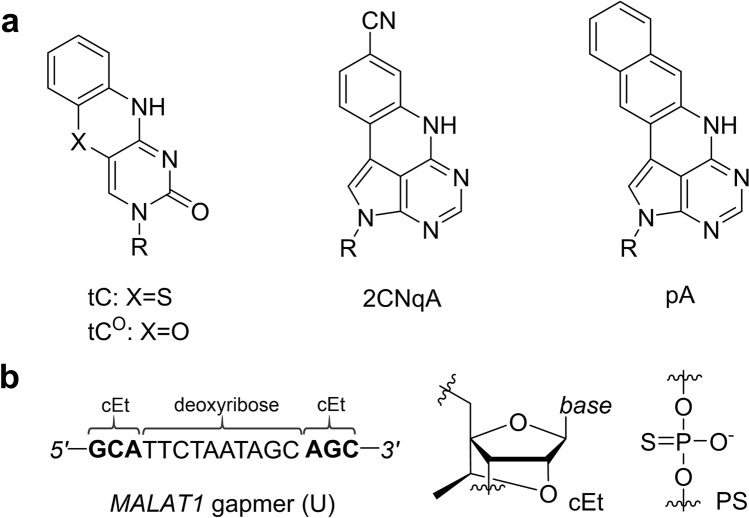
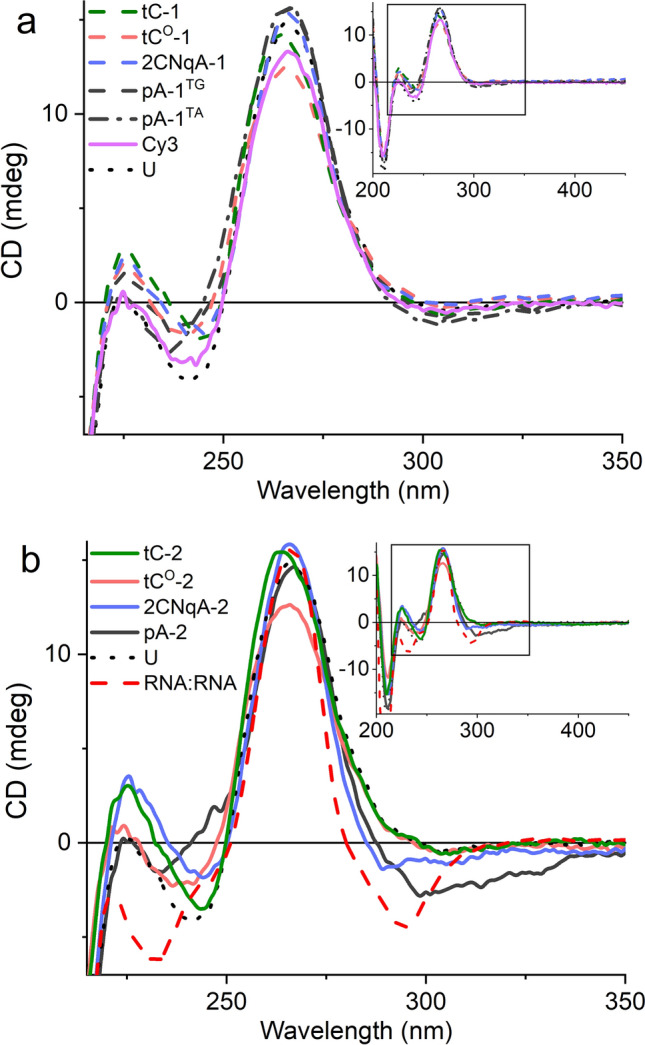
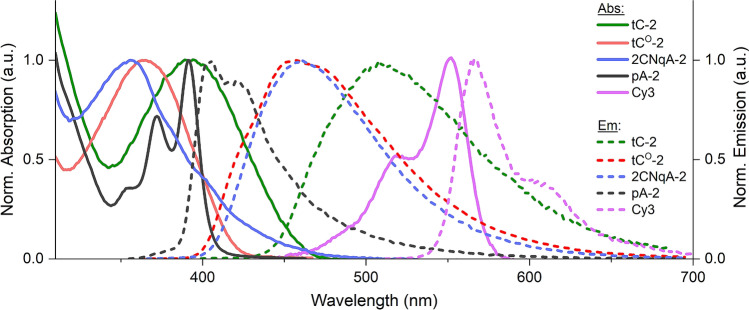
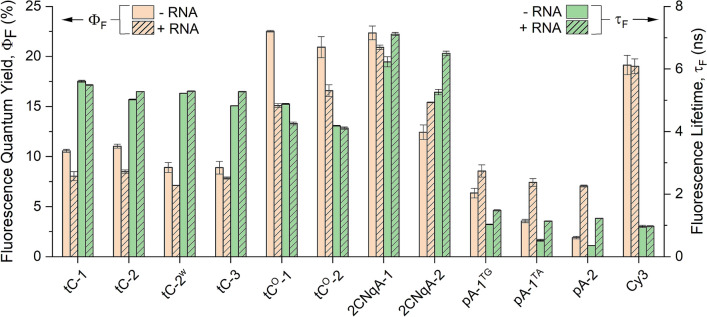
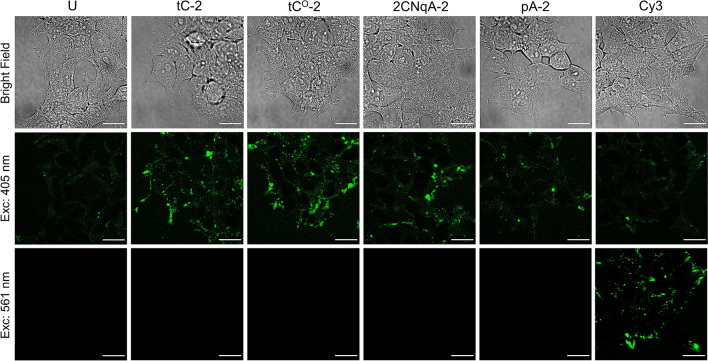
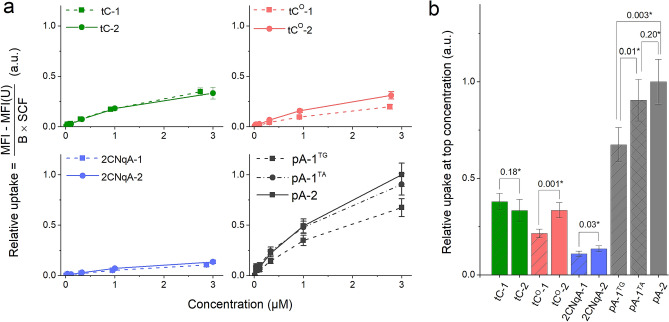
To expand the antisense oligonucleotide (ASO) fluorescence labeling toolbox beyond covalent conjugation of external dyes (e.g. ATTO-, Alexa Fluor-, or cyanine dyes), we herein explore fluorescent base analogues (FBAs) as a novel approach to endow fluorescent properties to ASOs. Both cytosine and adenine analogues (tC, tCO, 2CNqA, and pA) were incorporated into a 16mer ASO sequence with a 3-10-3 cEt-DNA-cEt (cEt = constrained ethyl) gapmer design. In addition to a comprehensive photophysical characterization, we assess the label-induced effects on the gapmers' RNA affinities, RNA-hybridized secondary structures, and knockdown efficiencies. Importantly, we find practically no perturbing effects for gapmers with single FBA incorporations in the biologically critical gap region and, except for pA, the FBAs do not affect the knockdown efficiencies. Incorporating two cytosine FBAs in the gap is equally well tolerated, while two adenine analogues give rise to slightly reduced knockdown efficiencies and what could be perturbed secondary structures. We furthermore show that the FBAs can be used to visualize gapmers inside live cells using fluorescence microscopy and flow cytometry, enabling comparative assessment of their uptake. This altogether shows that FBAs are functional ASO probes that provide a minimally perturbing in-sequence labeling option for this highly relevant drug modality.
Conflict of interest statement
The authors declare no competing interests.
Figures
Similar articles
-
Multiphoton characterization and live cell imaging using fluorescent adenine analogue 2CNqA.Phys Chem Chem Phys. 2023 Aug 2;25(30):20218-20224. doi: 10.1039/d3cp01147j. Phys Chem Chem Phys. 2023. PMID: 37475592
-
Evaluation of the effect of 2'-O-methyl, fluoro hexitol, bicyclo and Morpholino nucleic acid modifications on potency of GalNAc conjugated antisense oligonucleotides in mice.Bioorg Med Chem Lett. 2018 Dec 15;28(23-24):3774-3779. doi: 10.1016/j.bmcl.2018.10.011. Epub 2018 Oct 10. Bioorg Med Chem Lett. 2018. PMID: 30342955
-
Evaluating the Knockdown Activity of MALAT1 ENA Gapmers In Vitro.Methods Mol Biol. 2020;2176:155-161. doi: 10.1007/978-1-0716-0771-8_11. Methods Mol Biol. 2020. PMID: 32865789
-
Knocking Down Long Noncoding RNAs Using Antisense Oligonucleotide Gapmers.Methods Mol Biol. 2020;2176:49-56. doi: 10.1007/978-1-0716-0771-8_3. Methods Mol Biol. 2020. PMID: 32865781 Review.
-
DNA-RNA Heteroduplex Oligonucleotide for Highly Efficient Gene Silencing.Methods Mol Biol. 2020;2176:113-119. doi: 10.1007/978-1-0716-0771-8_8. Methods Mol Biol. 2020. PMID: 32865786 Review.
Cited by
-
Metabolic RNA labeling in non-engineered cells following spontaneous uptake of fluorescent nucleoside phosphate analogues.Nucleic Acids Res. 2024 Sep 23;52(17):10102-10118. doi: 10.1093/nar/gkae722. Nucleic Acids Res. 2024. PMID: 39162218 Free PMC article.
-
7,8-Dihydro-8-oxo-1,N6-ethenoadenine: an exclusively Hoogsteen-paired thymine mimic in DNA that induces A→T transversions in Escherichia coli.Nucleic Acids Res. 2022 Apr 8;50(6):3056-3069. doi: 10.1093/nar/gkac148. Nucleic Acids Res. 2022. PMID: 35234900 Free PMC article.
References
Publication types
MeSH terms
Substances
LinkOut - more resources
Full Text Sources
Other Literature Sources
Miscellaneous
