Comparative Study
. 2021 May 31;11(1):11342.
doi: 10.1038/s41598-021-90740-3.

Genome-wide identification of the BASS gene family in four Gossypium species and functional characterization of GhBASSs against salt stress

Affiliations
Comparative Study

Genome-wide identification of the BASS gene family in four Gossypium species and functional characterization of GhBASSs against salt stress

Thwin Myo et al. Sci Rep. .

Abstract

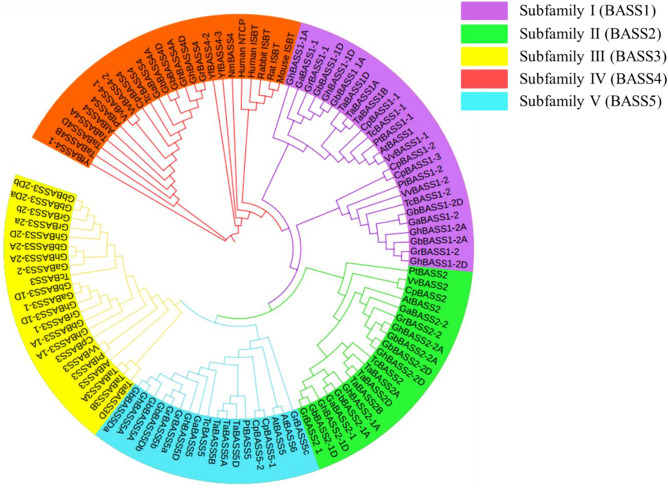
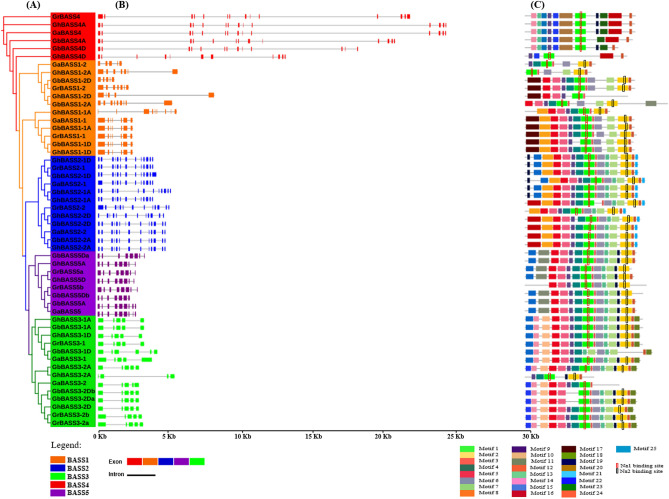
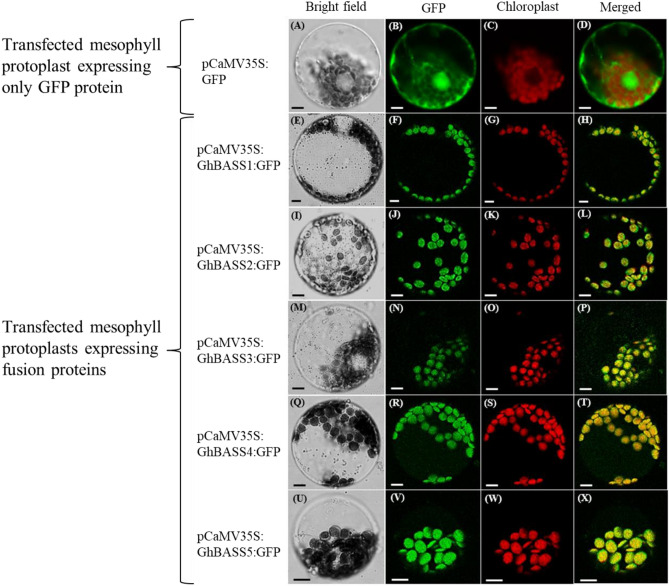
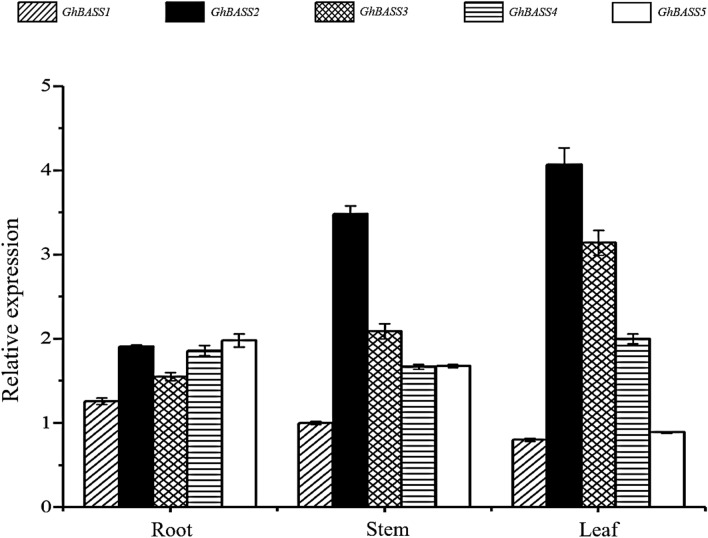
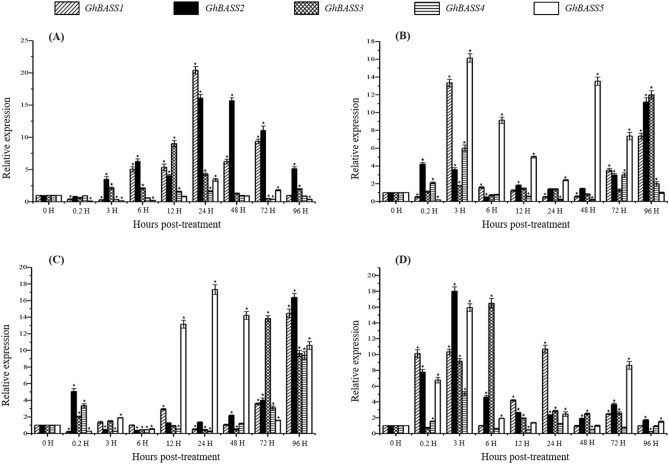
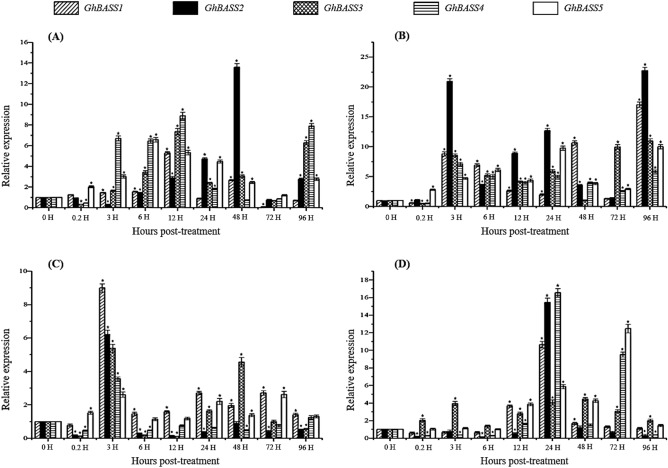
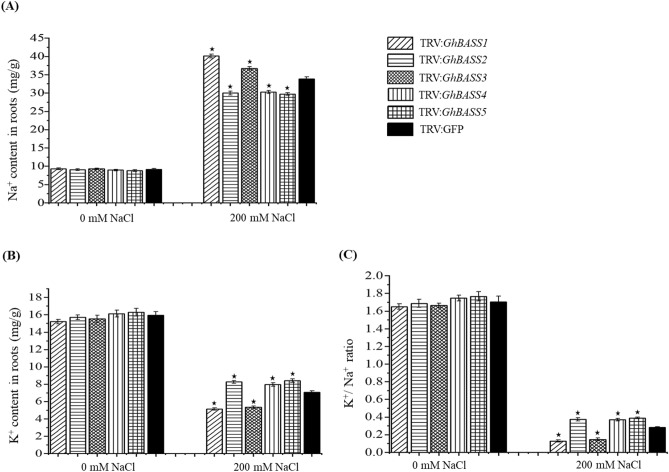
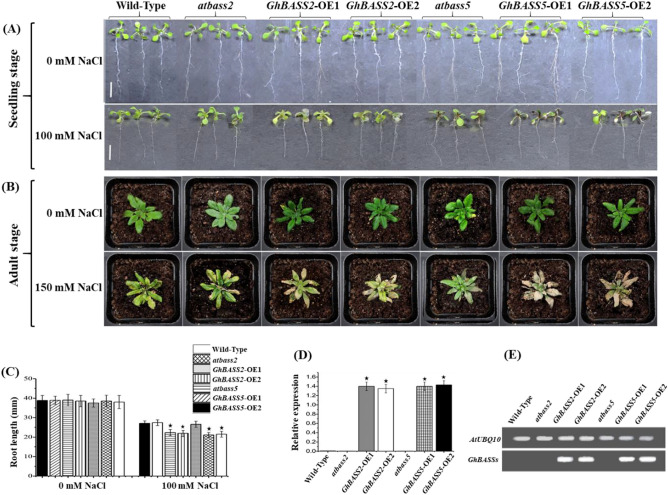
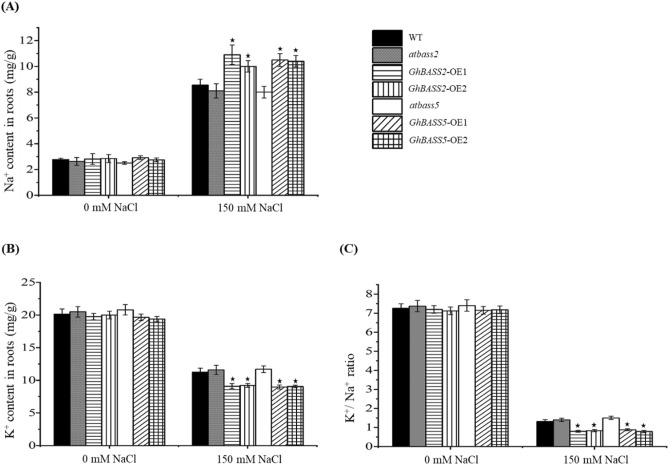
Bile acid sodium symporter (BASS) family proteins encode a class of sodium/solute symporters. Even though the sodium transporting property of BASSs in mammals was well studied, their sodium transportability and functional roles in plant salt tolerance remained largely unknown. Here, BASS family members from 4 cotton species, as well as 30 other species were identified. Then, they were designated as members of BASS1 to BASS5 subfamilies according to their sequence similarity and phylogenetic relationships. There were 8, 11, 16 and 18 putative BASS genes in four cotton species. While whole-genome duplications (WGD) and segmental duplications rendered the expansion of the BASS gene family in cotton, BASS gene losses occurred in the tetraploid cotton during the evolution from diploids to allotetraploids. Concerning functional characterizations, the transcript profiling of GhBASSs revealed that they not only preferred tissue-specific expression but also were differently induced by various stressors and phytohormones. Gene silencing and overexpression experiments showed that GhBASS1 and GhBASS3 positively regulated, whereas GhBASS2, GhBASS4 and GhBASS5 negatively regulated plant salt tolerance. Taken together, BASS family genes have evolved before the divergence from the common ancestor of prokaryotes and eukaryotes, and GhBASSs are plastidial sodium-dependent metabolite co-transporters that can influence plant salt tolerance.


Conflict of interest statement

The authors declare no competing interests.

Figures

Figure 1
Figure 1
Species phylogeny and the number of BASS genes in each species. The species tree was inferred from Zeng et al.. The divergence time was estimated by molecular clock dating from TimeTree. Stars on the branches represent WGD events. ζ, ancestral seed plant WGD; ε, ancestral angiosperms WGD; γ, triplication event; β and α, two recent WGD events in Eudicots; σ and ρ, two polyploidy events in monocots. The scientific name, common name and group are followed by the number of BASSs identified. MYA, million years ago.
Figure 2
Figure 2
Phylogenetic tree of BASSs from plants, mammals and bacteria. The phylogenetic tree was constructed by employing the MAFFT program via the EMBL-EBI bioinformatics interface with default parameters, employing Gblocks to get conserved blocks, using PhyML to build the tree and visualizing the tree with the iTOL v4. Ga Gossypium arboretum, Gr Gossypium raimondii, Gh Gossypium hirsutum, Gb Gossypium barbadense, Os Oryza sativa, At Arabidopsis thaliana, Tc Theobroma cacao, Vv Vitis vinifera, Pt Populus trichocarpa, Ta Triticum aestivum, Cp Carica papaya, Yf Yersinia frederiksenii, Nm Neisseria meningitides, NTCP Sodium-taurocholate co-transporting polypeptide, ISBT Ileal sodium bile acid co-transporter.
Figure 3
Figure 3
Phylogenetic relationships, gene architectures and conserved motifs of BASS genes from four Gossypium species. (A) Phylogenetic tree of putative cotton BASS family genes. The phylogenetic tree was constructed employing the MAFFT, Gblocks, PhyML and iTOL program. (B) Exon/intron organization of Gossypium BASS genes. Information for distribution of exons and introns was obtained from gff3 files of cotton genome annotation data, and gene architectures were depicted using the TBtools-JRE1.6 software. The color boxes indicate exons, and the grey lines represent introns. (C) Distributions of conserved motifs. Motifs were mined using the MEME software and depicted as 25 different color boxes. Na1 and Na2 binding sites are red and black rectangular boxes, respectively.
Figure 4
Figure 4
Genome-wide synteny analysis of BASS genes employing the MCScanX software. (A) Synteny analysis between G. raimondii and V. vinifera. Orange and green colored bars were depicted as chromosomes of G. raimondii (Gr01–13) and V. vinifera (Vv01–19 and VvUn), respectively. Green lines link orthologous gene pairs between G. raimondii and V. vinifera. (B) Synteny analysis between G. raimondii and T. cacao. Chromosomes of G. raimondii (Gr01–13) and T. cacao (Tc01–10) were filled with orange and purple, respectively. Purple lines connect orthologous gene pairs between T. cacao and G. raimondii. (C) Synteny analysis between G. arboreum and G. raimondii. Chromosomes of G. raimondii (Gr01–13) and G. arboreum (Ga01–13 and scaffold2621) were filled with orange and green, respectively. Blue lines bridge orthologous gene pairs between G. arboreum and G. raimondii. (D) Synteny analysis between G. hirsutum and two diploid species (G. arboreum and G. raimondii). Purple, orange and green colored bars were depicted as chromosomes of G. hirsutum (GhA01–13 and GhD01–13), G. raimondii (Gr01–13) and G. arboreum (Ga01–13 and scaffold2621), respectively. Green lines link orthologous gene pairs between G. arboreum and G. hirsutum, orange lines connect orthologous gene pairs between G. raimondii and G. hirsutum, and purple lines bridge homoeologous gene pairs between At- and Dt-subgenome of G. hirsutum. (E) Synteny analysis between G. barbadense and two diploid species (G. arboreum and G. raimondii). Blue, orange and green colored bars were depicted as chromosomes of G. barbadense (GbA01–13 and GbD01–13), G. raimondii (Gr01–13) and G. arboreum (Ga01–13 and scaffold2621), respectively. Green lines link orthologous gene pairs between G. arboreum and G. barbadense, orange lines connect orthologous gene pairs between G. raimondii and G. barbadense, and blue lines bridge homoeologous gene pairs between At- and Dt-subgenome of G. barbadense. Grey lines represent conserved synteny blocks between two different genomes and/or subgenomes of species. Putative BASS family genes were anchored to their corresponding chromosomes, and the symbol (*) means pseudogenes.
Figure 5
Figure 5
Subcellular localization of GhBASSs proteins. Recombinant plasmids bearing the fusion proteins (pCaMV35S:GhBASSs:GFP) and the empty plasmid bearing only the GFP protein (pCaMV35S:GFP) were independently transformed into A. thaliana mesophyll cells by the polyethylene glycol (PEG) transfection method. All images were observed with a confocal laser scanning microscope. (AD) Arabidopsis mesophyll protoplast expressing pCaMV35S:GFP protein; (EH) Arabidopsis mesophyll protoplast expressing pCaMV35S:GhBASS1:GFP fusion protein; (IL) Arabidopsis mesophyll protoplast expressing pCaMV35S:GhBASS2:GFP fusion protein; (MP) Arabidopsis mesophyll protoplast expressing pCaMV35S:GhBASS3:GFP fusion protein; (QT) Arabidopsis mesophyll protoplast expressing pCaMV35S:GhBASS4:GFP fusion protein; (UX) Arabidopsis mesophyll protoplast expressing pCaMV35S:GhBASS5:GFP fusion protein. Bars, 20 µm.
Figure 6
Figure 6
Expression patterns of GhBASSs in different tissues of cotton. Transcript levels were analyzed by qPCR and normalized to the GhUBQ7 gene (GenBank accession no. DQ116441). Means and standard errors were based on three idependent biological replicates. Error bars indicate standard error (SE).
Figure 7
Figure 7
Expression patterns of GhBASSs under different abiotic stresses. (A) Expression levels of GhBASSs in cotton roots responded to the salt (NaCl) treatment. (B) Expression profiles of GhBASSs in cotton roots after treating with drought (PEG6000). (C) Transcript levels of GhBASSs in cotton leaves against heat stress (37 °C). (D) Expression patterns of GhBASSs in cotton leaves exposed to cold stress (4 °C). Expression levels were analyzed by qPCR and normalized to the GhUBQ7 gene (GenBank accession no. DQ116441). Means and standard deviations were based on three independent biological replicates. Error bars represent the variation among three independent biological replications. Asterisks indicate the significant difference (*, P = 0.05) from 0 h post-treatment (hpt) by Tukey’s HSD test.
Figure 8
Figure 8
Expression patterns of GhBASSs during the treatments of various phytohormones. (A) Expression levels of GhBASSs in cotton leaves responded to the methyl viologen (MV) treatment. (B) Expression profiles of GhBASSs in cotton leaves after treated with abscisic acid (ABA). (C) Transcript levels of GhBASSs in cotton leaves against salicylic acids (SA). (D) Expression patterns of GhBASSs in cotton leaves exposed to gibberellic acids (GA3). Expression levels were analyzed by qPCR and normalized to the GhUBQ7 gene (GenBank accession no. DQ116441). Means and standard deviations were based on three independent biological replicates. Error bars represent the variation among three independent biological replications. Asterisks indicate the significant difference (*, P = 0.05) from 0 hpt by Tukey’s HSD test.
Figure 9
Figure 9
Varied salt-tolerant levels of GhBASSs knock-down plants by Agrobacterium-mediated VIGS. Shoot performance of TRV:GhBASSs and TRV:GFP before exposed to NaCl (A) and after subjected to 200 mM NaCl for 5 days (B). Root performance of TRV:GhBASSs and TRV:GFP before treated with NaCl (C) and after treated with 200 mM NaCl for 5 days (D). Related transcript levels of GhBASSs in GhBASSs knock-down plants by RT-PCR (E) and qPCR (F). GhUBQ7 (GenBank accession no. DQ116441) was used as an internal control. Means and standard deviations were based on three independent biological replicates. Error bars represent the variation among three independent biological replications. Asterisks indicate the significant difference (*, P = 0.05) from the control (TRV:GFP) by Tukey’s HSD test.
Figure 10
Figure 10
Ion contents in GhBASSs knock-down roots with the absence or presence of 200 mM NaCl for 5 days. (A) Na+ content in the roots of gene silencing plants. (B) K+ content in the roots of gene silencing plants. (C) K+/Na+ ratio. The ionic concentration is presented as mg/g dry weight. Means and standard deviations were based on three independent biological replicates. Error bars represent the variation among three independent biological replications. Asterisks indicate the significant difference (*, P = 0.05) from TRV:GFP by Tukey’s HSD test.
Figure 11
Figure 11
Constitutively overexpressing GhBASS2 and GhBASS5 weaken salt stress resistance in transgenic Arabidopsis. (A) The seedling’s phenotypes of transgenic OE lines, wild-type and loss-of-function mutants growing on the 1/2 MS medium supplemented with 0 or 100 mM NaCl for ten days. Bar = 10 mm. (B) The adult’s phenotypes of transgenic OE lines, wild-type and loss-of-function mutants after a seven-day treatment with 0 or 150 mM NaCl. (C) Root length of the wild-type, mutants and OE seedlings treated with 0 or 100 mM NaCl. (D, E) Transcript levels of GhBASS2 and GhBASS5 in wild-type, mutants and OE plants by qPCR and RT-PCR. The AtUBQ10 gene (GenBank accession no. AT4G05320) was used as an internal standard. Means and standard deviations were based on three independent biological replicates. Error bars represent the variation among three independent biological replications. Asterisks indicate the significant difference (*, P = 0.05) from WT by Tukey’s HSD test.
Figure 12
Figure 12
Ion contents in GhBASS2- and GhBASS5-overexpressed plants with the absence or presence of 150 mM NaCl for 7 days. (A) Na+ content in the roots of OE lines, mutants and WT plants. (B) K+ content in the roots of OE lines, mutants and WT plants. (C) K+/Na+ ratio. The ionic concentration is presented as mg/g dry weight. Means and standard deviations were based on three independent biological replicates. Error bars represent the variation among three independent biological replications. Asterisks indicate the significant difference (*, P = 0.05) from WT by Tukey’s HSD test.

References

    1. Schleiff U. Analysis of water supply of plants under saline soil conditions and conclusions for research on crop salt tolerance. J. Agron. Crop Sci. 2008;194:1–8. doi: 10.1111/j.1439-037X.2007.00290.x. - DOI
    1. Gorji T, Tanik A, Sertel E. Soil salinity prediction, monitoring and mapping using modern technologies. Procedia Earth Planet. Sci. 2015;15:507–512. doi: 10.1016/j.proeps.2015.08.062. - DOI
    1. Munns R. Genes and salt tolerance: bringing them together. New Phytol. 2005;167:645–663. doi: 10.1111/j.1469-8137.2005.01487.x. - DOI - PubMed
    1. Zhu JK. Salt and drought stress signal transduction in plants. Annu. Rev. Plant Biol. 2002;53:247–273. doi: 10.1146/annurev.arplant.53.091401.143329. - DOI - PMC - PubMed
    1. Alrefai WA, Gill RK. Bile acid transporters: structure, function, regulation and pathophysiological implications. Pharm Res. 2007;24:1803–1823. doi: 10.1007/s11095-007-9289-1. - DOI - PubMed

Publication types

Substances