

Hypo-glycosylated hFSH drives ovarian follicular development more efficiently than fully-glycosylated hFSH: enhanced transcription and PI3K and MAPK signaling
- PMID: 34059912
- PMCID: PMC8213452
- DOI: 10.1093/humrep/deab135
Hypo-glycosylated hFSH drives ovarian follicular development more efficiently than fully-glycosylated hFSH: enhanced transcription and PI3K and MAPK signaling
Abstract
Study question: Does hypo-glycosylated human recombinant FSH (hFSH18/21) have greater in vivo bioactivity that drives follicle development in vivo compared to fully-glycosylated human recombinant FSH (hFSH24)?
Summary answer: Compared with fully-glycosylated hFSH, hypo-glycosylated hFSH has greater bioactivity, enabling greater follicular health and growth in vivo, with enhanced transcriptional activity, greater activation of receptor tyrosine kinases (RTKs) and elevated phosphatidylinositol 3-kinase (PI3K)/protein kinase B (AKT) and Mitogen-activated protein kinase (MAPK)/extracellular signal-regulated kinase (ERK) signaling.
What is known already: Glycosylation of FSH is necessary for FSH to effectively activate the FSH receptor (FSHR) and promote preantral follicular growth and formation of antral follicles. In vitro studies demonstrate that compared to fully-glycosylated recombinant human FSH, hypo-glycosylated FSH has greater activity in receptor binding studies, and more effectively stimulates the PKA pathway and steroidogenesis in human granulosa cells.
Study design, size, duration: This is a cross-sectional study evaluating the actions of purified recombinant human FSH glycoforms on parameters of follicular development, gene expression and cell signaling in immature postnatal day (PND) 17 female CD-1 mice. To stimulate follicle development in vivo, PND 17 female CD-1 mice (n = 8-10/group) were treated with PBS (150 µl), hFSH18/21 (1 µg/150 µl PBS) or hFSH24 (1 µg/150 µl PBS) by intraperitoneal injection (i.p.) twice daily (8:00 a.m. and 6:00 p.m.) for 2 days. Follicle numbers, serum anti-Müllerian hormone (AMH) and estradiol levels, and follicle health were quantified. PND 17 female CD-1 mice were also treated acutely (2 h) in vivo with PBS, hFSH18/21 (1 µg) or hFSH24 (1 µg) (n = 3-4/group). One ovary from each mouse was processed for RNA sequencing analysis and the other ovary processed for signal transduction analysis. An in vitro ovary culture system was used to confirm the relative signaling pathways.
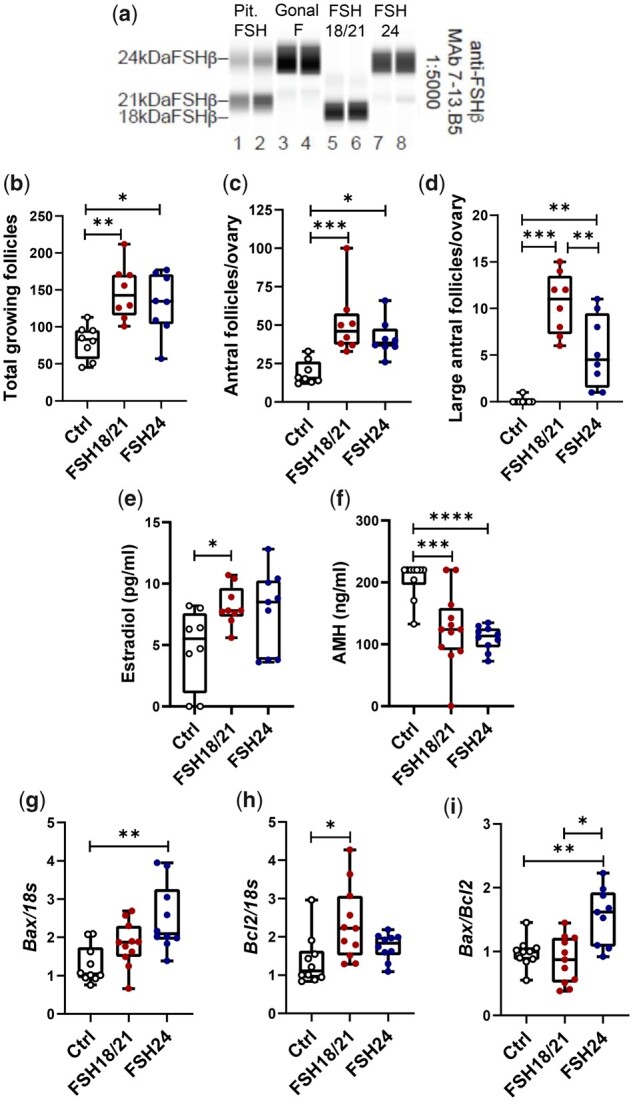
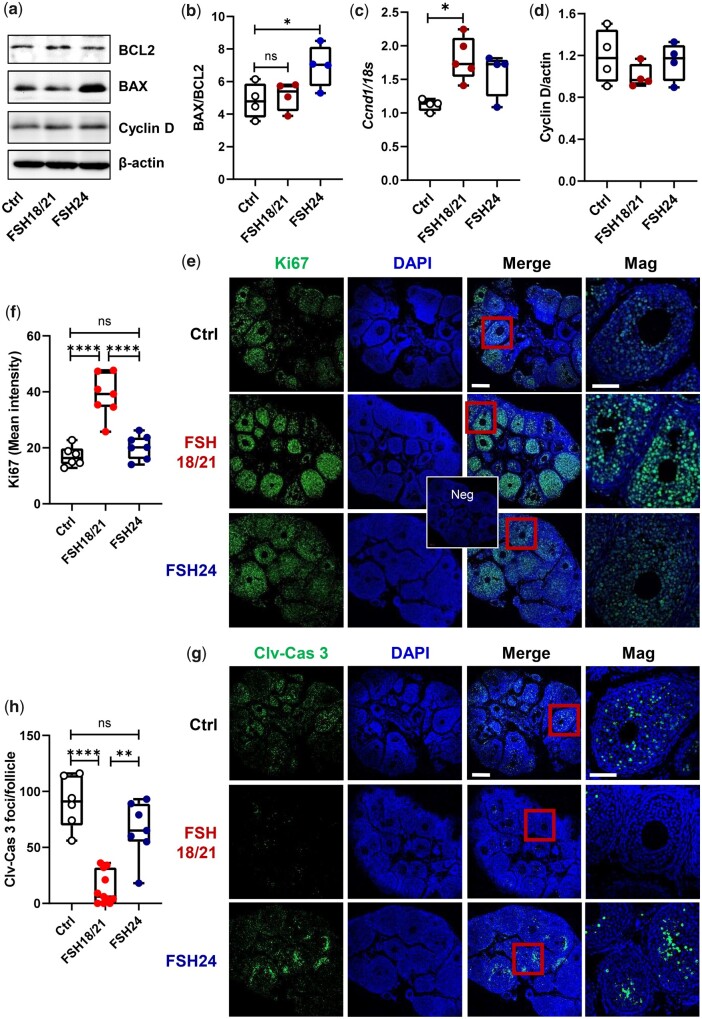
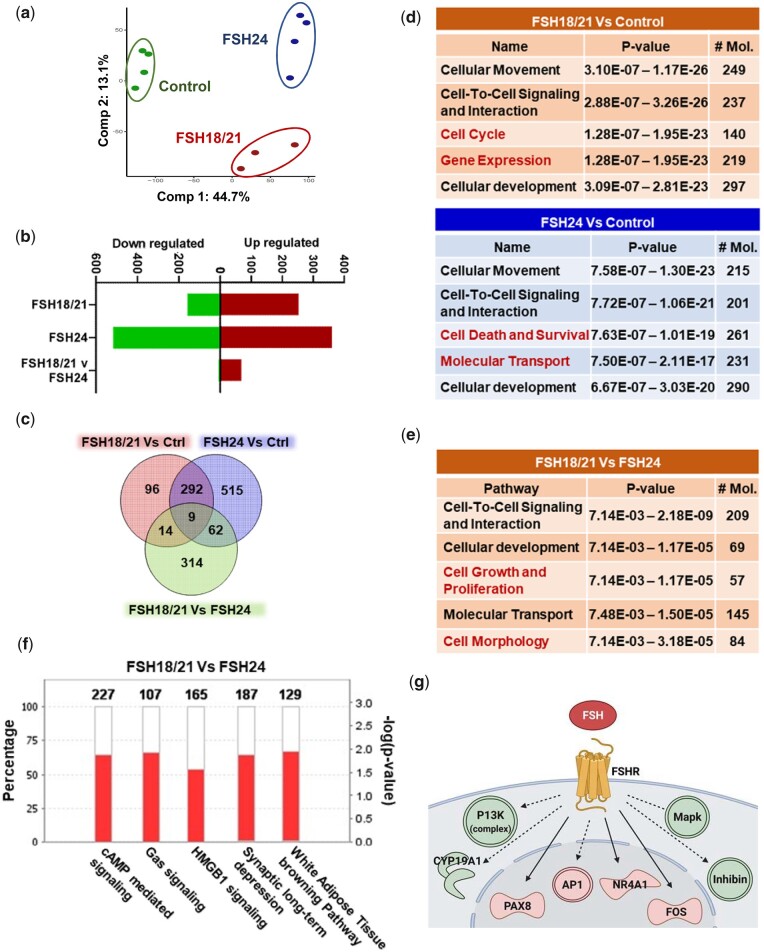
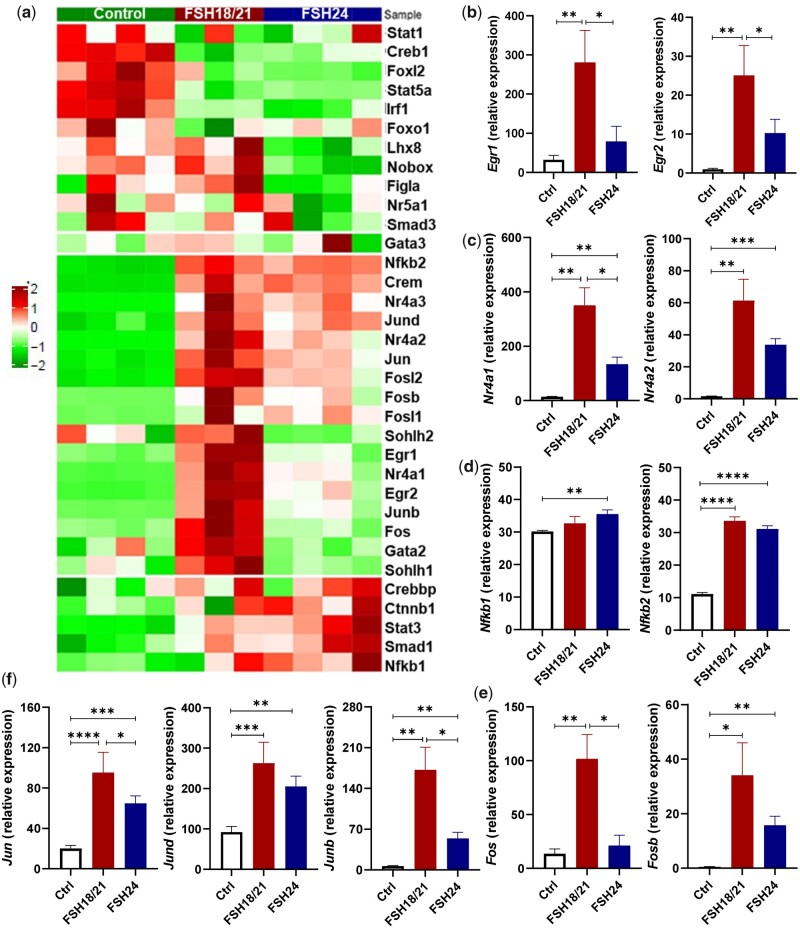
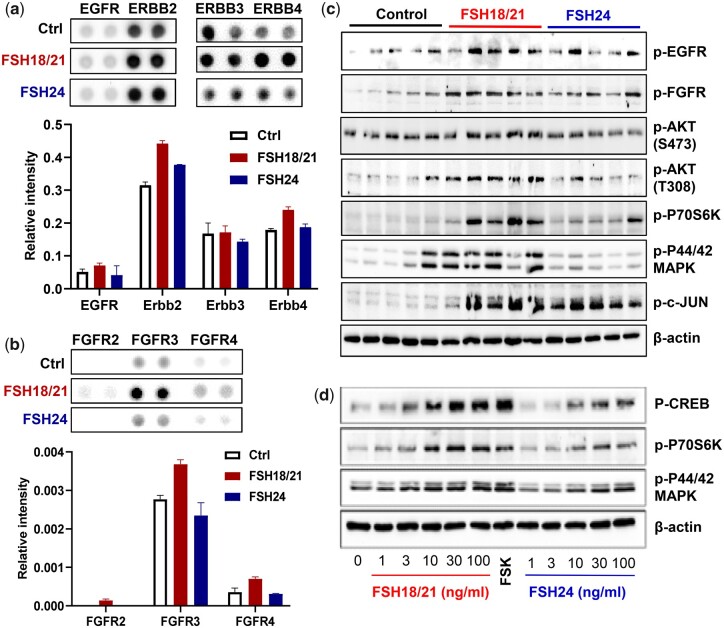
Participants/materials, setting, methods: The purity of different recombinant hFSH glycoforms was analyzed using an automated western blot system. Follicle numbers were determined by counting serial sections of the mouse ovary. Real-time quantitative RT-PCR, western blot and immunofluorescence staining were used to determine growth and apoptosis markers related with follicle health. RNA sequencing and bioinformatics were used to identify pathways and processes associated with gene expression profiles induced by acute FSH glycoform treatment. Analysis of RTKs was used to determine potential FSH downstream signaling pathways in vivo. Western blot and in vitro ovarian culture system were used to validate the relative signaling pathways.
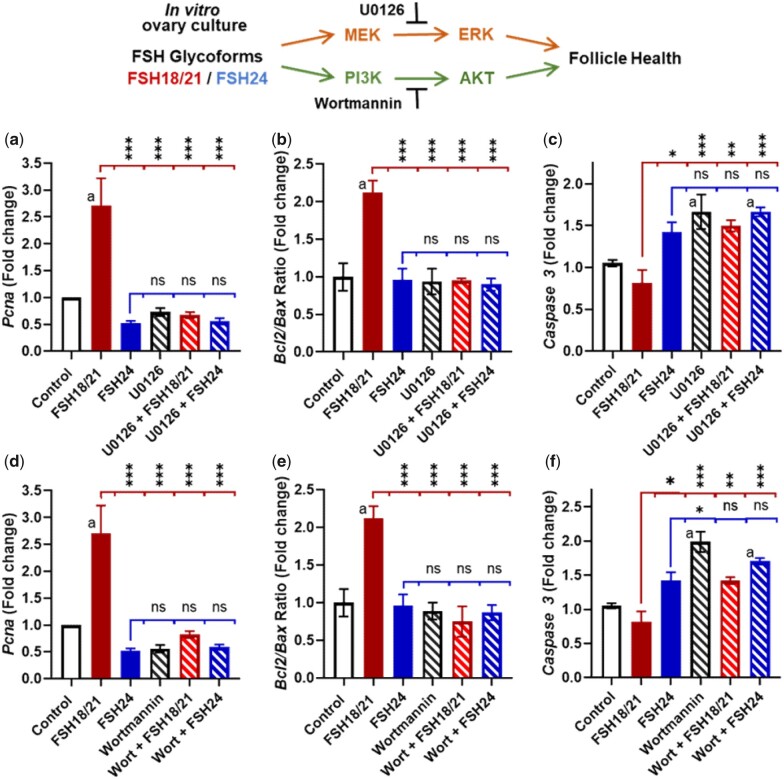
Main results and the role of chance: Our present study shows that both hypo- and fully-glycosylated recombinant human FSH can drive follicular growth in vivo. However, hFSH18/21 promoted development of significantly more large antral follicles compared to hFSH24 (P < 0.01). In addition, compared with hFSH24, hFSH18/21 also promoted greater indices of follicular health, as defined by lower BAX/BCL2 ratios and reduced cleaved Caspase 3. Following acute in vivo treatment with FSH glycoforms RNA-sequencing data revealed that both FSH glycoforms rapidly induced ovarian transcription in vivo, but hypo-glycosylated FSH more robustly stimulated Gαs and cAMP-mediated signaling and members of the AP-1 transcription factor complex. Moreover, hFSH18/21 treatment induced significantly greater activation of RTKs, PI3K/AKT and MAPK/ERK signaling compared to hFSH24. FSH-induced indices of follicle growth in vitro were blocked by inhibition of PI3K and MAPK.
Large scale data: RNA sequencing of mouse ovaries. Data will be shared upon reasonable request to the corresponding author.
Limitations, reasons for caution: The observations that hFSH glycoforms have different bioactivities in the present study employing a mouse model of follicle development should be verified in nonhuman primates. The gene expression studies reflect transcriptomes of whole ovaries.
Wider implications of the findings: Commercially prepared recombinant human FSH used for ovarian stimulation in human ART is fully-glycosylated FSH. Our findings that hypo-glycosylated hFSH has greater bioactivity enabling greater follicular health and growth without exaggerated estradiol production in vivo, demonstrate the potential for its development for application in human ART.
Study funding/competing interest(s): This work was supported by NIH 1P01 AG029531, NIH 1R01 HD 092263, VA I01 BX004272, and the Olson Center for Women's Health. JSD is the recipient of a VA Senior Research Career Scientist Award (1IK6 BX005797). This work was also partially supported by National Natural Science Foundation of China (No. 31872352). The authors declared there are no conflicts of interest.
Keywords: FSH; assisted reproduction; cell signaling; fertility; follicle development; glycosylation; gonadotropin action; granulosa cell; ovary; transcription.
Published by Oxford University Press on behalf of European Society of Human Reproduction and Embryology 2021. This work is written by US Government employees and is in the public domain in the US.
Figures
Similar articles
-
Bioactivity of recombinant hFSH glycosylation variants in primary cultures of porcine granulosa cells.Mol Cell Endocrinol. 2020 Aug 20;514:110911. doi: 10.1016/j.mce.2020.110911. Epub 2020 Jun 15. Mol Cell Endocrinol. 2020. PMID: 32553947 Free PMC article.
-
Evaluation of in vivo bioactivities of recombinant hypo- (FSH21/18) and fully- (FSH24) glycosylated human FSH glycoforms in Fshb null mice.Mol Cell Endocrinol. 2016 Dec 5;437:224-236. doi: 10.1016/j.mce.2016.08.031. Epub 2016 Aug 22. Mol Cell Endocrinol. 2016. PMID: 27561202 Free PMC article.
-
Anti-Müllerian hormone signaling in the ovary involves stromal fibroblasts: a study in humans and mice provides novel insights into the role of ovarian stroma.Hum Reprod. 2024 Nov 1;39(11):2551-2564. doi: 10.1093/humrep/deae221. Hum Reprod. 2024. PMID: 39361580
-
Review: Roles of follicle-stimulating hormone in preantral folliculogenesis of domestic animals: what can we learn from model species and where do we go from here?Animal. 2023 May;17 Suppl 1:100743. doi: 10.1016/j.animal.2023.100743. Animal. 2023. PMID: 37567683 Review.
-
Interactions between androgens, FSH, anti-Müllerian hormone and estradiol during folliculogenesis in the human normal and polycystic ovary.Hum Reprod Update. 2016 Nov;22(6):709-724. doi: 10.1093/humupd/dmw027. Epub 2016 Aug 27. Hum Reprod Update. 2016. PMID: 27566840 Review.
Cited by
-
Long Noncoding RNA NONHSAT233728.1 Promotes ROS Accumulation and Granulosa Cell Apoptosis by Regulating the MAPK/ERK1/2 Signaling Pathway.FASEB J. 2025 Jun 15;39(11):e70681. doi: 10.1096/fj.202500964R. FASEB J. 2025. PMID: 40432414 Free PMC article.
-
Follicle-Stimulating Hormone Induces Lipid Droplets via Gαi/o and β-Arrestin in an Endometrial Cancer Cell Line.Front Endocrinol (Lausanne). 2022 Feb 3;12:798866. doi: 10.3389/fendo.2021.798866. eCollection 2021. Front Endocrinol (Lausanne). 2022. PMID: 35185785 Free PMC article.
-
Oral follicle-stimulating hormone receptor agonist affects granulosa cells differently than recombinant human FSH.Fertil Steril. 2023 Nov;120(5):1061-1070. doi: 10.1016/j.fertnstert.2023.07.024. Epub 2023 Jul 31. Fertil Steril. 2023. PMID: 37532169 Free PMC article.
-
Differential effects of follicle-stimulating hormone glycoforms on the transcriptome profile of cultured rat granulosa cells as disclosed by RNA-seq.bioRxiv [Preprint]. 2023 Oct 20:2023.10.18.562995. doi: 10.1101/2023.10.18.562995. bioRxiv. 2023. Update in: PLoS One. 2024 Jun 6;19(6):e0293688. doi: 10.1371/journal.pone.0293688. PMID: 37905087 Free PMC article. Updated. Preprint.
-
Interplay Between mTOR and Hippo Signaling in the Ovary: Clinical Choice Guidance Between Different Gonadotropin Preparations for Better IVF.Front Endocrinol (Lausanne). 2021 Jul 21;12:702446. doi: 10.3389/fendo.2021.702446. eCollection 2021. Front Endocrinol (Lausanne). 2021. PMID: 34367070 Free PMC article. Review.
References
-
- Allan CM, Wang Y, Jimenez M, Marshan B, Spaliviero J, Illingworth P, Handelsman DJ.. Follicle-stimulating hormone increases primordial follicle reserve in mature female hypogonadal mice. J Endocrinol 2006;188:549–557. - PubMed
-
- Baka S, Malamitsi-Puchner A.. Novel follicular fluid factors influencing oocyte developmental potential in IVF: a review. Reprod Biomed Online 2006;12:500–506. - PubMed
-
- Bousfield GR, Butnev VY, Walton WJ, Nguyen VT, Huneidi J, Singh V, Kolli VSK, Harvey DJ, Rance NE.. All-or-none N-glycosylation in primate follicle-stimulating hormone β-subunits. Mol Cell Endocrinol 2007;260–262:40–48. - PubMed
Publication types
MeSH terms
Substances
Grants and funding
LinkOut - more resources
Full Text Sources
Research Materials
Miscellaneous
