

Effects of ad libitum food intake, insufficient sleep and weekend recovery sleep on energy balance
- PMID: 34059916
- PMCID: PMC8598190
- DOI: 10.1093/sleep/zsab136
Effects of ad libitum food intake, insufficient sleep and weekend recovery sleep on energy balance
Abstract
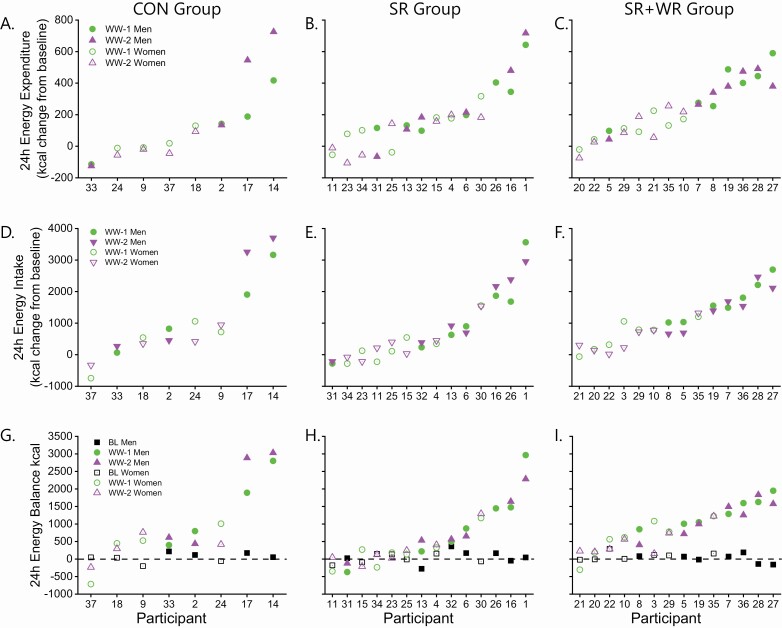
Study objectives: Insufficient sleep is believed to promote positive energy balance (EB) and weight gain. Increasing weekend sleep duration to "recover" from weekday sleep loss is common, yet little is known regarding how weekend recovery sleep influences EB. We conducted a randomized controlled trial to assess how: (1) 2 days and 8 days of insufficient sleep and (2) ad libitum weekend recovery sleep impact EB (energy intake [EI] - energy expenditure [EE]).
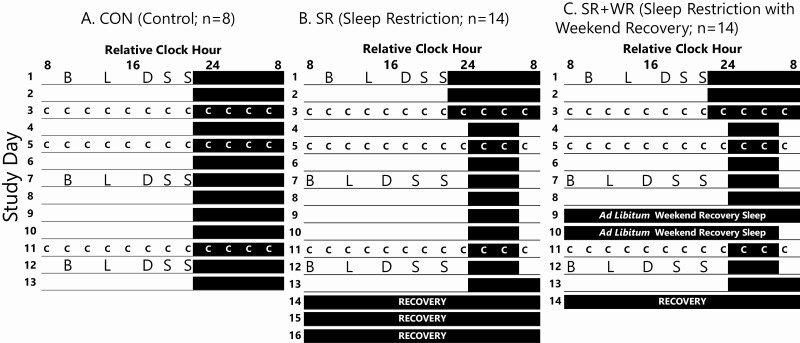
Methods: Following ten baseline days with 9 h per night sleep opportunities, participants completed one of three 10-day experimental protocols with ad libitum EI: control (9 h sleep opportunities; n = 8; 23 ± 5 years [mean ± SD]); sleep restriction (SR; 5 h sleep opportunities; n = 14; 25 ± 5 years); sleep restriction with weekend recovery sleep (SR + WR; 5 days insufficient sleep, 2 days ad libitum weekend recovery sleep, 3 days recurrent insufficient sleep; n = 14; 27 ± 4 years).
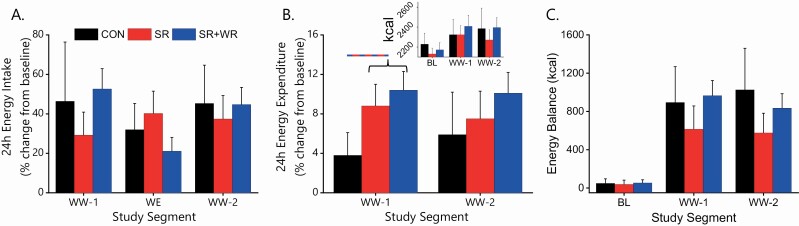
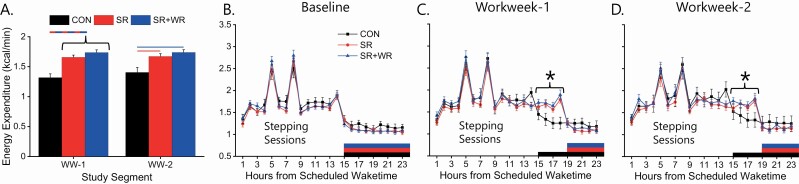
Results: Twenty-four hour EB increased (p < 0.001; main effect) by an average of 797.7 ± 96.7 (±SEM) kcal during the 10-day experimental protocol versus baseline with no significant differences between groups. Percent change from baseline in 24 h-EE was higher (p < 0.05) on day 2 of insufficient sleep (SR and SR + WR groups; 10 ± 1%) versus adequate sleep (control group; 4 ± 3%).
Conclusions: In this between-group study, the effects of adequate sleep and insufficient sleep, with or without or weekend recovery sleep, on 24 h-EB were similar. Examining EB and body weight changes using within-subject cross-over designs and "free-living" conditions outside the laboratory (e.g. sleep extension) are needed to advance our understanding of the links between insufficient sleep, weekend recovery sleep and weight-gain.
Keywords: catch-up sleep; circadian misalignment; interindividual variability; metabolic dysregulation; obesity; overeating; sleep deprivation; sleep loss; sleep restriction; timing of food intake.
© Sleep Research Society 2021. Published by Oxford University Press on behalf of the Sleep Research Society. All rights reserved. For permissions, please email: journals.permissions@oup.com.
Figures
Similar articles
-
Insufficient sleep and weekend recovery sleep: classification by a metabolomics-based machine learning ensemble.Sci Rep. 2023 Nov 30;13(1):21123. doi: 10.1038/s41598-023-48208-z. Sci Rep. 2023. PMID: 38036605 Free PMC article. Clinical Trial.
-
Ad libitum Weekend Recovery Sleep Fails to Prevent Metabolic Dysregulation during a Repeating Pattern of Insufficient Sleep and Weekend Recovery Sleep.Curr Biol. 2019 Mar 18;29(6):957-967.e4. doi: 10.1016/j.cub.2019.01.069. Epub 2019 Feb 28. Curr Biol. 2019. PMID: 30827911
-
Bone turnover marker responses to sleep restriction and weekend recovery sleep.Bone. 2021 Nov;152:116096. doi: 10.1016/j.bone.2021.116096. Epub 2021 Jun 30. Bone. 2021. PMID: 34216838 Free PMC article. Clinical Trial.
-
Is sleep deprivation a contributor to obesity in children?Eat Weight Disord. 2016 Mar;21(1):5-11. doi: 10.1007/s40519-015-0233-9. Epub 2015 Nov 17. Eat Weight Disord. 2016. PMID: 26576804 Review.
-
The role of sleep duration in the regulation of energy balance: effects on energy intakes and expenditure.J Clin Sleep Med. 2013 Jan 15;9(1):73-80. doi: 10.5664/jcsm.2348. J Clin Sleep Med. 2013. PMID: 23319909 Free PMC article. Review.
Cited by
-
Sleep extension and cardiometabolic health: what it is, possible mechanisms and real-world applications.J Physiol. 2024 Dec;602(23):6571-6586. doi: 10.1113/JP284911. Epub 2024 Jan 24. J Physiol. 2024. PMID: 38268197 Free PMC article. Review.
-
Sleep, testosterone and cortisol balance, and ageing men.Rev Endocr Metab Disord. 2022 Dec;23(6):1323-1339. doi: 10.1007/s11154-022-09755-4. Epub 2022 Sep 24. Rev Endocr Metab Disord. 2022. PMID: 36152143 Free PMC article. Review.
-
Reaction of the endogenous regulatory mechanisms to early weekday wakeups: a review of its popular explanations in light of model-based simulations.Front Netw Physiol. 2023 Dec 15;3:1285658. doi: 10.3389/fnetp.2023.1285658. eCollection 2023. Front Netw Physiol. 2023. PMID: 38169971 Free PMC article.
-
The influence of sleep on human taste function and perception: A systematic review.J Sleep Res. 2025 Feb;34(1):e14257. doi: 10.1111/jsr.14257. Epub 2024 Jun 18. J Sleep Res. 2025. PMID: 38888109 Free PMC article.
-
Insufficient sleep and weekend recovery sleep: classification by a metabolomics-based machine learning ensemble.Sci Rep. 2023 Nov 30;13(1):21123. doi: 10.1038/s41598-023-48208-z. Sci Rep. 2023. PMID: 38036605 Free PMC article. Clinical Trial.
References
-
- Centers for Disease Control and Prevention. Effect of short sleep duration on daily activities—United States, 2005–2008. Morb Mortal Wkly Rep. 2011;60(8):239–242. - PubMed
-
- Centers for Disease Control and Prevention. Short sleep duration among US adults. https://www.cdc.gov/sleep/data_statistics.html. Published 2014. Updated May 2, 2017. Accessed September 24, 2018.
-
- Gallup. Gallup poll social series: lifestyle. Gallup News Service. https://news.gallup.com/poll/166553/less-recommended-amount-sleep.aspx. Published 2013. Accessed July 31, 2018.
Publication types
MeSH terms
Grants and funding
LinkOut - more resources
Full Text Sources
Research Materials
