

Lysine demethylase LSD1 delivered via small extracellular vesicles promotes gastric cancer cell stemness
- PMID: 34060205
- PMCID: PMC8339672
- DOI: 10.15252/embr.202050922
Lysine demethylase LSD1 delivered via small extracellular vesicles promotes gastric cancer cell stemness
Abstract
Several studies have examined the functions of nucleic acids in small extracellular vesicles (sEVs). However, much less is known about the protein cargos of sEVs and their functions in recipient cells. This study demonstrates the presence of lysine-specific demethylase 1 (LSD1), which is the first identified histone demethylase, in the culture medium of gastric cancer cells. We show that sEVs derived from gastric cancer cells and the plasma of patients with gastric cancer harbor LSD1. The shuttling of LSD1-containing sEVs from donor cells to recipient gastric cancer cells promotes cancer cell stemness by positively regulating the expression of Nanog, OCT4, SOX2, and CD44. Additionally, sEV-delivered LSD1 suppresses oxaliplatin response of recipient cells in vitro and in vivo, whereas LSD1-depleted sEVs do not. Taken together, we demonstrate that LSD1-loaded sEVs can promote stemness and chemoresistance to oxaliplatin. These findings suggest that the LSD1 content of sEV could serve as a biomarker to predict oxaliplatin response in gastric cancer patients.
Keywords: LSD1; gastric cancer; small extracellular vesicles; stemness.
© 2021 The Authors.
Conflict of interest statement
The authors declare that they have no conflict of interest.
Figures
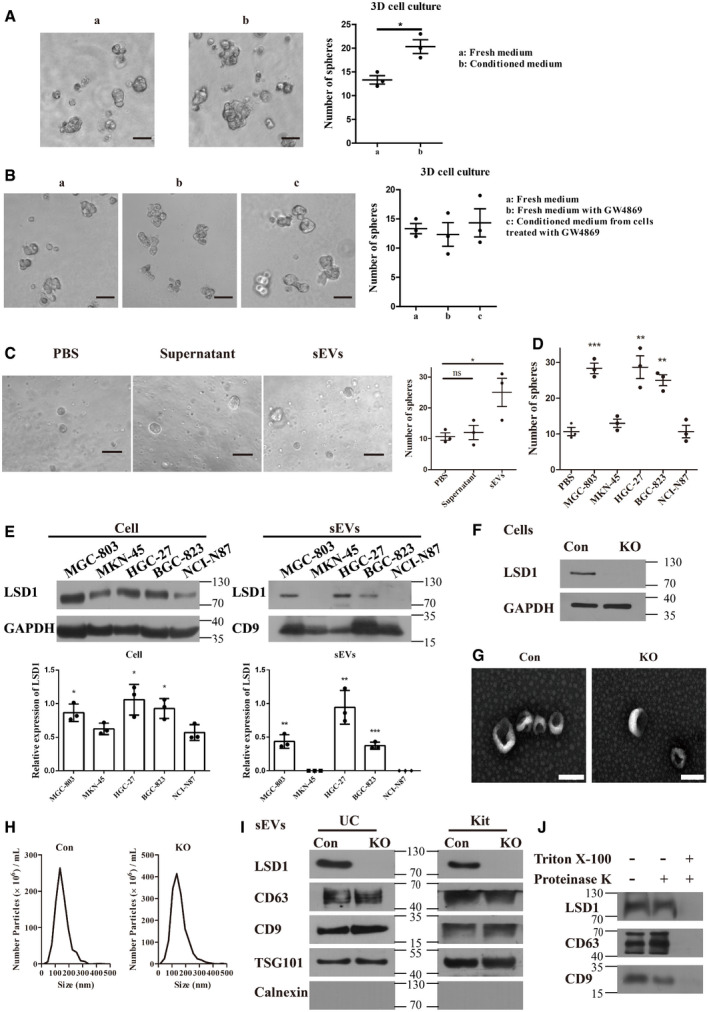
- A
Sphere formation in MGC‐803 cells incubated with fresh medium or conditioned medium from MGC‐803 cells for 7 days. The number of spheres was quantified and indicated on the right. Scale bar = 100 µm (n = 3 biological replicates; mean ± standard error of mean (SEM); *P = 0.0146; two‐tailed unpaired Student’s t‐test).
- B
Sphere formation in MGC‐803 cells with indicated treatment. The number of spheres was quantified and indicated on the right. Scale bar = 100 µm (n = 3 biological replicates; mean ± SEM; no significant differences; two‐tailed unpaired Student’s t‐test).
- C
Sphere formation in MGC‐803 cells incubated with an equal volume of phosphate‐buffered saline, supernatant after differential centrifugation, or sEVs. Scale bar = 100 µm (n = 3 biological replicates; mean ± SEM; ns, no significant difference; *P = 0.0390; two‐tailed unpaired Student’s t‐test).
- D
Sphere formation in MGC‐803 cells treated with sEVs (20 μg/ml) from five gastric cancer cell lines as indicated (n = 3 biological replicates; mean ± SEM; ***P = 0.0007 (MGC‐803), **P = 0.0061 (HGC‐27), and **P = 0.0018 (BGC‐823); two‐tailed unpaired Student’s t‐test).
- E
Expression levels of LSD1 in MGC‐803, MKN‐45, HGC‐27, BGC‐823, and NCI‐N87 cell lines and their corresponding sEVs. The samples with equal amounts of proteins were loaded (n = 3 biological replicates; mean ± SEM; compared with the NCI‐N87; *P = 0.0432 (cell/MGC‐803), *P = 0.0300 (cell/HGC‐27), **P = 0.0306 (cell/BGC‐823), **P = 0.0018 (sEVs/MGC‐803), **P = 0.0029 (sEVs/HGC‐27), and ***P = 0.0003 (sEVs/BGC‐823); two‐tailed unpaired Student’s t‐test; GAPDH was used as a loading control for cell lysis; CD9 was used as a loading control for sEV lysis).
- F
Establishment of LSD1 knockout (KO) MGC‐803 cell line. Con indicates MGC‐803 cells, while KO indicates LSD1 KO MGC‐803 cells.
- G, H
Transmission electron microscopy images (G) and the size distribution (H) of sEVs from MGC‐803 and LSD1 KO MGC‐803 cells. Scale bar = 100 nm.
- I
Expression levels of LSD1, CD63, CD9, TSG101, and calnexin in sEVs from MGC‐803 and LSD1 KO MGC‐803 cells. sEVs were extracted using two different extraction methods (ultracentrifugation (UC) and commercial kit). Calnexin is an sEV negative marker. UC, sEVs isolated using the ultracentrifugation method; Kit, sEVs isolated using the commercial kit.
- J
Expression levels of LSD1, CD63, and CD9 in sEVs with indicated treatment.
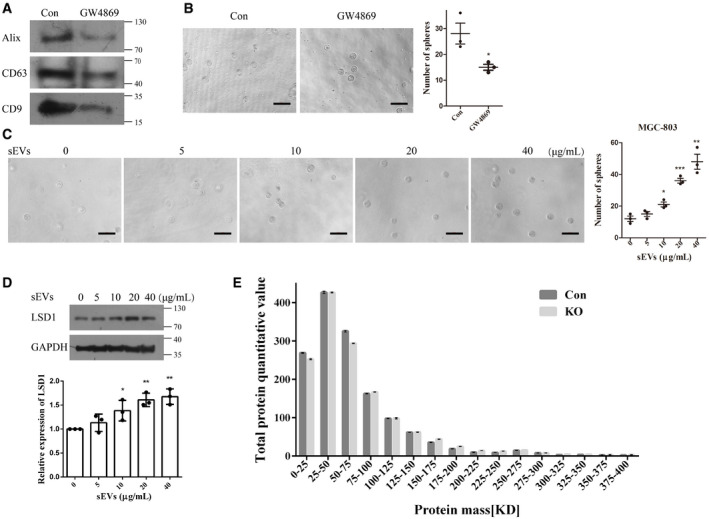
sEV marker proteins were detected using Western blotting to determine the amount of sEVs secreted by equal numbers of cells (Con indicates sEVs isolated from MGC‐803 cells; GW4869 indicates sEVs isolated from GW4869‐treated MGC‐803 cells).
Sphere formation assay results of MGC‐803 cells treated with sEVs (from equal number of cells) from control or GW4869‐treated cell culture medium. Scale bar = 100 µm (n = 3 biological replicates; mean ± standard error of mean (SEM); *P = 0.0365; two‐tailed unpaired Student’s t‐test).
Sphere formation assay results of MGC‐803 cells treated with different doses of sEVs as indicated. Scale bar = 100 µm (n = 3 biological replicates; mean ± SEM; *P = 0.0176, ***P = 0.0005, and **P = 0.0020; two‐tailed unpaired Student’s t‐test).
Expression level of LSD1 in MGC‐803 cells treated with different doses of sEVs as indicated (n = 3 biological replicates; mean ± SEM; *P(10 μg/ml) = 0.0362, **P(20 μg/ml) = 0.0017, and **P(40 μg/ml) = 0.0019; two‐tailed unpaired Student’s t‐test; GAPDH was used as a loading control for cell lysis).
Protein contents in sEVs from control (Con) and LSD1 knockout (KO) cells were profiled using mass spectrometry (n = 3 biological replicates; mean ± SEM).
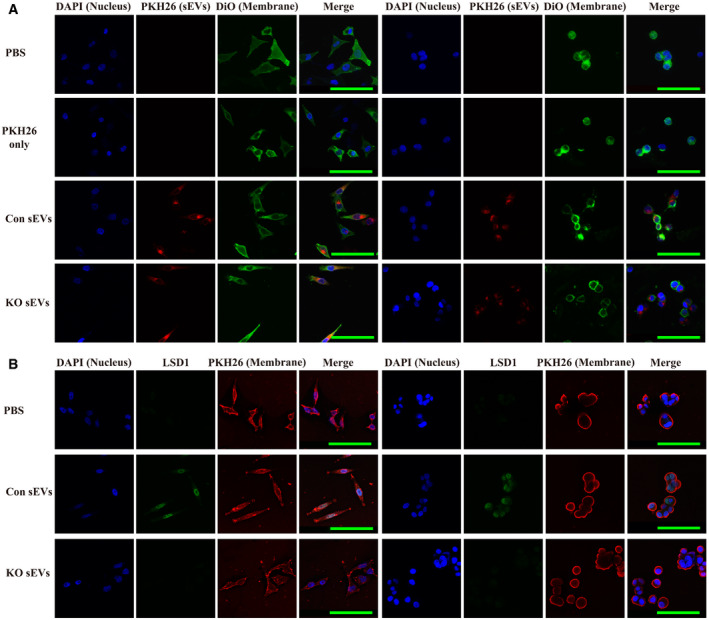
Confocal microscopy image analysis of sEV fusion to MGC‐803 cells. The MGC‐803 (left side) and MKN‐45 (right side) cells were treated with sEVs derived from MGC‐803 cells (Con sEVs) or LSD1 knockout (KO) MGC‐803 cells (KO sEVs) and stained with PKH26 for 12 h. Additionally, the cell membrane was stained with Dio, while the nuclei were stained with 4',6‐diamidino‐2‐phenylindole (DAPI). Scale bar = 100 µm.
Immunofluorescence confocal microscopy analysis of LSD1 (green) in LSD1 KO MGC‐803 cells (left panel) and LSD1 KO MKN‐45 cells (right panel) incubated with 20 μg/ml Con sEVs and KO sEVs for 12 h. The cell membrane was stained with PKH26, while the nuclei were stained with DAPI. Scale bar = 100 µm.
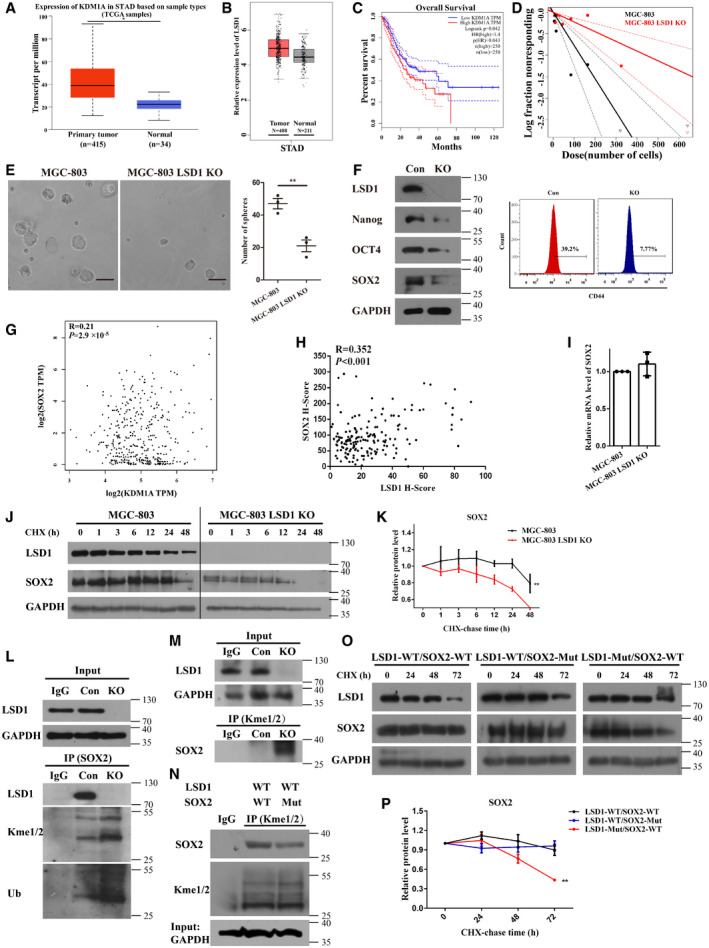
Expression level of LSD1 (KDM1A) in gastric cancer and non‐cancerous tissues from UALCAN datasets (STAD, stomach adenocarcinoma; central band, boxes, and whiskers of the boxplot represent the median, first quartile, third quartile, minimum, and maximum values, respectively).
Expression level of LSD1 (KDM1A) in gastric cancer or non‐cancerous tissues from Gene Expression Profiling Interactive Analysis (GEPIA) datasets (central band, boxes, and whiskers of the boxplot represent the median, first quartile, third quartile, minimum, and maximum values, respectively).
Overall survival analysis using GEPIA datasets (log‐rank test; the solid line represents the survival curve, while the dashed line represents the 95% confidence interval).
In vitro limiting dilution assay with MGC‐803 and LSD1 knockout (KO) MGC‐803 cells (the solid line represents the sphere formation ability curve, while the dashed line represents the 95% confidence interval).
Sphere formation assay results of MGC‐803 and LSD1 KO MGC‐803 cells. Scale bar = 100 µm (n = 3 biological replicates; mean ± standard error mean (SEM); **P = 0.0058; two‐tailed unpaired Student’s t‐test).
Expression levels of LSD1, Nanog, OCT4, SOX2, and CD44 in LSD1 KO MGC‐803 cells.
Correlation between LSD1 and SOX2 mRNA levels analyzed using the GEPIA dataset (Pearson’s test).
Correlation between LSD1 and SOX2 in 172 gastric cancer tissues (Pearson’s test).
The mRNA levels of SOX2 in different cells were detected using quantitative real‐time polymerase chain reaction (n = 3 biological replicates; mean ± SEM).
Stability of SOX2 in MGC‐803 and LSD1 KO MGC‐803 cells treated with cycloheximide (20 μM) at the indicated times.
Relative intensity of SOX2 in (J) (n = 3 biological replicates, mean ± SEM).
Immunoprecipitation of Kme1/2 and ubiquitin (Ub) with SOX2 in the presence or absence of LSD1. The cells were treated with MG132 (10 μM) for 8 h before analysis.
Reverse immunoprecipitation of Kme1/2 on SOX2.
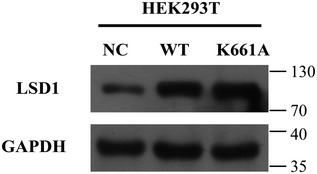
Immunoprecipitation of Kme1/2 on SOX2 (WT indicates HEK293T cells co‐transfected with LSD1‐WT and SOX2‐WT; Mut indicates HEK293T cells co‐transfected with LSD1‐WT and SOX2‐Mut; WT, wild type; Mut, mutant).
Stability of SOX2 in HEK293T cells co‐transfected with different plasmids (WT, wild type; SOX2‐Mut, K42R, and K117R mutations; LSD1‐Mut: K661A mutation).
Relative intensity of SOX2 in (O) (n = 3 biological replicates; mean ± SEM; **P = 0.0055; two‐tailed unpaired Student’s t‐test).
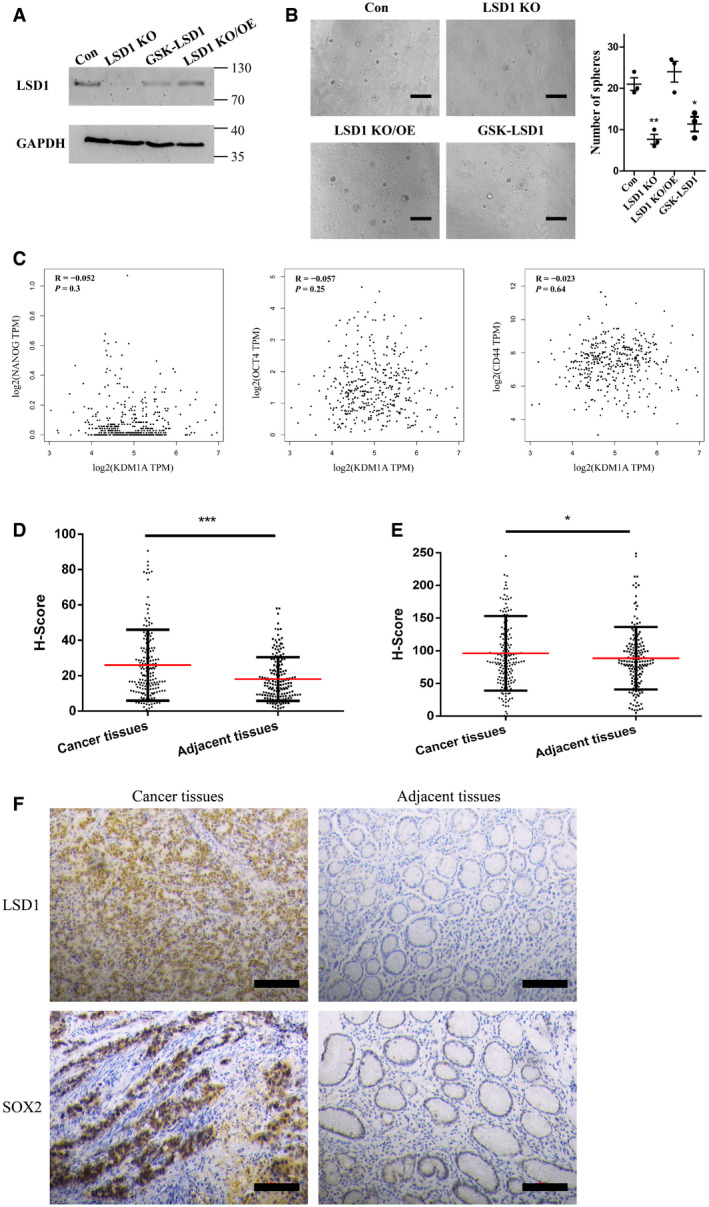
- A
Expression level of LSD1 in MGC‐803, LSD1 knockout (KO) MGC‐803, LSD1 KO MGC‐803 cells transfected with LSD1‐encoding plasmid, and GSK‐LSD1‐treated MGC‐803 cells. GAPDH was used as a loading control.
- B
Sphere formation assay results of MGC‐803 cells subjected to different treatments as indicated in the figure. Scale bar = 100 µm (n = 3 biological replicates; mean ± standard error mean (SEM); **P = 0.0042 and *P = 0.0146; two‐tailed unpaired Student’s t‐test).
- C
Correlation of LSD1 (KDM1A) with Nanog, OCT4, and CD44 determined using Gene Expression Profiling Interactive Analysis (GEPIA) datasets (Pearson’s test).
- D, E
Expression levels of LSD1 (D) and SOX2 (E) in 172 pairs of gastric cancer tissues and adjacent non‐cancerous tissues were examined using immunohistochemical analysis (n = 172 paired tissues; mean ± SEM; ***P < 0.0001 (LSD1) and *P = 0.0348 (SOX2); two‐tailed unpaired Student’s t‐test).
- F
Representative images are shown as indicated. Scale bar = 100 µm.
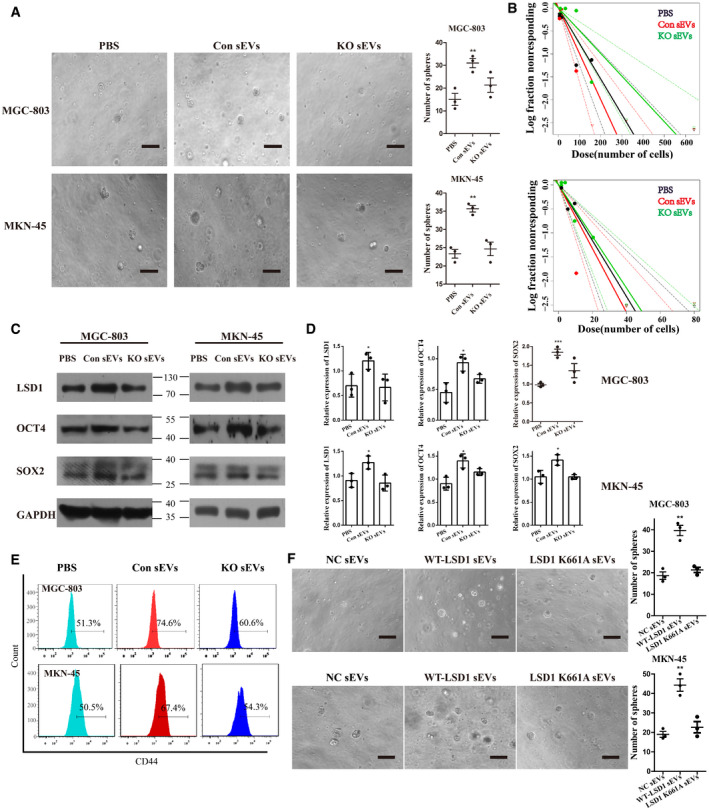
Sphere formation assay of MGC‐803 and MKN‐45 cells incubated with 20 μg/ml sEVs from MGC‐803 or LSD1 knockout (KO) MGC‐803 cells for 7 days (n = 3 biological replicates; mean ± standard error of mean (SEM); **P = 0.0090 (MGC‐803) and **P = 0.0012 (MKN‐45); two‐tailed unpaired Student’s t‐test; scale bar = 100 µm).
In vitro limiting dilution assays performed using MGC‐803 (upper panel) and MKN‐45 (bottom panel) cells incubated with 20 μg/ml sEVs from MGC‐803 or LSD1 KO MGC‐803 cells for 14 days (the solid line represents the sphere formation ability curve, while the dashed line represents the 95% confidence interval. The circles and triangles represent data from different groups).
Expression levels of LSD1, OCT4, and SOX2 in MGC‐803 and MKN‐45 cells incubated with 20 μg/ml sEVs from MGC‐803 or LSD1 KO MGC‐803 cells for 48 h.
Quantification of the results of (C) (n = 3 biological replicates; mean ± SEM; *P = 0.0385 (LSD1), *P = 0.0160 (OCT4), and ***P = 0.0006 (SOX2) for MGC‐803; *P = 0.0299 (LSD1), *P = 0.0147 (OCT4), and *P = 0.0258 (SOX2) for MKN‐45; two‐tailed unpaired Student’s t‐test).
Expression level of CD44 in MGC‐803 and MKN‐45 cells incubated with 20 μg/ml sEVs from MGC‐803 or LSD1 KO MGC‐803 cells for 48 h.
Sphere formation assay results of MGC‐803 (upper panel) and MKN‐45 (bottom panel) cells incubated with 20 μg/ml sEVs from HEK293T cells (left panel), WT‐LSD1 sEVs (middle panel), and LSD1 K661A sEVs (right panel) for 7 days. Scale bar = 100 µm (n = 3 biological replicates; mean ± SEM; **P = 0.0021 (MGC‐803) and **P = 0.0020 (MKN‐45); two‐tailed unpaired Student’s t‐test).
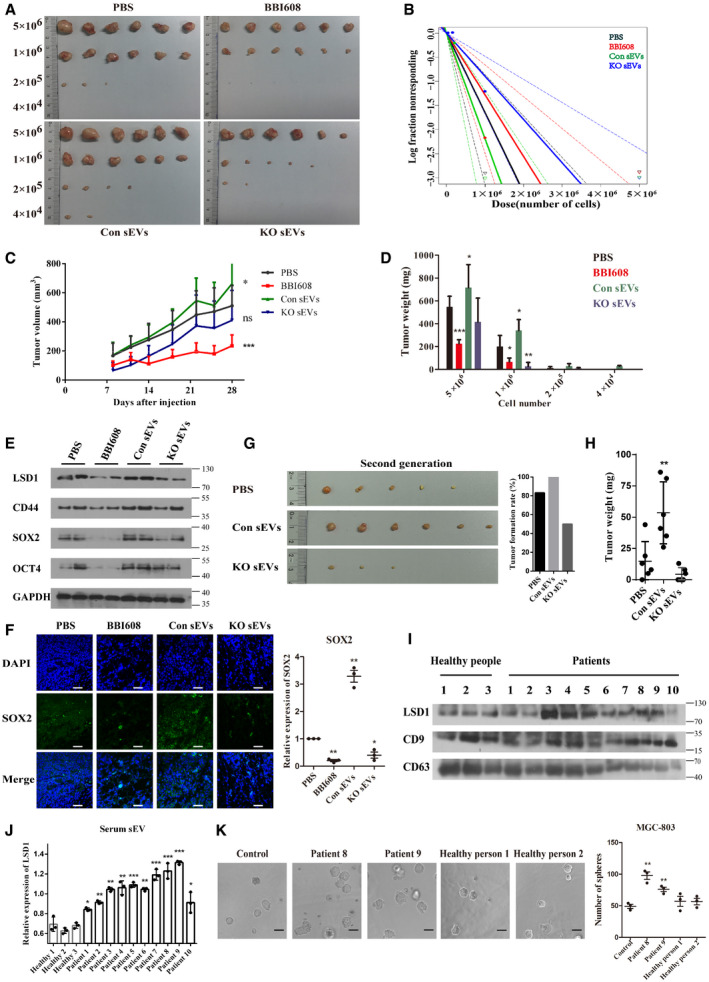
- A, B
In vivo limiting dilution assay results of MGC‐803 cells treated with phosphate‐buffered saline, BBI608, sEVs from control cells (Con sEVs), and sEVs from LSD1 knockout (KO) cells (KO sEVs) as indicated for 28 days in BALB/c‐nu mice. Representative images of tumors excised from the mice (A) and the frequency of tumor formation (B) are shown (the solid line represents the sphere formation ability curve, while the dashed line represents the 95% confidence interval. The circles and triangles represent data from different groups).
- C
Tumor volume of each group subjected to in vivo limiting dilution assay with 5 × 10⁶ cells with indicated treatment (n = 6 biological replicates; mean ± standard error of mean (SEM), *P = 0.0441 and ***P = 0.0002; two‐tailed unpaired Student’s t‐test).
- D
Tumor weight of each group subjected to in vivo limiting dilution assay (n = 6 biological replicates; mean ± SEM; ***P < 0.0001, *P = 0.0285, *P = 0.0162, *P = 0.0498, and *P = 0.0049; two‐tailed unpaired Student’s t‐test).
- E
Expression levels of LSD1, CD44, SOX2, and OCT4 in tumor tissues subjected to in vivo limiting dilution assay performed with 5 × 10⁶ cells.
- F
Immunofluorescence image and quantification of the expression of SOX2 in tumor tissues subjected to in vivo limiting dilution assay. Scale bar = 50 µm (n = 3 biological replicates; mean ± SEM; **P = 0.0024, **P = 0.0088, and *P = 0.0342; two‐tailed unpaired Student’s t‐test).
- G
Representative images of second‐generation tumors (left) and the tumor formation rate (right) in each group.
- H
Second‐generation tumor weight in each group (n = 6 biological replicates; mean ± SEM; *P = 0.0091; two‐tailed unpaired Student’s t‐test).
- I, J
Expression levels of LSD1 in sEVs isolated from the plasma. CD9 and CD63 were used as markers of sEVs. CD9 was used as a loading control for sEV lysis (n = 3 biological replicates; mean ± SEM; *P = 0.0256 (patient 1), **P = 0.0068 (patient 2), **P = 0.0013 (patient 3), **P = 0.0031 (patient 4), ***P = 0.0009 (patient 5), **P = 0.0012 (patient 6), ***P = 0.0007 (patient 7), ***P = 0.0010 (patient 8), ***P = 0.0001 (patient 9), and *P = 0.0461 (patient 10); two‐tailed unpaired Student’s t‐test).
- K
Sphere formation assay results of MGC‐803 cells treated with sEVs as indicated for 7 days. Scale bar = 100 µm (n = 3 biological replicates; mean ± SEM; **P = 0.0019 and **P = 0.0050; two‐tailed unpaired Student’s t‐test).
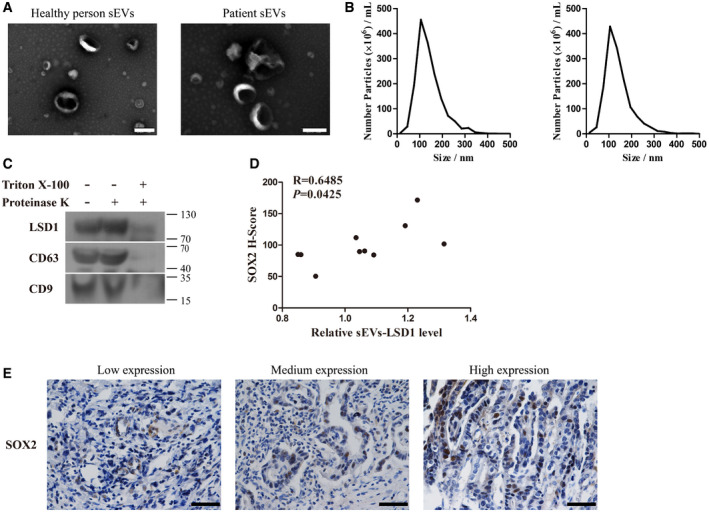
- A, B
Transmission electron microscopy image (A) and the size distribution (B) of sEVs from the plasma of healthy individuals (left panel) and patients with gastric cancer (right panel). Scale bar = 200 nm.
- C
Expression levels of LSD1, CD63, and CD9 in sEVs with indicated treatment.
- D
Correlation between the amount of LSD1‐containing sEVs and SOX2 in tissues of 10 patients used to isolate sEVs (Pearson’s test).
- E
Representative images are shown as indicated. Scale bar = 50 µm.
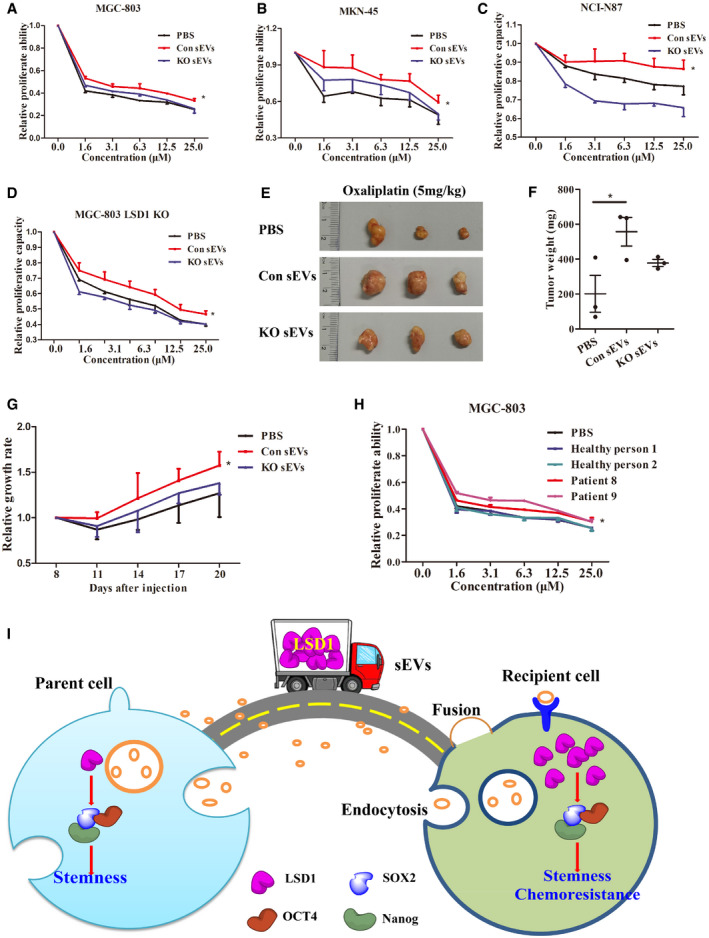
- A–D
Proliferation assay results of MGC‐803 (A), MKN‐45 (B), NCI‐N87 (C), and LSD1 knockout (KO) MGC‐803 (D) cells treated with oxaliplatin along with indicated treatments (n = 3 biological replicates, mean ± standard error of mean (SEM); *P = 0.0204 (MGC‐803), *P = 0.0498 (MKN‐45), *P = 0.0473 (NCI‐N87), and *P = 0.0019 (LSD1 KO MGC‐803); two‐tailed unpaired Student’s t‐test).
- E, F
Representative images of tumors (E) and the tumor weight (F) of mice treated with oxaliplatin in the presence or absence of sEVs (n = 3 biological replicates; mean ± SEM; *P = 0.0488; two‐tailed unpaired Student’s t‐test).
- G
Tumor growth rate in mice treated with oxaliplatin in the presence or absence of sEVs. Tumor growth rate was measured according to tumor volume (n = 3 biological replicates; mean ± SEM; *P = 0.0439; two‐tailed unpaired Student’s t‐test).
- H
Proliferation assay results of MGC‐803 cells treated with oxaliplatin in the presence or absence of sEVs from the plasma of patients with gastric cancer or healthy individuals (n = 3 biological replicates; mean ± SEM; *P = 0.0487; two‐tailed unpaired Student’s t‐test).
- I
Schematic model for the shuttling of LSD1 from parent cells to recipient cells using sEVs as vehicles. The sEV‐delivered LSD1 promotes recipient gastric cancer stemness and chemoresistance.
References
-
- Amente S, Lania L, Majello B (2013) The histone LSD1 demethylase in stemness and cancer transcription programs. Biochem Biophys Acta 1829: 981–986 - PubMed
-
- Baguley BC (2010) Multidrug resistance in cancer. Methods Mol Biol 596: 1–14 - PubMed
-
- Brabletz T (2012) EMT and MET in metastasis: where are the cancer stem cells? Cancer Cell 22: 699–701 - PubMed
-
- Bray F, Ferlay J, Soerjomataram I, Siegel RL, Torre LA, Jemal A (2018) Global cancer statistics 2018: GLOBOCAN estimates of incidence and mortality worldwide for 36 cancers in 185 countries. CA Cancer J Clin 68: 394–424 - PubMed
Publication types
MeSH terms
Substances
LinkOut - more resources
Full Text Sources
Medical
Research Materials
Miscellaneous
