. 2021 Jun 28;250(2):49-65.
doi: 10.1530/JOE-21-0040.

DHT causes liver steatosis via transcriptional regulation of SCAP in normal weight female mice

Affiliations

DHT causes liver steatosis via transcriptional regulation of SCAP in normal weight female mice

Tina Seidu et al. J Endocrinol. .

Abstract

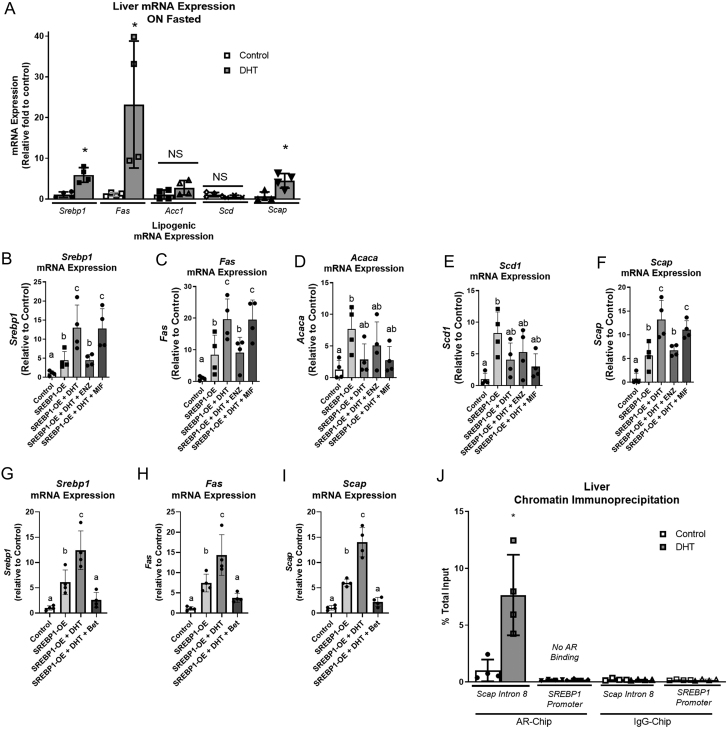
Hyperandrogenemia (HA) is a hallmark of polycystic ovary syndrome (PCOS) and is an integral element of non-alcoholic fatty liver disease (NALFD) in females. Administering low-dose dihydrotestosterone (DHT) induced a normal weight PCOS-like female mouse model displaying NAFLD. The molecular mechanism of HA-induced NAFLD has not been fully determined. We hypothesized that DHT would regulate hepatic lipid metabolism via increased SREBP1 expression leading to NAFLD. We extracted liver from control and low-dose DHT female mice; and performed histological and biochemical lipid profiles, Western blot, immunoprecipitation, chromatin immunoprecipitation, and real-time quantitative PCR analyses. DHT lowered the 65 kD form of cytosolic SREBP1 in the liver compared to controls. However, DHT did not alter the levels of SREBP2 in the liver. DHT mice displayed increased SCAP protein expression and SCAP-SREBP1 binding compared to controls. DHT mice exhibited increased AR binding to intron-8 of SCAP leading to increased SCAP mRNA compared to controls. FAS mRNA and protein expression was increased in the liver of DHT mice compared to controls. p-ACC levels were unaltered in the liver. Other lipid metabolism pathways were examined in the liver, but no changes were observed. Our findings support evidence that DHT increased de novo lipogenic proteins resulting in increased hepatic lipid content via regulation of SREBP1 in the liver. We show that in the presence of DHT, the SCAP-SREBP1 interaction was elevated leading to increased nuclear SREBP1 resulting in increased de novo lipogenesis. We propose that the mechanism of action may be increased AR binding to an ARE in SCAP intron-8.

Keywords: SREBP; androgen signaling; hyperandrogenemia or androgen excess; lipogenesis.


Figures

Figure 1
Figure 1
Low-dose DHT (a mouse model of normal weight PCOS) caused NAFLD. (A) Fat mass and lean mass were determined via echo MRI at 1 month after insertion (n = 6 per group). (B) Mice were weighed after DHT insertion up until the time they were killed (n = 6 per group). (C) After 3 months of low-dose DHT, the hepatic lipid content of DHT mice was significantly higher than that of control mice, as measured by oil red o staining of 5 μM sections of hepatic tissue (n = 6 per group).(D) A TG assay kit from Sigma Aldrich was used to determine the hepatic TG content in liver samples from control and DHT mice in months 1, 2, and 3 after control or DHT pellet insertion. n = 6 per group. *P < 0.05, **P < 0.01. TG, triglyceride.
Figure 2
Figure 2
Low-dose DHT lowered cytosolic SREBP1, increased SCAP-SREBP1 binding, and increased FAS in the liver, but did not alter several other pathways involved in lipid metabolism in NAFLD. At 1-month post-insertion, control and DHT mice were fasted for 16 h and livers were harvested, lysed, and subjected to Western blot analysis (A, K, and M) using the following antibodies: (B and C) SREBP1, (D) FAS, (E) p-ACC and ACC, (F and G) SREBP2, (H) SCAP, (N) ChREBP, (O) FATP2, (P) PPARγ, (Q) FxR, (R) LxR, and (S) PBEF. GADPH was used a loading control for cytosolic lysate. (I and J) Liver lysate from above was subjected to an immunoprecipitation experiment using SCAP and blotting for SREBP1. n  = 4 to 7 per group, the scatter plot dots represent each individual sample in each group. (K and L) A Western blot using cyclophilin A (CyA) antibodies was used to verify sufficient subcellular fractionation (n = 6 per group). One-way ANOVA with Tukey’s multiple comparisons was used for L and unpaired two-tailed t-tests were used comparing control to DHT for all other graphs. *P < 0.05, **P < 0.01, ****P < 0.0001. NS equals non-significant. See Table 1 for information on antibodies used for Western blots. FAS, fatty acid synthase; ACC, acetyl-CoA carboxylase; SCAP, SREBP cleavage-activating protein; SREBP1, sterol regulatory element-binding protein 1; ChREBP, carbohydrate-responsive element-binding protein; FxR, farnesoid X receptor; LxR, liver X receptor; PPARγ, peroxisomal proliferator-activated receptor gamma.
Figure 3
Figure 3
Low-dose DHT increased nuclear SREBP1 but not several other lipid metabolism nuclear proteins. At 1-month post-insertion, control and DHT mice were fasted for 16 h and livers were harvested, underwent nuclear extraction as detailed in the methods, and subjected to (A) Western blot analysis using the following antibodies: (B) FxR, (C) LxR, (D) SREBP1, (E) ChREBP, and (F) PPARγ. (G and H) TBP was used a loading control for nuclear extracts. For the subcellular fractionation control blot, Cyt = cytosol and Nuc = nuclear. n = 4 per group for B, C, D, E and F and n = 6 per group for H. The scatter plot dots represent each individual sample in each group. One-way ANOVA with Tukey’s multiple comparisons was used for H and unpaired two-tailed t-tests were used comparing control to DHT in all other graphs. *P < 0.05, ***P < 0.001. See Table 1 for information on antibodies used for Western blots. ChREBP, carbohydrate-responsive element-binding protein; FxR, farnesoid X receptor; LXR, liver X receptor; PPARγ, peroxisomal proliferator-activated receptor gamma; SREBP1, sterol regulatory element-binding protein 1; NS, non-significant.
Figure 4
Figure 4
Lipogenic mRNA expression and ChIP analysis in liver tissues of low-dose DHT mice and cell culture. At 1-month post insertion, (A) liver tissues of control and DHT mice were harvested in the fasted state and processed for qRT-PCR analysis using Trizol for RNA isolation. (B, C, D, E and F) H2.35 liver hepatocyte cells transfected with an SREBP1-overexpression (OE) vector were pretreated for 30 min with 10 μmol/L mifepristone (glucocorticoid receptor inhibitor) and/or 100 nM enzalutamide (androgen receptor inhibitor) before fresh media with or without 1 nM DHT was added for 24 h, then serum starved for 3 h, then harvested and processed for qRT-PCR analysis. (G, H and I) SREBP1-OE transfected H2.35 cells were pretreated for 30 min with 10 μmol/L betulin (SCAP inhibitor) before fresh media with or without 1 nM DHT was added for 24 h, then serum starved for 3 h, then harvested and processed for qRT-PCR analysis. (J) Liver tissue from control and DHT mice were harvested in the fasted state and then underwent AR- or IgG-ChIP analysis as described in the methods, probing for SCAP Intron 8 or SREBP1 promoter region. See Table 2 for a list of the abbreviations and functions of qRT-PCR primers. One-way ANOVA with Tukey’s multiple comparisons was used for B, C, D, E, F, G, H , I and J and unpaired two-tailed t-tests were used comparing control to DHT. n = 4 per group, the scatter plot dots represent each individual sample in each group; *P < 0.05 compared to control, and different letters represent being statistically different from each other. ACC, acetyl-CoA carboxylase; SCAP, SREBP cleavage-activating protein; SREBP1, sterol regulatory element-binding protein 1.
Figure 5
Figure 5
Proposed model: obesity-independent NAFLD in normal weight PCOS-like mouse model. (A) Here we show two proposed mechanisms by which DHT may increase hepatic lipid content. The steps are as follows: In the liver of control mice (normal physiology), SREBP1 remains in the ER via binding with SCAP and INSIG. When sterol is low (in the fed state of normal physiology (Leveille, 1969)), SCAP dissociates from INSIG and the SCAP-SREBP1 complex is translocated to the Golgi. Then, proteases, S1P and S2P, cleave SREBP1, releasing the active version of SREBP1 into the cytosol. The active SREBP1 travels to the nucleus, where it activates genes involved in lipid synthesis. In the liver of DHT mice, (1) DHT enters the cell, binds, and activates AR, (2) AR enters the nucleus and binds to intron 8 of SCAP leading to increased Scap mRNA and subsequently increased SCAP protein levels, (3) increased SCAP protein expression and increased SCAP binding to the 65 kD cleaved inactive SREBP1 leads to, (4) increased nuclear (active) SREBP1 which leads to, (5) increased lipogenic mRNA expression resulting in increased de novo lipogenesis. Overall, AR binding to intron 8 in Scap may be a mechanism leading to increased SCAP which led to SCAP-SREBP1 binding being elevated which led to increased active nuclear SREBP1 and increased lipogenic gene expression. Key: Larger green arrows indicate greater increase as compared to the thinner black arrows. The red box highlights the proposed mechanism. (B) Transcriptional control of lipogenesis and lipid metabolism in the liver: de novo lipogenesis (DNL) is known to be controlled by glucose and insulin signaling pathways, leading to increased expression of lipogenic genes. What is known: (1) Insulin stimulates the activity of SREBP1c, a transcription factor that augments lipogenic enzymes (ACC1, FAS, SCD1), via activation of LXR and several other methods not depicted (for more details see Dorotea et al. 2020). FXR lowers lipid synthesis by decreasing SREBP1c and LXRα activity, (2) glucose promotes the activity of ChREBP, another transcription factor that increases lipogenic and glycolytic (not depicted) enzymes. ChREBP is directly regulated by LXRs as well and it controls the amount of MUFA-to-SFA, creating more MUFA by activating SCD1. Glucose has also been shown to activate LXR’s genes, (3) free fatty acids (FFAs) from the serum enter the hepatocytes from fatty acid transport protein 2 (FATP2) and are incorporated into lipid droplets with the assistance of PPARγ which stimulates FA storage. What we discovered here: (4) We examined the effect of low-dose DHT on all of the genes and proteins depicted in Fig. 5B and none of them were altered by DHT except SCAP, SREBP1, FAS, and ACC. As depicted in Fig. 5A, low-dose DHT increased SCAP mRNA, protein, and binding to SREBP1 leading to increased FAS and ACC leading to increased hepatic lipid content. ACC, acetyl-CoA carboxylase; ChREBP, carbohydrate-responsive element-binding protein; FA, fatty acid; FAS, fatty acid synthase; FFAs, free fatty acids; FxR, farnesoid X receptor; LxR, liver X receptor; MUFA, monosaturated fatty acids; PPARγ, peroxisomal proliferator-activated receptor gamma; SCAP, SREBP cleavage-activating protein; SCD1, stearoyl CoA desaturase 1; SFA, saturated fatty acids; SREBP1c, sterol regulatory element-binding protein 1c; TG, triglyceride.

Similar articles

Cited by

References

    1. Amemiya-Kudo M, Shimano H, Yoshikawa T, Yahagi N, Hasty AH, Okazaki H, Tamura Y, Shionoiri F, Iizuka Y, Ohashi K, et al. 2000. Promoter analysis of the mouse sterol regulatory element-binding protein-1c gene. Journal of Biological Chemistry 275 31078–31085. (10.1074/jbc.M005353200) - DOI - PubMed
    1. Andrisse S, Childress S, Ma Y, Billings K, Chen Y, Xue P, Stewart A, Sonko ML, Wolfe A, Wu S. 2017. Low-dose dihydrotestosterone drives metabolic dysfunction via cytosolic and nuclear hepatic androgen receptor mechanisms. Endocrinology 158 531–544. (10.1210/en.2016-1553) - DOI - PMC - PubMed
    1. Andrisse S, Billings K, Xue P, Wu S. 2018. Insulin signaling displayed a differential tissue-specific response to low-dose dihydrotestosterone in female mice. American Journal of Physiology: Endocrinology and Metabolism 314 E353–E365. (10.1152/ajpendo.00195.2017) - DOI - PMC - PubMed
    1. Ayala JE, Samuel VT, Morton GJ, Obici S, Croniger CM, Shulman GI, Wasserman DH, Mcguinness OP. & NIH Mouse Metabolic Phenotyping Center Consortium 2010. Standard operating procedures for describing and performing metabolic tests of glucose homeostasis in mice. Disease Models and Mechanisms 3 525–534. (10.1242/dmm.006239) - DOI - PMC - PubMed
    1. Baranova A, Tran TP, Afendy A, Wang L, Shamsaddini A, Mehta R, Chandhoke V, Birerdinc A, Younossi ZM. 2013. Molecular signature of adipose tissue in patients with both non-alcoholic fatty liver disease (NAFLD) and polycystic ovarian syndrome (PCOS). Journal of Translational Medicine 11 133. (10.1186/1479-5876-11-133) - DOI - PMC - PubMed

Publication types

MeSH terms

Substances