. 2021 Jul 23;41(8):e0038220.
doi: 10.1128/MCB.00382-20. Epub 2021 Jul 23.

A Novel cis Regulatory Element Regulates Human XIST in a CTCF-Dependent Manner

Affiliations

A Novel cis Regulatory Element Regulates Human XIST in a CTCF-Dependent Manner

Rini Shah et al. Mol Cell Biol. .

Abstract

The long noncoding RNA XIST is the master regulator for the process of X chromosome inactivation (XCI) in mammalian females. Here, we report the existence of a hitherto-uncharacterized cis regulatory element (cRE) within the first exon of human XIST, which determines the transcriptional status of XIST during the initiation and maintenance phases of XCI. In the initiation phase, pluripotency factors bind to this cRE and keep XIST repressed. In the maintenance phase of XCI, the cRE is enriched for CTCF, which activates XIST transcription. By employing a CRISPR-dCas9-KRAB-based interference strategy, we demonstrate that binding of CTCF to the newly identified cRE is critical for regulating XIST in a YY1-dependent manner. Collectively, our study uncovers the combinatorial effect of multiple transcriptional regulators influencing XIST expression during the initiation and maintenance phases of XCI.

Keywords: CTCF; XIST; YY1; cis regulatory element; pluripotency factors.


Figures

FIG 1
FIG 1
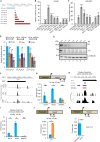
NT2/D1 and HEK293T cells provide the contexts for initiation and maintenance phases of XCI. (A) Semiquantitative RT-PCR for mature and premature XIST using cDNA prepared from HEK293T (female), NT2/D1 (male), and DLD1 (male) cells. 18S rRNA and β-actin serve as controls. (B) qRT-PCR depicting a decrease in the levels of OCT4 and NANOG and increase in PAX6 levels upon RA-mediated differentiation of NT2/D1 cells for 6 days. The x axis represents the differentiation time point, and the y axis represents the fold change normalized to 18S rRNA. Each point on the graph represents values from 5 independent experiments, and error bars represent ±standard errors of the mean (SEM). (C) Immunoblotting showing a decrease in OCT4, SOX2, and NANOG levels upon RA-mediated differentiation of NT2/D1 cells for 6 days. γ-Tubulin serves as an equal loading control. (D) qRT-PCR depicting an increase in the levels of XIST upon RA-mediated differentiation of NT2/D1 cells for 6 days. The x axis represents the differentiation time point, and the y axis represents the fold change normalized to 18S rRNA. Each point on the graph represents values from 3 independent experiments, and the error bars represent ±SEM. (E) X chromosome paint for metaphase spread and interphase nuclei from undifferentiated (0-day) and 5-day RA-treated NT2/D1 cells. RNA FISH for mature XIST for undifferentiated (0-day) and differentiating (5-day, RA) NT2/D1 cells. Arrowheads indicate the FISH signal. (F) Quantification for the RNA FISH signals in 0-day and 5-day RA-treated NT2/D1 cells. n = 3; 200 nuclei were counted for each replicate, and statistical significance was ascertained by Student’s t test.
FIG 2
FIG 2
Induction of XIST during differentiation of NT2/D1 cells is governed by the promoter as well as exon 1 of XIST. (A) The red boxes denote the fragments of the region upstream to XIST clone into pGL3 Basic luciferase reporter for testing potential promoter activity. The blue arrow indicates the first exon of XIST with the arrowhead denoting the direction of transcription and the tail indicating the TSS. The numbers flanking each red box denote the relative location of the fragment with respect to the transcription start site (TSS) of XIST. (B and C) Luciferase reporter activities for XIST promoter constructs transfected into NT2/D1 cells (B) or HEK293T (C) compared to pGL3 Basic. Firefly luciferase activities represented here are normalized to Renilla luciferase activity, which serves as an internal control. The x axis indicates DNA constructs transfected, and the y axis represents the normalized fold change in firefly luciferase activity. Each bar represents values from three independent experiments. Error bars represent ±SEM. Asterisks represent the significance over vector control per Student’s t test (****, P value < 0.0001; ***, P value < 0.001; **, P value < 0.01; ns, nonsignificant). (D) Luciferase reporter activities of +50 bp to −51 bp, +50 bp to −1,050 bp, and +50 bp to −4,408 bp promoter constructs decrease upon RA-mediated differentiation of NT2/D1 for 3 days. Firefly luciferase activities represented here are normalized to Renilla luciferase activity, which serves as an internal control. The x axis indicates differentiation time points, and the y axis represents the normalized fold change in the firefly luciferase activity. Each bar represents values from three independent experiments. Error bars represent ±SEM. Asterisks represent the significance over vector control per Student’s t test (**, P value < 0.01; *, P value < 0.05; ns, nonsignificant). (E) SP1 and YY1 proteins decrease upon RA-mediated differentiation of NT2/D1 for 6 days. γ-Tubulin serves as a loading control. (F) ChIP-seq peaks for OCT4 (SRR5642847) and NANOG (SRR5642845) for the XIST locus in human embryonic stem cell line H9 and OCT4 ChIP-seq peak for NT2/D1 cells (SRR1640282). The arrow indicates direction of XIST transcription. All peaks were confirmed to have a P value of <0.05 as reported by MACS2 callpeak function. (G) ChIP-qPCR analysis showing a decrease in OCT4, SOX2, and NANOG enrichment on the XIST at +4.5 kb (as shown in the schematic above) in undifferentiated (0-day) versus 5-day differentiated NT2/D1 cells. (H) Positive control for the ChIP of OCT4/POU5F1 in NT2D1. The positive control is selected based on the location of two existing peaks in NT2D1 cells. (I) ChIP-qPCR analysis for the control region showing enrichment of pluripotency factors on NANOG promoter. Each bar represents values from 2 independent experiments. Error bars represent the ±SEM. Asterisks represent the significance over DLD1 per Student’s t test (*, P value < 0.05; ns, nonsignificant). (J) ChIP-qPCR analysis demonstrating a change in the occupancies of YY1 on the XIST promoter-proximal region (+1.5 kb) (as shown in the schematic above) in undifferentiated (0-day) versus 5-day differentiated NT2/D1 cells. The x axis represents the immunoprecipitated factor, and the y axis represents the enrichment calculated as percent input. Each bar represents values from 2 independent experiments. Error bars represent ±SEM. Asterisks represent the significance over undifferentiated cells (0 day) per Student’s t test (*, P value < 0.05; ns, nonsignificant). (K) ChIP-qPCR analysis for YY1 on XIST promoter-proximal region (∼+1.5 kb) (as shown in the schematic above) in HEK293T (female) and DLD1 (male) cells. Each bar represents values from 3 independent experiments. Error bar represents ±SEM. Asterisks represent the significance per Student’s t test (*, P value < 0.05).
FIG 3
FIG 3
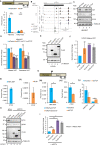
Pluripotency factors repress XIST by binding to exon 1 (+4.5 kb) site. (A) Immunoblotting to determine the knockdown efficiencies of OCT4, SOX2, and NANOG in NT2/D1 cells. β-Actin serves as an equal loading control. (B) qRT-PCR for PAX6 upon siRNA-mediated knockdown of OCT4, SOX2, and NANOG in NT2/D1 cells. The x axis represents siRNA transfected, and the y axis represents the fold change normalized to 18S rRNA. Each bar represents values from 3 independent experiments. Error bars represent the ±SEM. Asterisks represent the significance over vector control per Student’s t test (**, P value < 0.01; *, P value < 0.05; ns, nonsignificant). (C) qRT-PCR for mature XIST upon siRNA-mediated knockdown of OCT4, SOX2, and NANOG in NT2/D1 cells. The x axis represents siRNA transfected, and the y axis represents the fold change normalized to 18S rRNA. Each bar represents values from 3 independent experiments. Error bars represent the ±SEM. Asterisks represent the significance over vector control per Student’s t test (*, P value < 0.05; ns, nonsignificant). (D) Experimental scheme to overexpress OCT4, SOX2, and NANOG in NT2/D1 cells differentiated for 4 days. (E) Immunoblotting for FLAG to confirm the overexpression of OCT4, SOX2, and NANOG in NT2/D1 cells differentiated for 4 days. γ-Tubulin serves as an equal loading control. (F) qRT-PCR showing a significant reduction in mature XIST upon overexpression of pluripotency factors in NT2/D1 cells differentiated for 4 days. The x axis represents transfected DNA, and the y axis represents the fold change normalized to 18S rRNA. Each point on the graph represents values from 3 independent experiments, and error bars represent ±SEM. Asterisks represent the significance over vector control per Student’s t test (****, P value < 0.0001; ***, P value < 0.001; *, P value < 0.05). (G) Immunoblotting for FLAG to confirm the overexpression of OCT4, SOX2, and NANOG in HEK293T cells. γ-Tubulin serves as an equal loading control. (H) qRT-PCR showing a significant reduction in mature and premature XIST upon overexpression of pluripotency factors in HEK293T cells. The x axis represents the mature or premature XIST, and the y axis represents the fold change normalized to 18S rRNA. Each point on the graph represents values from 5 independent experiments, and error bars represent ±SEM. Asterisks represent the significance over vector control per Student’s t test (****, P value < 0.0001; ***, P value < 0.001; *, P value < 0.05). (I) ChIP-qPCR showing occupancies of OCT4, SOX2, and NANOG on the exon 1 (+4.5 kb) site upon their overexpression in HEK293T cells. The x axis represents the transfected DNA, and the y axis represents the enrichment calculated as percent input. Each point on the graph represents values from 2 independent experiments, and error bars represent ±SEM. Asterisks represent the significance over vector control per Student’s t test (*, P value < 0.05).
FIG 4
FIG 4
Pluripotency factor binding element is the potential cRE. (A) ChIP-qPCR analysis showing enrichment of active histone mark H3K27ac and repressive histone mark H3K27me3 for XIST cRE (+4.5 kb, as shown in the schematic above) on exon 1 in HEK293T (female, blue bar) and DLD1 (male, brown bar) cells. The x axis represents the antibodies used for ChIP, and the y axis represents the enrichment calculated as percent input. Each bar represents values from 3 independent experiments. Error bars represent ±SEM. Asterisks represent the significance over DLD1 ChIP per Student’s t test (**, P value < 0.01; ns, nonsignificant). (B) ChIP-seq peaks for OCT4 (SRR5642847) and NANOG (SRR5642845) for the XIST locus in human embryonic stem cell line H9 and OCT4 ChIP-seq peak for NT2/D1 cells (SRR1640282). CTCF ChIP-seq for male cell lines, DLD1 (DRR014660) and skin epithelium (SRR6213724), and female cell lines, MCF7 (SRR577680, SRR577679), HeLa (SRR227659, SRR227660), HEK293 (DRR014670), and skin epithelium (SRR6213076) lines. The arrowhead indicates the direction of XIST transcription, and the tail denotes the TSS. All peaks were confirmed to have a P value of <0.05 as reported by MACS2 callpeak function. (C) Immunoblotting to confirm siRNA-mediated knockdown of SP1, YY1, and CTCF in HEK293T cells. γ-Tubulin serves as an equal loading control. (D) qRT-PCR demonstrating reduction in XIST (both mature and premature) levels upon knockdown of YY1 or CTCF in HEK293T cells. The x axis represents the mature or premature XIST, and the y axis represents the fold change normalized to 18S rRNA. Each point on the graph represents values from 4 independent experiments, and error bars represent ±SEM. Asterisks represent the significance over vector control per Student’s t test (****, P value < 0.0001; **, P value < 0.01; *, P value < 0.05; ns, nonsignificant). (E) Immunoblotting to confirm overexpression of SP1, YY1, and CTCF in NT2/D1 cells. γ-Tubulin serves as an equal loading control. (F) qRT-PCR demonstrating a significant increase in XIST expression upon overexpression of YY1 or CTCF in NT2/D1 cells. The x axis represents the transfected DNA, and the y axis represents the fold change normalized to 18S rRNA. Each point on the graph represents values from 3 independent experiments, and error bars represent ±SEM. Asterisks represent the significance over vector control per Student’s t test (****, P value < 0.0001; *, P value < 0.05; ns, nonsignificant). (G) (i and ii) ChIP-qPCR analysis showing enrichment of CTCF on XIST cRE (+4.5 kb) on exon 1 in HEK293T (female (i) and DLD1 (male (ii) cells. (iii) Sequential ChIP in HEK293T cells. (iv and v) ChIP-qPCR analysis for CTCF (iv) and H3K27ac and H3K27me3 (v) upon siRNA-mediated knockdown of CTCF in HEK293T cells (siCTCF). Each bar represents values from 3 (for panel i) or 2 (for panels ii to v) independent experiments. Error bars represent ±SEM. Asterisks represent the significance per Student’s t test (*, P value < 0.05). (H) Immunoblotting for OCT4 and SOX2 upon the knockdown of OCT4 and for FLAG to confirm the overexpression of SP1, YY1, and CTCF in NT2D1 cells. γ-Tubulin serves as a loading control. (I) qRT-PCR for mature XIST upon knockdown of OCT4 and overexpression of SP1, YY1, and CTCF in NT2D1 cells. The x axis represents DNA and siRNA transfected, and the y axis represents the fold change normalized to 18S rRNA. Each bar represents values from 2 independent experiments. Error bars represent ±SEM. Asterisks represent the significance over vector control per Student’s t test (**, P value < 0.01; *, P value < 0.05; ns, nonsignificant).
FIG 5
FIG 5
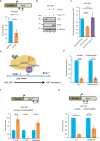
CTCF assists in the recruitment or maintenance of YY1 binding to the promoter-proximal region of XIST. (A) ChIP-qPCR analysis showing a reduction of YY1 occupancy on the promoter-proximal site (+1.5 kb) upon siRNA-mediated knockdown of CTCF in HEK293T cells (siCTCF). The x axis represents the antibody used for ChIP, and the y axis represents the normalized fold enrichment over control siRNA. Each bar represents values from 3 independent experiments. Error bars represent ±SEM. Asterisks represent the significance over YY1 ChIP for vector control per Student’s t test (*, P value < 0.05). The x axis represents the transfected siRNA, and the y axis represents the normalized fold enrichment over control siRNA. (B) Immunoblotting to confirm knockdown of CTCF and overexpression of FLAG-tagged YY1 in HEK293T cells. γ-Tubulin serves as an equal loading control. (C) qRT-PCR for mature XIST upon knockdown of CTCF and/or overexpression of FLAG-YY1 in HEK293T cells. The x axis represents the DNA and siRNA transfected, and the y axis represents the normalized fold enrichment over 18S rRNA. Each bar represents values from 2 independent experiments. Error bars represent ±SEM. Asterisks represent the significance over control (first bar) per Student’s t test (***, P value < 0.001; ns, nonsignificant). (D) Schematic depicting dCas9-KRAB-based repression strategy. (E) qRT-PCR demonstrating reduction in XIST (both mature and premature) levels upon transfecting dCas9 + sgRNA in HEK293T cells. The x axis represents the mature or premature XIST, and the y axis represents the fold change normalized to dCas9-only control. Each point on the graph represents values from 6 independent experiments, and error bars represent ±SEM. Asterisks represent the significance over vector control per Student’s t test (****, P value < 0.0001). (F) ChIP-qPCR analysis showing enrichment of dCas9, CTCF, and H3K9me3 at cRE (+4.5 kb, as shown in the schematic above) on exon 1 in HEK293T cells transfected with just dCas9 or dCas9 + sgRNA. The x axis represents the antibodies used for ChIP, and the y axis represents the enrichment calculated as percent input. Each bar represents values from 3 independent experiments. Error bars represent ±SEM. Asterisks represent the significance over dCas9 control per Student’s t test (*, P value < 0.05). (G) ChIP-qPCR analysis showing enrichment of YY1 and H3K9me3 at promoter-proximal region (+1.5 kb, as shown in the schematic above) on exon 1 in HEK293T cells transfected with just dCas9 or dCas9 + sgRNA. The x axis represents the antibodies used for ChIP, and the y axis represents the enrichment calculated as percent input. Each bar represents values from 3 independent experiments. Error bars represent ±SEM. Asterisks represent the significance over dCas9 control per Student’s t test (****, P value < 0.0001; *, P value < 0.05).
FIG 6
FIG 6
A model illustrating the role of CTCF-bound cRE in dictating the transcription from XIST promoter. (A) In undifferentiated ES cells, cRE (+4.5 kb) of XIST is bound by the pluripotency factors (OCT4, SOX2, and NANOG) keeping XIST repressed. Upon differentiation, levels as well as enrichment of pluripotency factors on the cRE decrease. Subsequently, YY1 now occupies the promoter-proximal site, leading to induction of XIST. (B) In differentiated cells, CTCF binding to cRE (+4.5 kb) enables either the recruitment or maintenance of YY1 at the promoter-proximal region, maintaining persistent expression of XIST. Abrogation of CTCF binding to cRE by CRISPR-dCas9-KRAB interference disrupts YY1 binding to the promoter-proximal region, causing downregulation of XIST.

Similar articles

Cited by

References

    1. Brockdorff N, Ashworth A, Kay GF, Cooper P, Smith S, McCabe VM, Norris DP, Penny GD, Patel D, Rastan S. 1991. Conservation of position and exclusive expression of mouse Xist from the inactive X chromosome. Nature 351:329–331. 10.1038/351329a0. - DOI - PubMed
    1. Brown CJ, Ballabio A, Rupert JL, Lafreniere RG, Grompe M, Tonlorenzi R, Willard HF. 1991. A gene from the region of the human X inactivation centre is expressed exclusively from the inactive X chromosome. Nature 349:38–44. 10.1038/349038a0. - DOI - PubMed
    1. Borsani G, Tonlorenzi R, Simmler MC, Dandolo L, Arnaud D, Capra V, Grompe M, Pizzuti A, Muzny D, Lawrence C, Willard HF, Avner P, Ballabio A. 1991. Characterization of a murine gene expressed from the inactive X chromosome. Nature 351:325–329. 10.1038/351325a0. - DOI - PubMed
    1. Lyon MF. 1961. Gene action in the X-chromosome of the mouse (Mus musculus L.). Nature 190:372–373. 10.1038/190372a0. - DOI - PubMed
    1. Kay GF, Penny GD, Patel D, Ashworth A, Brockdorff N, Rastan S. 1993. Expression of Xist during mouse development suggests a role in the initiation of X chromosome inactivation. Cell 72:171–182. 10.1016/0092-8674(93)90658-D. - DOI - PubMed

Publication types

MeSH terms

LinkOut - more resources