

Optical scatter imaging of resected breast tumor structures matches the patterns of micro-computed tomography
- PMID: 34061046
- PMCID: PMC9161376
- DOI: 10.1088/1361-6560/ac01f1
Optical scatter imaging of resected breast tumor structures matches the patterns of micro-computed tomography
Abstract
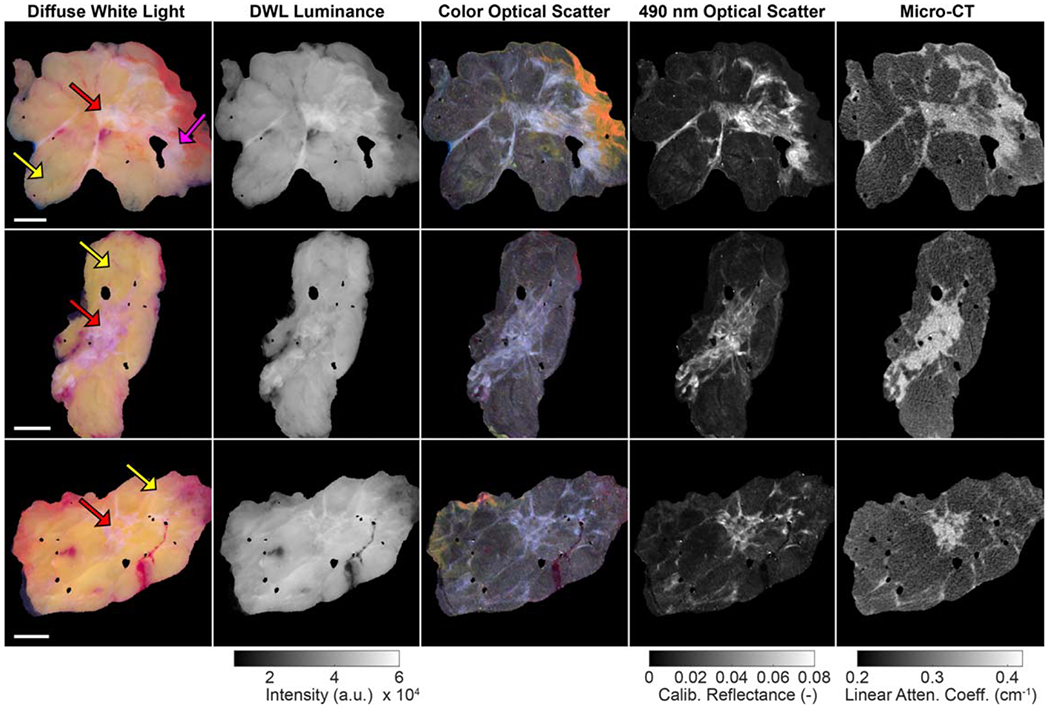
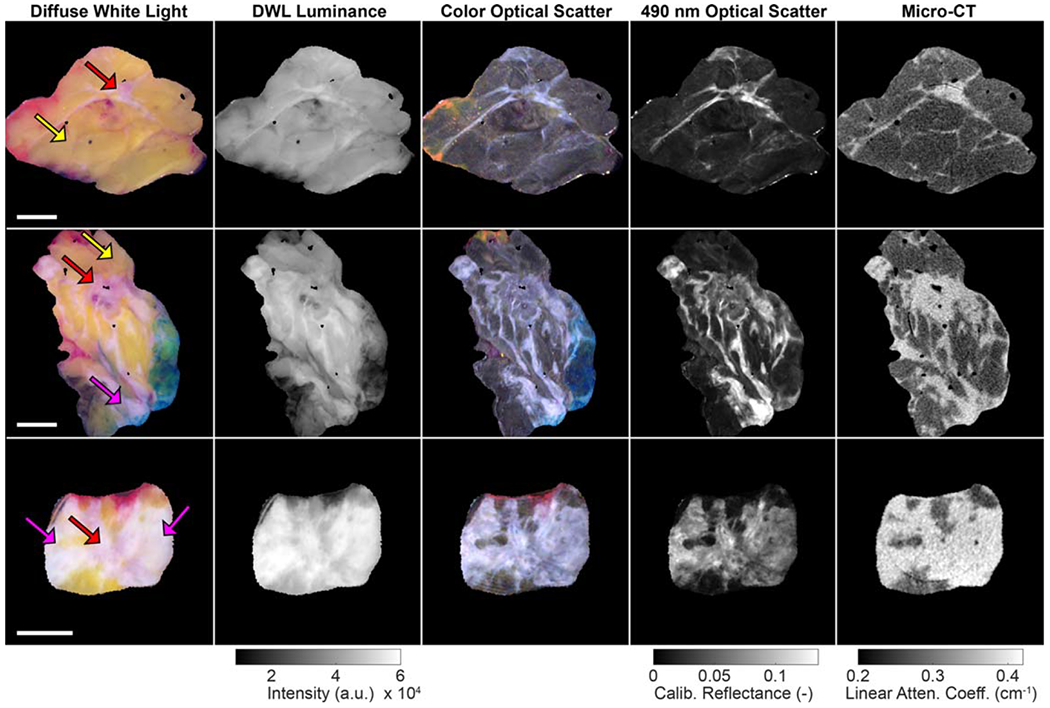
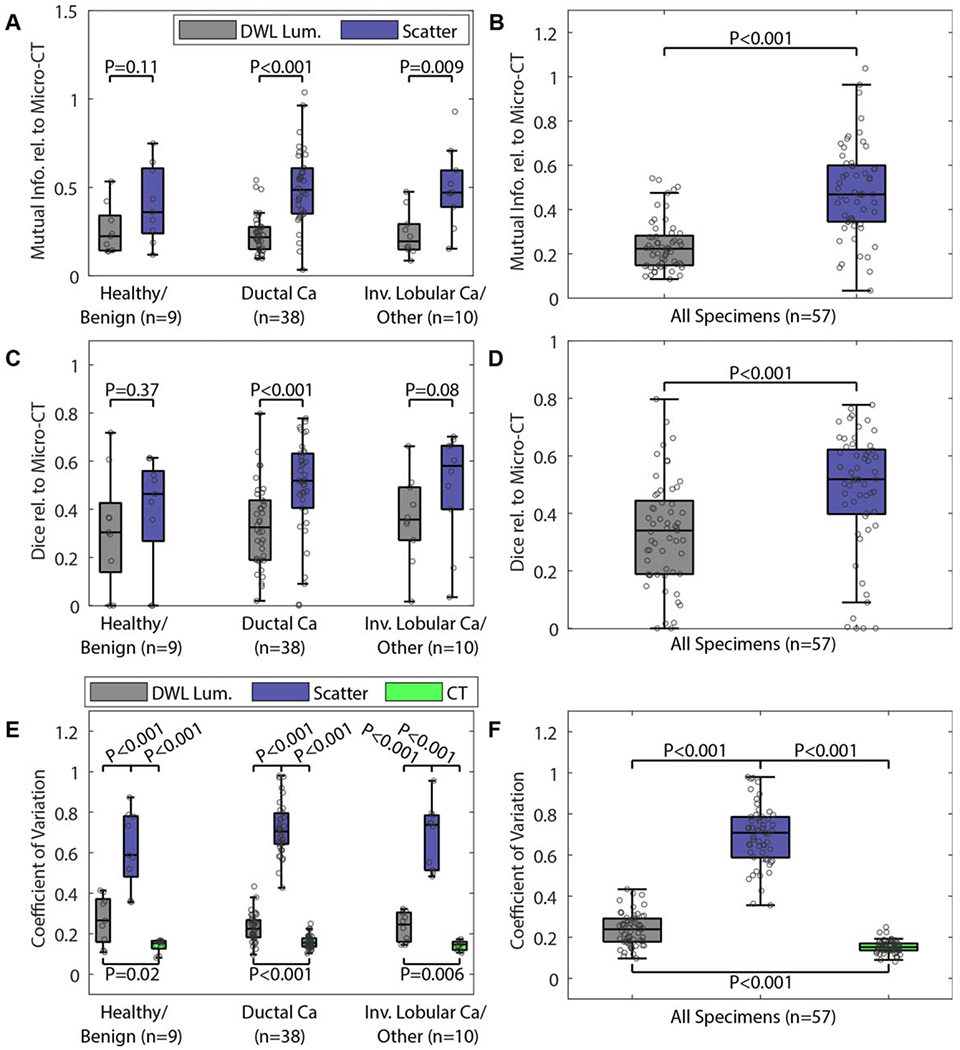
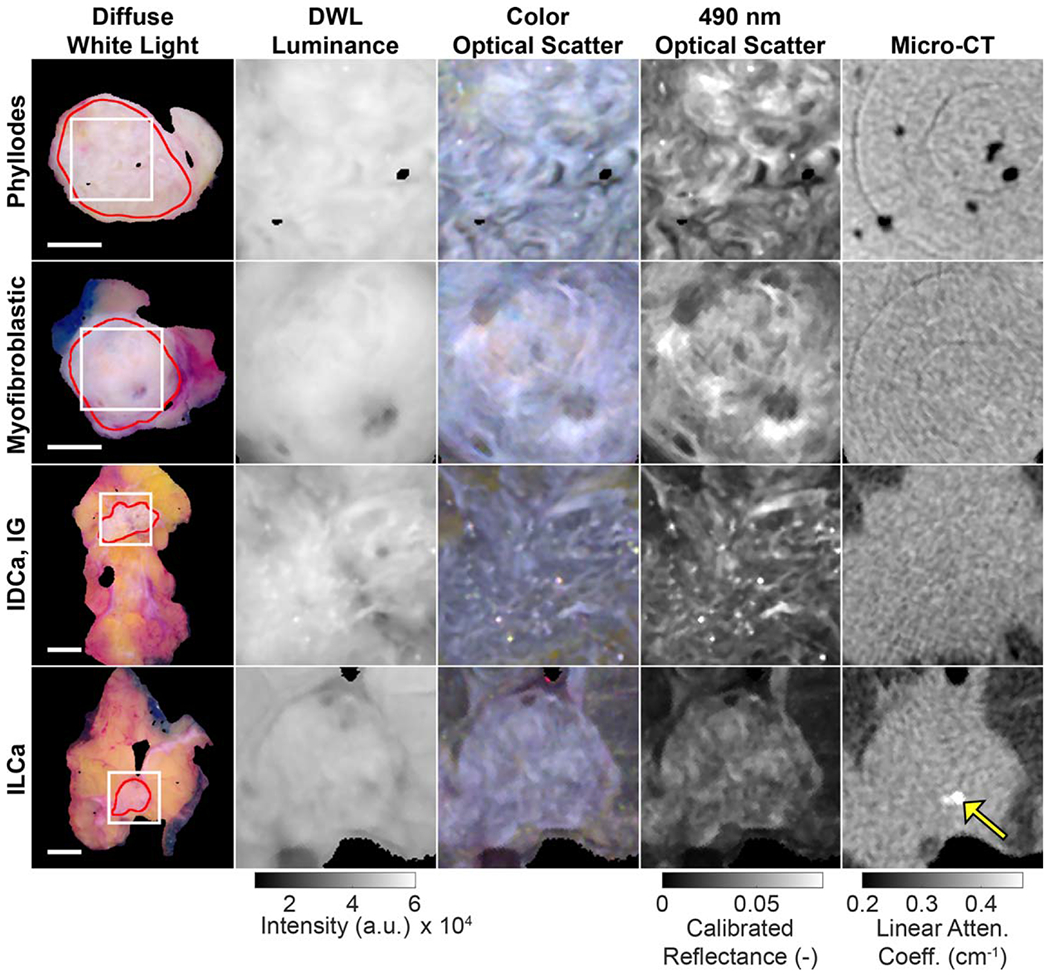
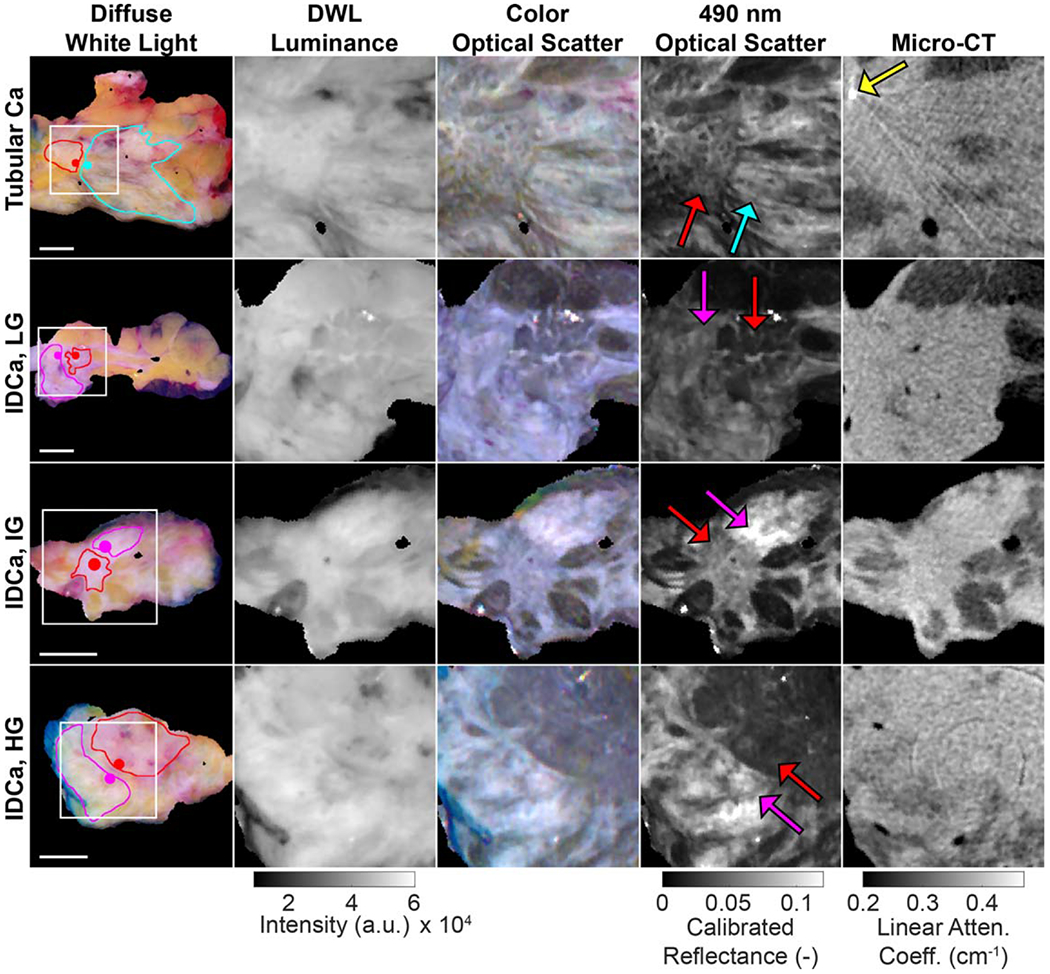
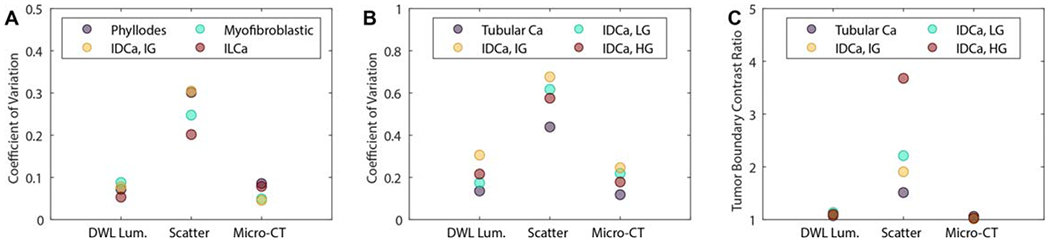
In patients undergoing breast-conserving surgery (BCS), the rate of re-excision procedures to remove residual tumor left behind after initial resection can be high. Projection radiography, and recently, volumetric x-ray imaging are used to assess margin adequacy, but x-ray imaging lacks contrast between healthy, abnormal benign, and malignant fibrous tissues important for surgical decision making. The purpose of this study was to compare micro-CT and optical scatter imagery of surgical breast specimens and to demonstrate enhanced contrast-to intra-tumoral morphologies and tumor boundary features revealed by optical scatter imaging. A total of 57 breast tumor slices from 57 patients were imagedex vivoby spatially co-registered micro-CT and optical scatter scanning. Optical scatter exhibited greater similarity with micro-CT in 89% (51/57) of specimens versus diffuse white light (DWL) luminance using mutual information (mean ± standard deviation of 0.48 ± 0.21 versus 0.24 ± 0.12;p < 0.001) and in 81% (46/57) of specimens using the Sørensen-Dice coefficient (0.48 ± 0.21 versus 0.33 ± 0.18;p < 0.001). The coefficient of variation (CV) quantified the feature content in each image. Optical scatter exhibited the highest CV in every specimen (optical scatter: 0.70 ± 0.17; diffuse luminance: 0.24 ± 01; micro-CT: 0.15 ± 0.03 for micro-CT;p < 0.001). Optical scatter also exhibited the highest contrast ratios across representative tumor boundaries with adjacent healthy/benign fibrous tissues (1.5-3.7 for optical scatter; 1.0-1.1 for diffuse luminance; 1.0-1.1 for micro-CT). The two main findings from this study were: first, optical scatter contrast was in general similar to the radiological view of the tissue relative to DWL imaging; and second, optical scatter revealed additional features associated with fibrous tissue structures of similar radiodensity that may be relevant to diagnosis. The value of micro-CT lies in its rapid three-dimensional scanning of specimen morphology, and combined with optical scatter imaging with sensitivity to fibrous surface tissues, may be an attractive solution for margin assessment during BCS.
Keywords: breast cancer; breast-conserving surgery; micro-CT; optical scatter imaging; spatial frequency domain imaging.
© 2021 Institute of Physics and Engineering in Medicine.
Figures
References
-
- American Cancer Society 2019. Breast Cancer Facts and Figures 2019–2020 (Atlanta, GA: American Cancer Society, Inc.)
-
- Balch GC, Mithani SK, Simpson JF and Kelley MC 2005. Accuracy of intraoperative gross examination of surgical margin status in women undergoing partial mastectomy for breast malignancy Am. Surg 71 22–7 - PubMed
-
- Bushberg J, Seibert J, Leidholdt E and Boone J 2012. The Essential Physics in Medical Imaging (Philadelphia, PA: Lippincott Williams & Wilkins; )
-
- Butler-Henderson K, Lee AH, Price RI and Waring K 2014. Intraoperative assessment of margins in breast conserving therapy: a systematic review Breast Edinb. Scotl 23 112–9 - PubMed
-
- Chagpar AB, Butler M, Killelea BK, Horowitz NR, Stavris K and Lannin DR 2015. Does three-dimensional intraoperative specimen imaging reduce the need for re-excision in breast cancer patients? A prospective cohort study Am. J. Surg 210 886–90 - PubMed
Publication types
MeSH terms
Grants and funding
LinkOut - more resources
Full Text Sources
Medical