. 2021 Jul 15;131(14):e146893.
doi: 10.1172/JCI146893.

TRIP13 modulates protein deubiquitination and accelerates tumor development and progression of B cell malignancies

Affiliations

TRIP13 modulates protein deubiquitination and accelerates tumor development and progression of B cell malignancies

Can Li et al. J Clin Invest. .

Abstract

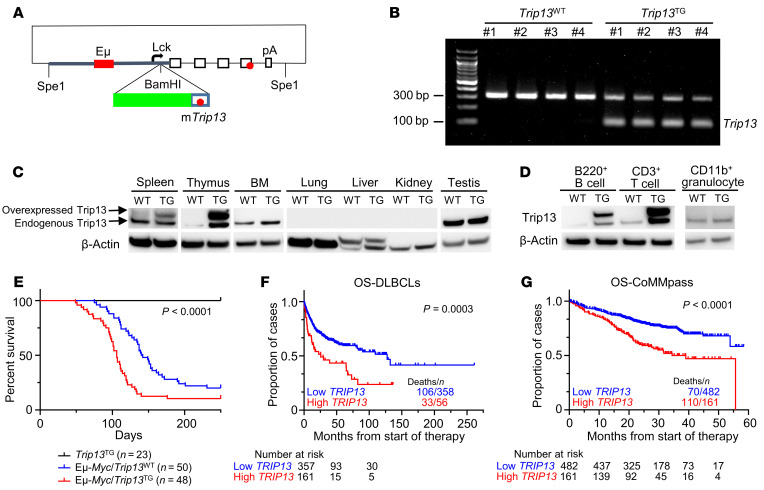
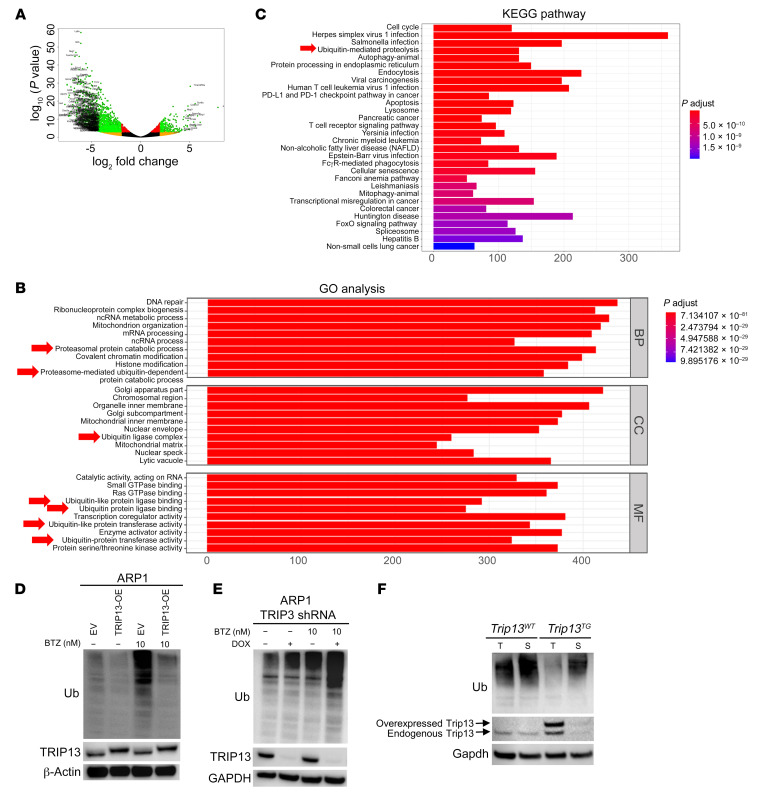
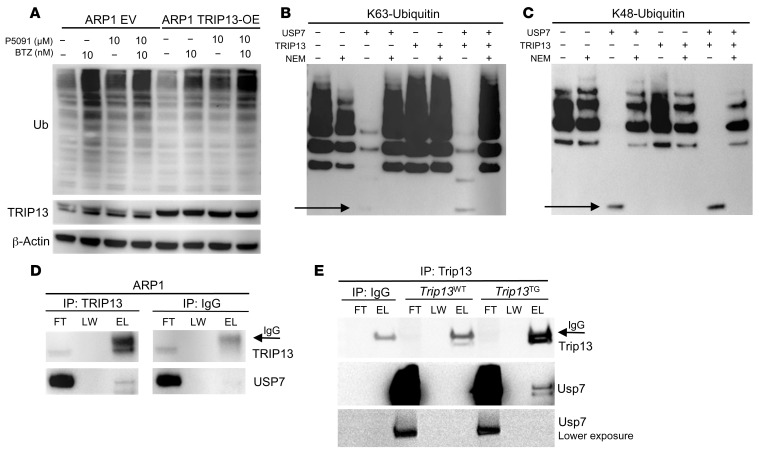
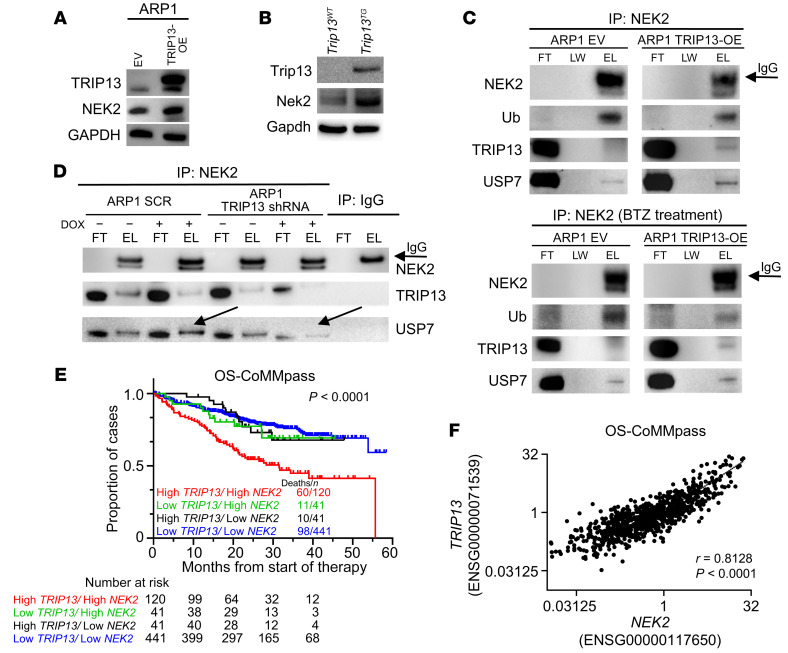
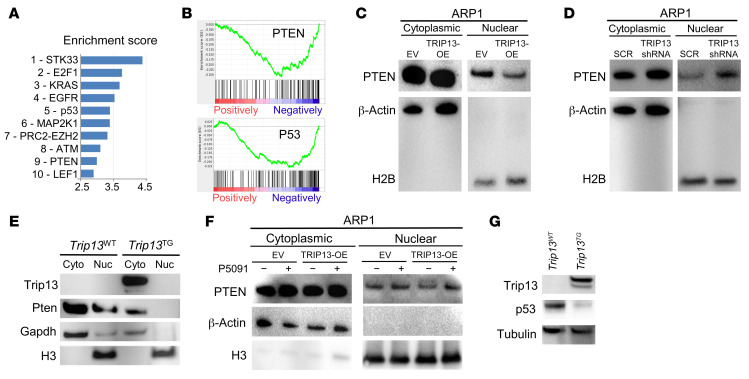
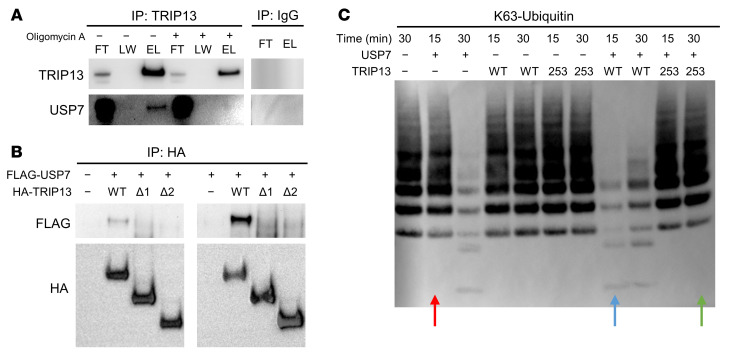
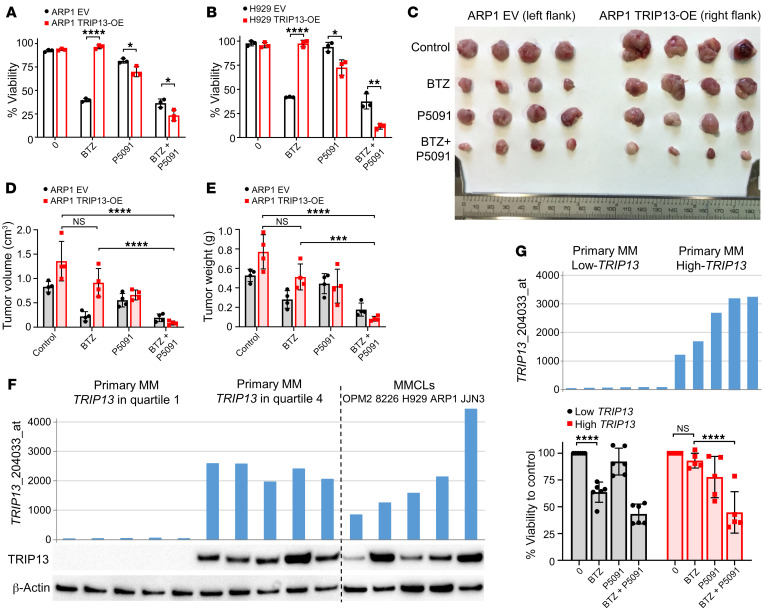
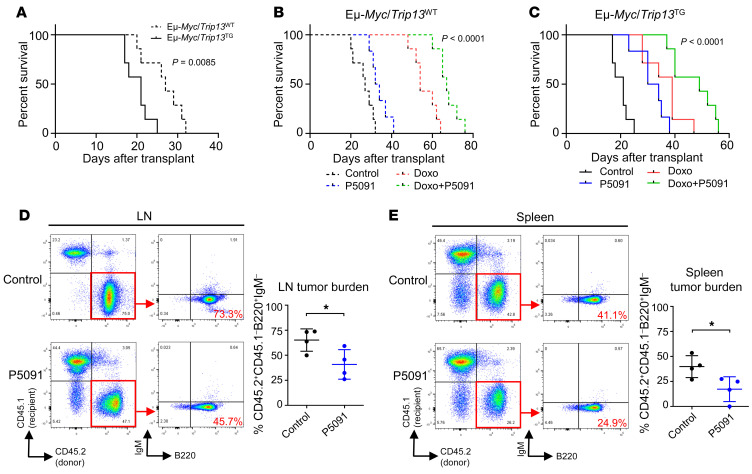
Multiple myeloma (MM), a terminally differentiated B cell malignancy, remains difficult to cure. Understanding the molecular mechanisms underlying the progression of MM may identify therapeutic targets and lead to a fundamental shift in treatment of the disease. Deubiquitination, like ubiquitination, is a highly regulated process, implicated in almost every cellular process. Multiple deubiquitinating enzymes (DUBs) have been identified, but their regulation is poorly defined. Here, we determined that TRIP13 increases cellular deubiquitination. Overexpression of TRIP13 in mice and cultured cells resulted in excess cellular deubiquitination by enhancing the association of the DUB USP7 with its substrates. We show that TRIP13 is an oncogenic protein because it accelerates B cell tumor development in transgenic mice. TRIP13-induced resistance to proteasome inhibition can be overcome by a USP7 inhibitor in vitro and in vivo. These findings suggest that TRIP13 expression plays a critical role in B cell lymphoma and MM by regulating deubiquitination of critical oncogenic (NEK2) and tumor suppressor (PTEN, p53) proteins. High TRIP13 identifies a high-risk patient group amenable to adjuvant anti-USP7 therapy.

Keywords: Drug therapy; Hematology; Oncogenes; Ubiquitin-proteosome system.


Conflict of interest statement

Conflict of interest: The authors have declared that no conflict of interest exists.

Figures

Figure 1
Figure 1. TRIP13 accelerates tumorigenesis in Eμ-Myc mouse model and is linked to poor prognosis in patients with B cell malignancies.
(A) Schematic diagram of the modified p1026x vector. Briefly, a 10.4 kb Lck-(Eμ)-mTrip13-hGH fragment was inserted into the p1026x vector by Spe1. The modified vector contains a 3.2 kb fragment of the mouse Lck proximal promoter to +37 with respect to the transcription start site (thick gray line), a 0.92 kb fragment of the immunoglobulin heavy chain intronic enhancer (Eμ) (solid red box) inserted into the Lck fragment, a 2.1 kb mutated (non-translatable) version of the human growth hormone gene (hGH) (open boxes), and the Trip13 cDNA (green box) inserted into the BamHI site of the Lck promoter fragment. The polyadenylation site of the hGH gene is indicated. Stop codons in the Trip13 cDNA and hGH genes are indicated by red circles. (B) Genotyping of Trip13-transgenic (Trip13TG) mice performed on ear tissue DNA by PCR. The 324 bp band for Trip13WT and the 100 bp band for Trip13TG are indicated. (C) Western blot analysis of Trip13 protein in different tissues of Trip13TG and Trip13WT mice. (D) Western blot analysis of Trip13 protein in B220+ B cells, CD3+ T cells, and CD11b+ granulocytes of Trip13TG and Trip13WT mice. (E) Kaplan-Meier analysis of Trip13TG (n = 23), Eμ-Myc/Trip13WT (n = 50), and Eμ-Myc/Trip13TG (n = 48) mice (P < 0.0001 by log-rank test). The number of evaluated mice is indicated in parentheses. (F) Kaplan-Meier analysis of DLBCL patients with high versus low TRIP13 (best cutoff, P = 0.0003 by log-rank test). (G) Kaplan-Meier analysis of MM patients with high (quartile 4) versus low (quartile 1–3) TRIP13 (P < 0.0001 by log-rank test).
Figure 2
Figure 2. TRIP13 enhances cellular protein deubiquitination.
(AC) Representational and pathway analysis of approximately 1900 differentially expressed genes in B cells from Eμ-Myc/Trip13TG versus Eμ-Myc/Trip13WT mice (P < 0.001) displayed in volcano plot (A) and bar graphs of GO terms (B) and KEGG pathways (C). Ubiquitin-related (Ub-related) and proteasome-related terms or pathways are indicated by red arrows. (D) Western blot analysis of Ub, TRIP13, and β-actin in EV and TRIP13-OE ARP1 cells treated overnight with or without 10 nM BTZ. (E) Western blot analysis of Ub, TRIP13, and GAPDH in ARP1 cells transfected with a doxycycline-inducible (DOX-inducible) TRIP13 shRNA, treated with or without DOX for 72 hours, followed by treatment with or without 10 nM BTZ. (F) Western blot analysis of Ub, Trip13, and Gapdh in thymus (T) and spleen (S) from Trip13TG and Trip13WT mice.
Figure 3
Figure 3. TRIP13 enhances cellular deubiquitination by binding USP7.
(A) Western blot analysis of Ub, TRIP13, and β-actin in EV and TRIP13-OE ARP1 cells treated overnight with or without 10 nM BTZ or 10 μM P5091 alone or in combination. (B and C) Western blot analysis of Ub following USP7 deubiquitination of recombinant K63-Ub or K48-Ub in the presence or absence of purified TRIP13 and N-ethylmaleimide (NEM). (D) TRIP13 immunoprecipitation (IP) in ARP1 cells. Western blots of flow-through (FT), last wash (LW), and elution (E) of the IP were probed with TRIP13 and USP7 antibodies. Arrow indicates nonspecific IgG band. (E) Trip13 IP from thymus of Trip13TG and Trip13WT mice. Western blots were probed for Trip13 and Usp7 antibodies.
Figure 4
Figure 4. TRIP13 plays a critical role in stabilizing the USP7 target NEK2.
(A and B) Western blot analysis of TRIP13, NEK2, and GAPDH in ARP1 EV and TRIP13-OE cells (A) and tissues from Trip13TG and Trip13WT mice (B). (C) NEK2 IP from ARP1 EV and TRIP13-OE cells treated with or without 10 nM BTZ for 1 hour followed by Western blot analysis of NEK2, Ub, TRIP13, and USP7. (D) NEK2 IP from ARP1 cells stably expressing scramble (SCR) or TRIP13 shRNA treated with or without DOX for 48 hours followed by Western blot analysis of NEK2, TRIP13, and USP7. Arrows indicate the reduction in USP7 signal after TRIP13 shRNA induction. (E) Kaplan-Meier analysis of MM patients with high TRIP13 and high NEK2 versus MM with one or both genes low (P < 0.0001 by log-rank test). (F) Scatterplot of NEK2 and TRIP13 gene expression intensities from the CoMMpass data set. Pearson’s correlation (r) value and corresponding P value are indicated.
Figure 5
Figure 5. TRIP13 dysregulates other USP7 targets.
(A and B) Gene set enrichment analysis (GSEA) of the 1900 most significantly differentially expressed genes in comparison of Eμ-Myc/Trip13TG and Eμ-Myc/Trip13WT B cells, showing a bar view of the top 10 pathways (A) and an enrichment plot for PTEN (top plot) and p53 pathways (bottom plot) indicating suppression of these pathways when Trip13 is overexpressed (B). (C and D) Western blot analysis of PTEN, β-actin, and histone 2B (H2B) from nuclear and cytosolic fractions of EV and TRIP13-OE ARP1 cells (C) and ARP1 cells stably transduced with SCR and TRIP13 shRNA after 72 hours of induction with DOX (D). (E) Western blot analysis of Trip13, Pten, Gapdh, and histone 3 (H3) from nuclear and cytosolic fractions of thymus from Trip13TG and Trip13WT mice. (F) Western blot analysis of PTEN, β-actin, and H3 in nuclear and cytosolic fractions from EV and TRIP13-OE ARP1 MM cells treated with 16 μM P5091 for 5 hours. (G) Western blot analysis of Trip13, p53, and tubulin in thymus tissues from Trip13TG and Trip13WT mice.
Figure 6
Figure 6. The AAA ATPase of TRIP13 is required for USP7 deubiquitinase function.
(A) TRIP13 IP of ARP1 TRIP13-OE cells treated with oligomycin A for 6 hours followed by Western blot analysis of FT, LW, and E for TRIP13 and USP7. (B) TRIP13 IP from HEK293T cells transduced with FLAG-USP7 or FLAG-USP7 and WT HA-TRIP13, truncation 1 (Δ1) HA-TRIP13, or truncation 2 (Δ2) HA-TRIP13 followed by Western blot analysis of FLAG or HA. (C) Deubiquitination time course and Western blot analysis of Ub derived from recombinant K63-Ub in the presence of recombinant USP7 with or without purified TRIP13-WT or TRIP13-E253Q mutant (“253”).
Figure 7
Figure 7. The USP7 inhibitor P5091 reduces TRIP13-induced BTZ drug resistance in MM.
(A and B) ARP1 (A) and H929 (B) EV and TRIP13-OE cells treated with or without 10 nM BTZ or 10 μM P5091 alone or in combination for 48 hours followed by cell viability determination by trypan blue staining (n = 3 per condition). (C) ARP1 EV and TRIP13-OE cells (~0.5 × 10⁶ cells per injection) were injected into the left and right flanks, respectively, of NSG mice. Mice were treated with vehicle control, BTZ (1 mg/kg, i.p., twice a week from day 7), P5091 (10 mg/kg, i.v., twice a week from day 3), and a combination. Mice were sacrificed and tumors were dissected and photographed by week 3 (n = 4 per group). (D and E) Tumor volume (D) and tumor weight (E) were measured and quantified from C. (F) TRIP13 gene expression signal is plotted on the y axis. Primary MM with TRIP13 expression in quartile 1 (n = 5) and quartile 4 (n = 5) and MM cell lines (MMCLs, n = 5) are grouped and plotted along the x axis. Corresponding TRIP13 and β-actin protein levels were analyzed from cell lysates of aliquot CD138-positive cells and MMCLs by Western blot. (G) TRIP13 gene expression signal of primary MM with low TRIP13 expression in quartile 1 (n = 6) and high TRIP13 expression in quartile 4 (n = 5) is plotted on the y axis. Corresponding CD138-positive cells were treated with or without 5 nM BTZ or 2.5 μM P5091 alone or in combination for 24 hours followed by cell viability determination by trypan blue staining. One high-TRIP13 sample was excluded because of low cell viability after thawing. Data are represented as mean ± SD. *P ≤ 0.05, **P ≤ 0.01, ***P ≤ 0.001, ****P ≤ 0.0001 by Student’s t test in A and B and by Tukey’s test for multiplicity-adjusted P values in D, E, and G.
Figure 8
Figure 8. Pharmacological inhibition of Usp7 improves survival and abrogates lymphoma growth in transplanted Myc-driven B cell lymphomas in vivo.
(A) Kaplan-Meier analysis of C57BL/6 mice with transplanted Eμ-Myc lymphoma cells (clone 1 [Trip13WT, dashed lines] and clone 2 [Trip13TG, solid lines]). (B and C) Mice with transplanted Eμ-Myc/Trip13WT (B) or Eμ-Myc/Trip13TG (C) lymphoma, treated with vehicle control (black lines), P5091 (10 mg/kg, i.v., twice a week from day 3 after transplant; blue lines), doxorubicin (Doxo; 10 mg/kg, i.p., once on day 7 after transplant; red lines), and combination (green lines) (P values between all groups of each cohort by log-rank test are indicated; n = 6–7 per group). (D and E) Representative flow cytometry plots demonstrating the loss of Eμ-Myc/Trip13TG donor lymphoma cells (CD45.2+CD45.1B220+IgM) after P5091 treatment in CD45.1+ recipient mouse lymph node (D) and spleen (E) tumor tissues. Data are represented as mean ± SD. *P < 0.05 by Student’s t test; n = 4 per group.

References

    1. Shaughnessy JD, Jr , et al. A validated gene expression model of high-risk multiple myeloma is defined by deregulated expression of genes mapping to chromosome 1. Blood. 2007;109(6):2276–2284. doi: 10.1182/blood-2006-07-038430. - DOI - PubMed
    1. Kumar SK, et al. Natural history of relapsed myeloma, refractory to immunomodulatory drugs and proteasome inhibitors: a multicenter IMWG study. Leukemia. 2017;31(11):2443–2448. doi: 10.1038/leu.2017.138. - DOI - PubMed
    1. Rajkumar SV. Multiple myeloma: 2012 update on diagnosis, risk-stratification, and management. Am J Hematol. 2012;87(1):78–88. doi: 10.1002/ajh.22237. - DOI - PMC - PubMed
    1. Barlogie B, et al. Curing myeloma at last: defining criteria and providing the evidence. Blood. 2014;124(20):3043–3051. doi: 10.1182/blood-2014-07-552059. - DOI - PMC - PubMed
    1. Hanamura I, et al. Frequent gain of chromosome band 1q21 in plasma-cell dyscrasias detected by fluorescence in situ hybridization: incidence increases from MGUS to relapsed myeloma and is related to prognosis and disease progression following tandem stem-cell transplantation. Blood. 2006;108(5):1724–1732. doi: 10.1182/blood-2006-03-009910. - DOI - PMC - PubMed

Publication types

MeSH terms

Substances