. 2021 Jun 1;17(6):e1008589.
doi: 10.1371/journal.pcbi.1008589. eCollection 2021 Jun.

Implications of diffusion and time-varying morphogen gradients for the dynamic positioning and precision of bistable gene expression boundaries

Affiliations

Implications of diffusion and time-varying morphogen gradients for the dynamic positioning and precision of bistable gene expression boundaries

Melinda Liu Perkins. PLoS Comput Biol. .

Abstract

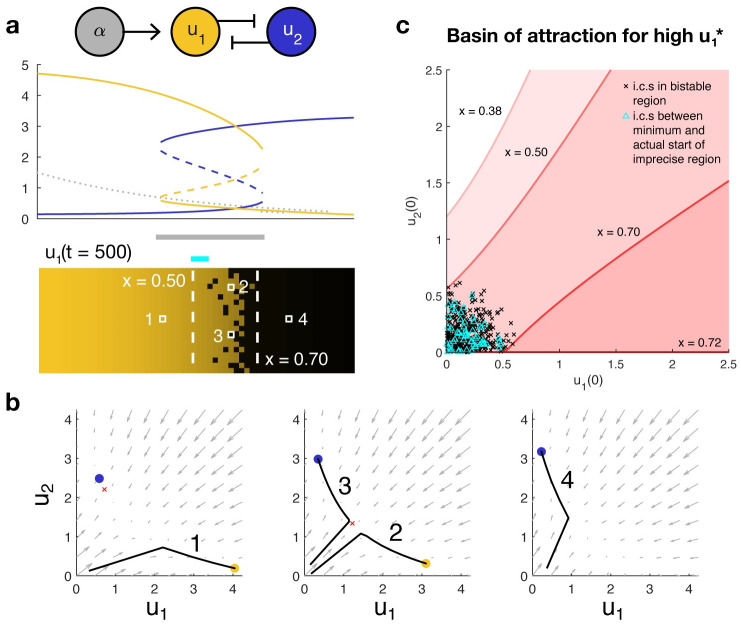
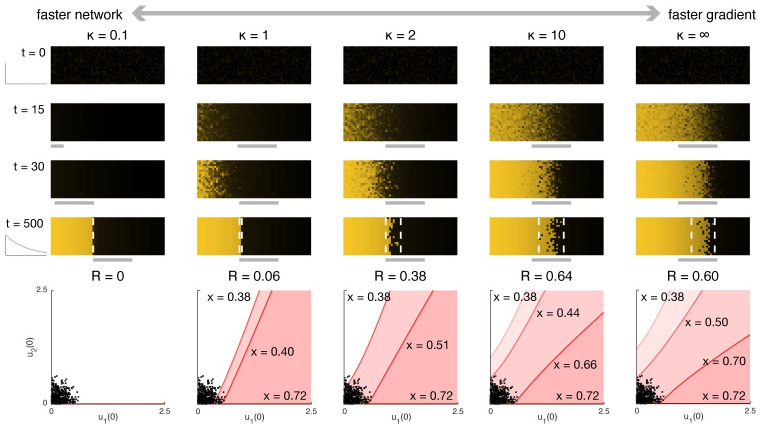
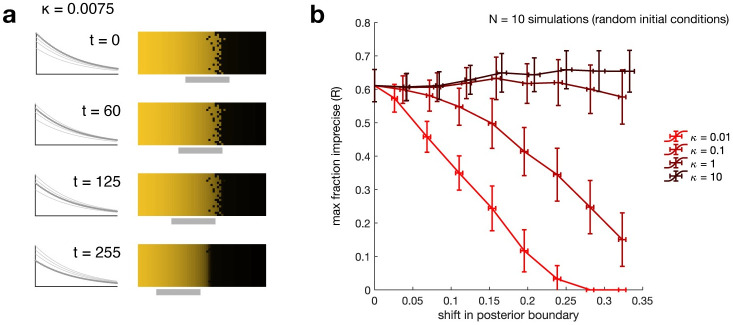
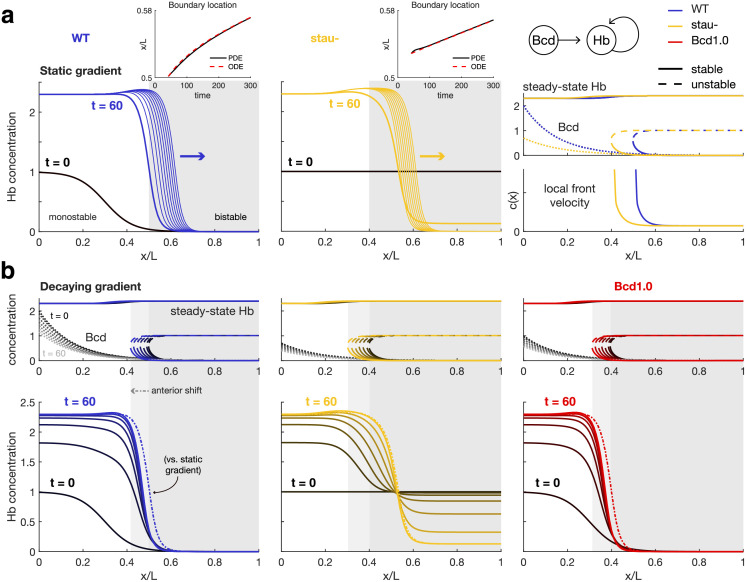
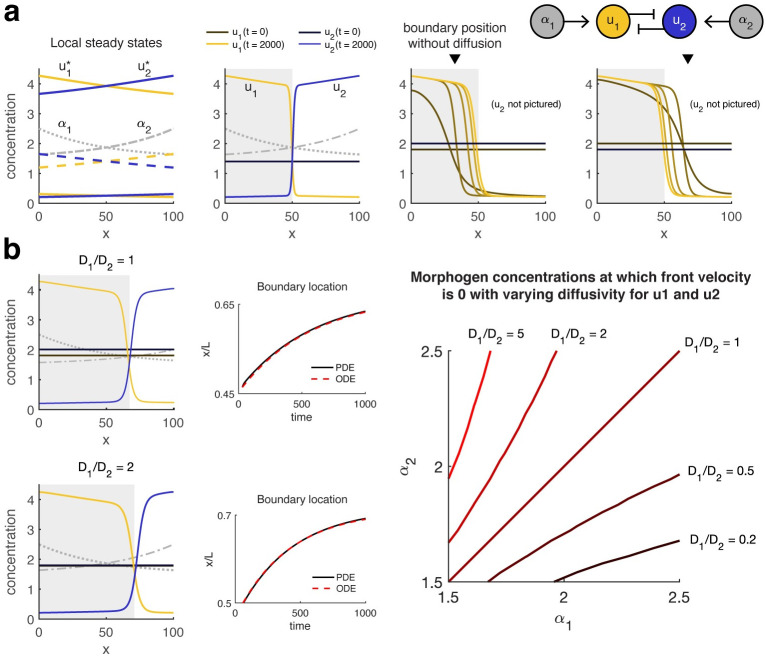
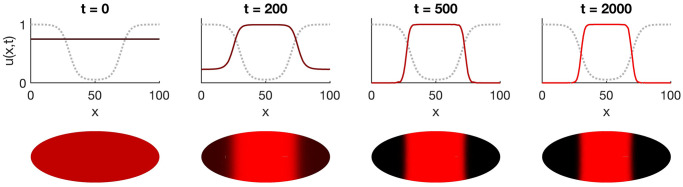
The earliest models for how morphogen gradients guide embryonic patterning failed to account for experimental observations of temporal refinement in gene expression domains. Following theoretical and experimental work in this area, dynamic positional information has emerged as a conceptual framework to discuss how cells process spatiotemporal inputs into downstream patterns. Here, we show that diffusion determines the mathematical means by which bistable gene expression boundaries shift over time, and therefore how cells interpret positional information conferred from morphogen concentration. First, we introduce a metric for assessing reproducibility in boundary placement or precision in systems where gene products do not diffuse, but where morphogen concentrations are permitted to change in time. We show that the dynamics of the gradient affect the sensitivity of the final pattern to variation in initial conditions, with slower gradients reducing the sensitivity. Second, we allow gene products to diffuse and consider gene expression boundaries as propagating wavefronts with velocity modulated by local morphogen concentration. We harness this perspective to approximate a PDE model as an ODE that captures the position of the boundary in time, and demonstrate the approach with a preexisting model for Hunchback patterning in fruit fly embryos. We then propose a design that employs antiparallel morphogen gradients to achieve accurate boundary placement that is robust to scaling. Throughout our work we draw attention to tradeoffs among initial conditions, boundary positioning, and the relative timescales of network and gradient evolution. We conclude by suggesting that mathematical theory should serve to clarify not just our quantitative, but also our intuitive understanding of patterning processes.


Conflict of interest statement

The author has declared that no competing interests exist.

Figures

Fig 1
Fig 1
(a) A bistable toggle switch can produce a gene expression boundary from a morphogen gradient. Top, the morphogen (gray) induces expression of u1 (gold), which is mutually repressive with species u2 (blue). The morphogen concentration causes the anterior (left) of the boundary to be monostable in favor of high u1 and the posterior (right) to be monostable in favor of high u2. In the bistable region of the boundary itself, the initial conditions determine whether cells express high u1 or high u2 at steady state. Middle, a bifurcation diagram indicates the value of the steady states, with solid lines indicating stability and dashed lines, instability. Bottom, a heat map of u1 concentration at steady state showcases how variation in initial conditions among rows may result in an imprecise boundary in the bistable region. (b) Phase portraits at different x coordinates along the embryo predict how trajectories evolve over time. Gray arrows indicate the direction in which a trajectory will travel. Solid dots indicate stable steady states favoring high u1 (gold) or high u2 (blue). The unstable middle point in the bistable region is denoted by a red ×. Black lines are example trajectories corresponding to the cells labeled above. (c) The boundaries of the imprecise region are determined by the basins of attraction that bound the initial conditions. Red shaded regions beneath each red curve denote the sets of initial conditions that will converge to the state with high u1* at a fixed coordinate x. Black × denote the initial conditions of all cells in the bistable region. The distance between the lowest and highest x that most tightly bounds these conditions (here, xa = 0.50 and xp = 0.70) is the most conservative estimate of the width of the imprecise region. The actual distribution of initial conditions may cause the actual width of the region to be smaller; for example, here, the initial conditions for the anteriormost cells within the bistable region (cyan △) are upper bounded by a higher x than are the black ×.
Fig 2
Fig 2. The precision of a gene expression boundary forming atop a dynamically growing gradient depends on the relative rates at which the network and the gradient evolve.
The control (static gradient) corresponds to κ = ∞. Top, time lapses illustrating the concentration of u1 across a whole embryo. Assuming the gradient emerges from a uniformly monostable state (here with α(t = 0, x) = 0), then the slower the gradient emerges, the more precise the resulting boundary will be. Boundary formation lags the movement of the bistable region from anterior to posterior. Bottom, the width of the imprecise region can be predicted from the basins of attraction at each coordinate x; see Fig 1. R quantifies the maximum width of the imprecise region (which depends on the initial conditions) relative to the width of the bistable region, with lower R indicating higher precision. That R is higher for κ = 10 relative to κ = ∞ is an artifact of the particular choice of initial conditions, which are shared across all simulations pictured here.
Fig 3
Fig 3
(a) Temporal decrease in the morphogen concentration at every point in space can “sweep away” imprecision in the expression boundary. Decrease in morphogen concentration causes the bistable region (solid gray line) to shift anteriorly over time. Thus, cells to the anterior are initially monostable for high u1* and remain there as they become bistable, whereas cells in the initially bistable region become monostable for high u2*. The initial conditions here are derived from the steady-state solution to a system with a static gradient equivalent to that of the dynamic gradient at t = 0; see Fig 2 with κ = ∞. (b) Slower gradient dynamics are more effective at increasing precision. Lines are mean, error bars are standard deviation across N = 10 simulations with different initial conditions at different values of κ (light to dark red), the ratio between rate of gradient decay and rate of convergence to steady state. R quantifies the maximum width of the imprecise region relative to the width of the bistable region at the time tf by which the boundary has shifted by a fixed amount from its initial location. Lower R corresponds to greater precision (see text). Slower-decaying gradients produce more precise boundaries for the same total shift than do faster-decaying gradients, but take longer to achieve these gains.
Fig 4
Fig 4
(a) In the posterior of the embryo, the Hb boundary behaves as a bistable propagating wavefront. Simulations (left, middle) and bifurcation diagrams (right) of the Hb patterning system with a static Bcd gradient show that the Hb gene expression boundary becomes a propagating bistable wavefront toward the posterior of the embryo (gray shaded region) and would continue to propagate slowly thereafter (thin lines) if not for external influences such as downstream genetic networks, cellularization, or gastrulation. Blue indicates wild-type (WT) and gold, stau- mutant. Right, the Bcd gradient for stau- (gold dotted line) has lower amplitude than that of the WT Bcd gradient (blue dotted line), which shifts the bifurcation (critical) point anteriorly. The local front velocity calculated from Eq (13) rapidly decreases posterior to the critical point but remains strictly positive, indicating that a bistable gene expression boundary will propagate posteriorly. The Bcd1.0 bifurcation diagram (see (b)) is almost identical to that of stau-. Top insets compare boundary location from PDE simulations (solid black) to the location from an ODE approximation (red dashed) derived from the local front velocities, with ϵ equal to a quarter of the boundary width. Simulation start t = 0 is 10 min before the beginning of nc14. (b) Decay in the Bcd gradient shifts the bistable region anteriorly over time, causing boundaries to stabilize at slightly anterior positions. Bottom, there is a greater discrepancy between boundaries forming over dynamic (solid lines) vs. static (dash-dot line) in the WT (blue) and Bcd1.0 (red) mutant than the stau- (gold) mutant due to differences in front emergence. Specifically, homogeneous initial conditions below the maximum value of the unstable steady state cause the boundary in the stau- mutant to appear within the bistable region, such that boundary propagation continues at roughly the same speed regardless of gradient dynamics. In contrast, in WT and Bcd1.0 the boundary is preinduced anterior to the critical point. A decrease in morphogen concentration in time causes the boundary to reach the critical point sooner, but also reduces the total time spent by the boundary in the region of rapid propagation, resulting in more anterior placement relative to the static case. All parameters are as given in [40].
Fig 5
Fig 5
(a) Diffusion permits a bistable gene expression boundary to be accurately placed independently of initial conditions. Left, bifurcation diagram and right, simulation results for Eq (19) with a = 1.7, β = 0.35, D1 = D2 = 1, na = nr = 2, Ka = 0.75, Kr = 1, and α1(x), α2(x) as shown. Gray shaded region indicates rightward propagation of the front in u1 (gold) and leftward for the front in u2 (blue), with lighter shades indicating later time points. Regardless of the initial condition, the boundary propagates toward the point where the toggle switch is “balanced” (the local steady states are such that u1*=u2*). Inverted black triangle indicates the position of a gene expression boundary with the same initial conditions when gene products do not diffuse. For clarity, only u1 is pictured in the third and fourth plots. (b) Imbalance in gradients or diffusivities may shift the location of the boundary. Right, when D1 = D2 (top), the boundary localizes where α1(x) = α2(x). Letting D1 = 2 = 2D2 (bottom) shifts the localization point in favor of higher u1. Middle, ODE approximations from the time of boundary formation produce an error less than 0.5% embryo width in predicting boundary location. Simulations are shown for ϵ = 0 (D1 = D2) or ϵ = −0.5 (D1 = 2D2). Right, changing the diffusion ratio shifts the nullcline for front velocity toward lower concentrations of the faster-diffusing species. Decreasing the diffusivity also decreases the width (increases the steepness) of the respective front (S2 Appendix).
Fig 6
Fig 6. Fronts may localize at multiple points in a domain, resulting in more complicated patterns.
Simulations were performed on the 1D model in S2 Appendix with a = 0.1, D = 0.1 on a 2D reaction domain (bottom) in which the bifurcation parameter α(x) varies only along the horizontal axis (gray dashed line). Top, horizontal cross-sections through the midline show that two opposing fronts appear and propagate toward the nearest localization point, resulting in refinement of a stripe pattern from either direction over time.

Similar articles

Cited by

References

    1. Rogers KW, Schier AF. Morphogen gradients: from generation to interpretation. Annual Review of Cell and Developmental Biology. 2011;27:377–407. doi: 10.1146/annurev-cellbio-092910-154148 - DOI - PubMed
    1. Briscoe J. Understanding Pattern Formation in Embryos: Experiment, Theory, and Simulation. Journal of Computational Biology. 2019;26(0):1–7. - PubMed
    1. Driever W, Nüsslein-Volhard C. The bicoid protein determines position in the Drosophila embryo in a concentration-dependent manner. Cell. 1988;54:95–104. doi: 10.1016/0092-8674(88)90183-3 - DOI - PubMed
    1. Ferguson EL, Anderson KV. decapentaplegic acts as a morphogen to organize dorsal-ventral pattern in the Drosophila embryo. Cell. 1992;71:451–461. doi: 10.1016/0092-8674(92)90514-D - DOI - PubMed
    1. Sampath K, Rubinstein AL, Cheng AMS, Liang JO, Fekany K, Solnica-Krezel L, et al.. Induction of the zebrafish ventral brain and floorplate requires cyclops/nodal signalling. Nature. 1998;395:185–189. doi: 10.1038/26020 - DOI - PubMed

Publication types

LinkOut - more resources