. 2021 Jun 1;17(6):e1008996.
doi: 10.1371/journal.pcbi.1008996. eCollection 2021 Jun.

Growth rules for the repair of Asynchronous Irregular neuronal networks after peripheral lesions

Affiliations

Growth rules for the repair of Asynchronous Irregular neuronal networks after peripheral lesions

Ankur Sinha et al. PLoS Comput Biol. .

Abstract

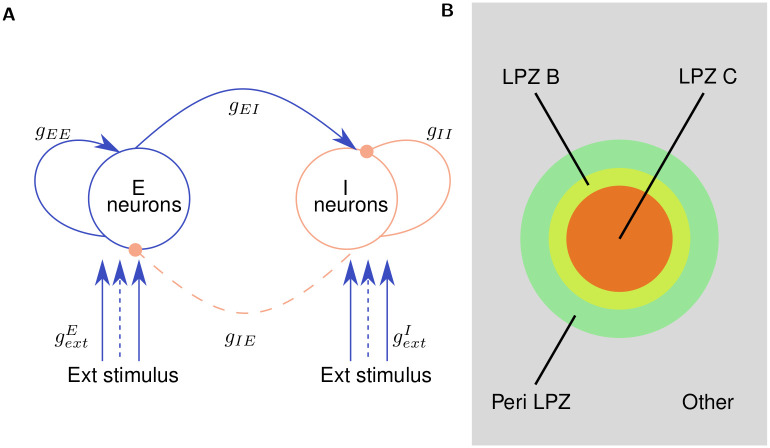
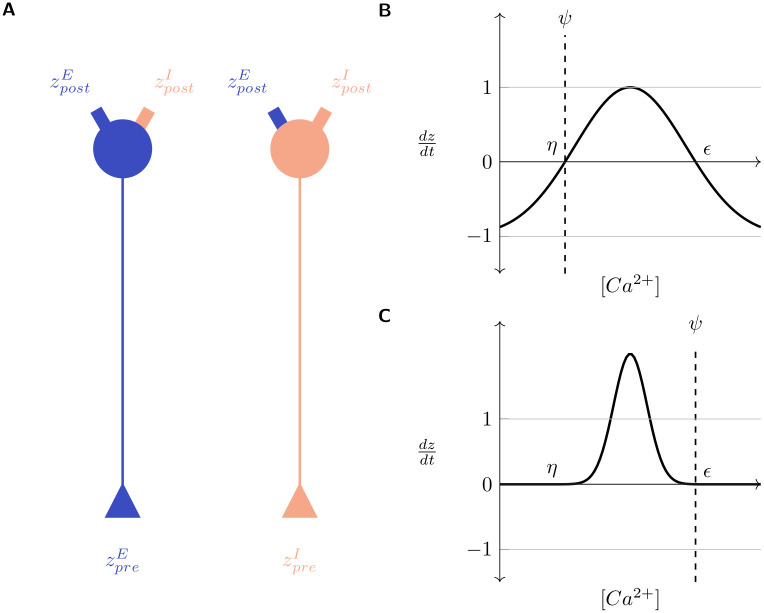
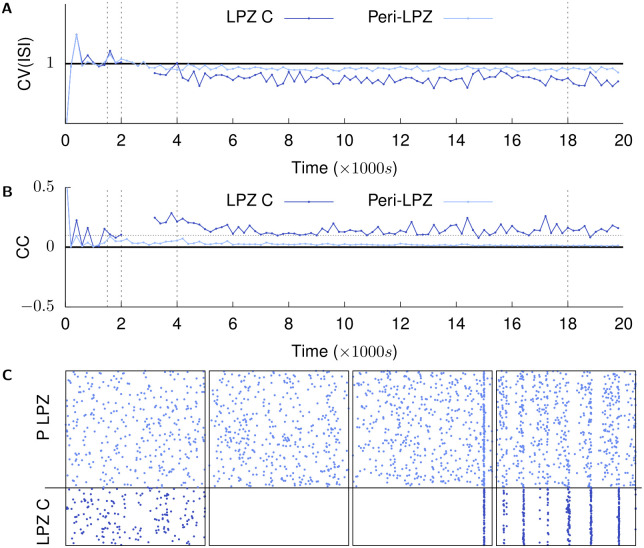
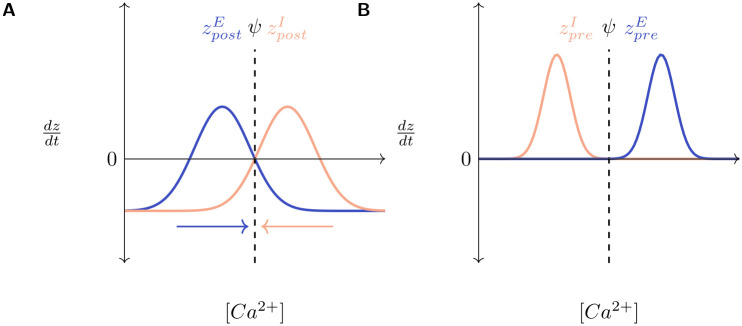
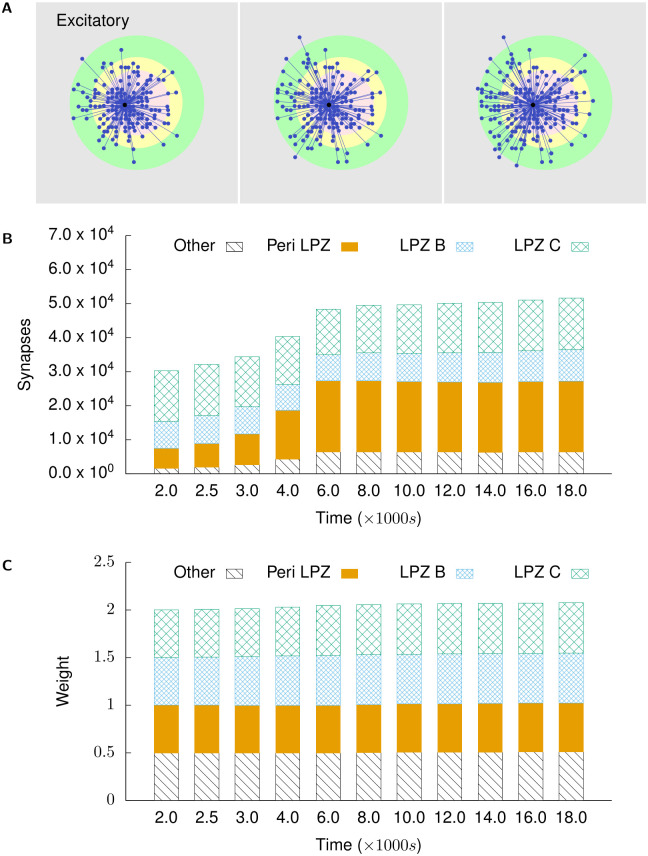
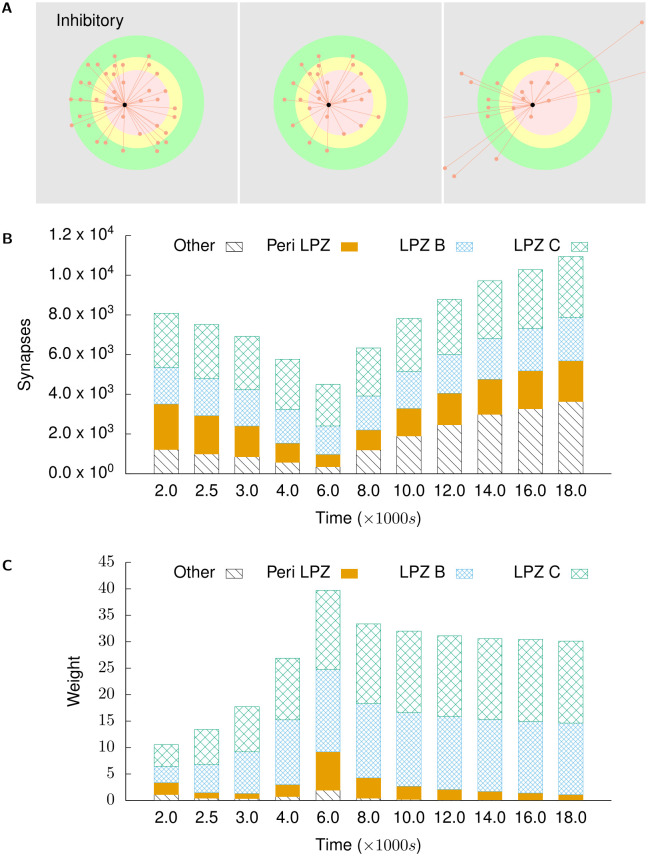
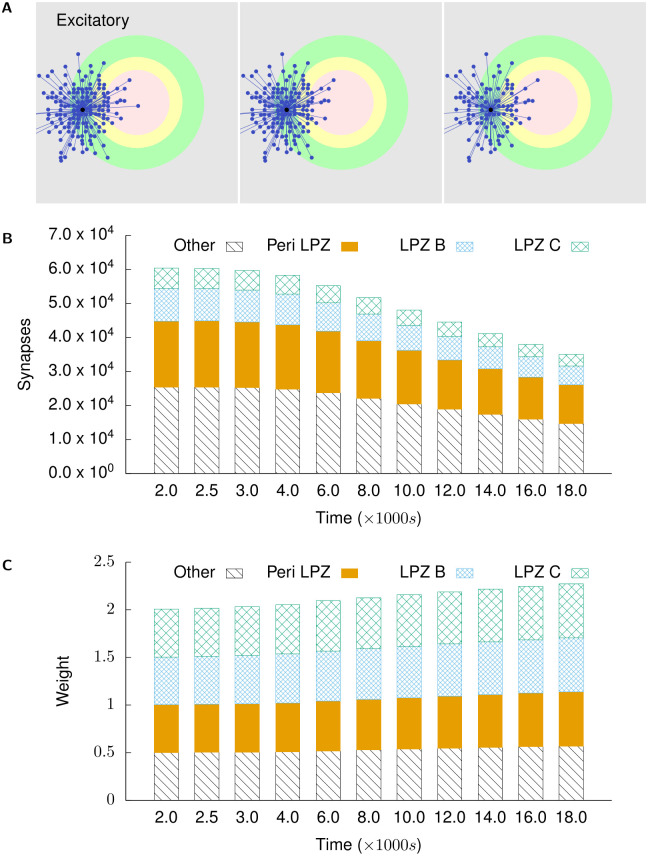
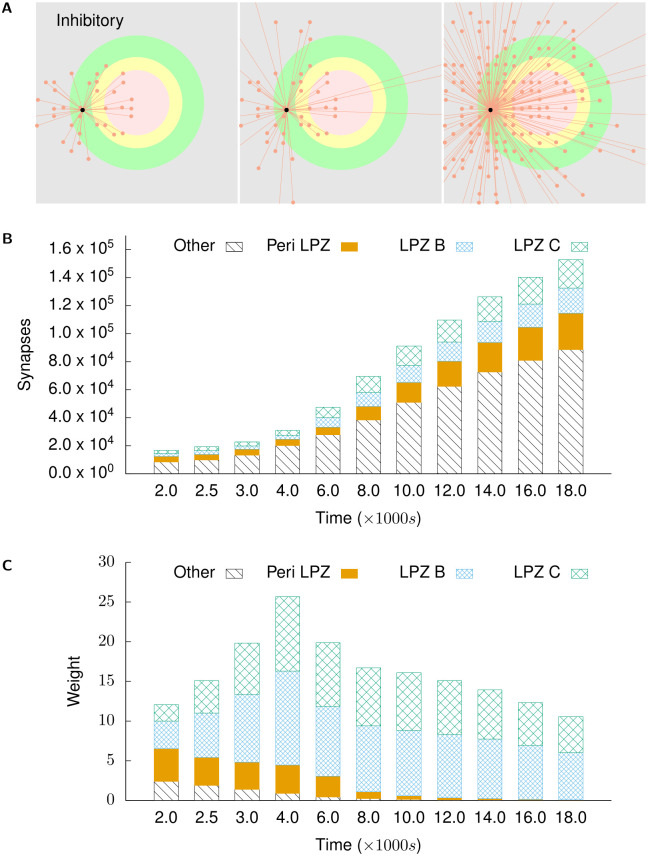
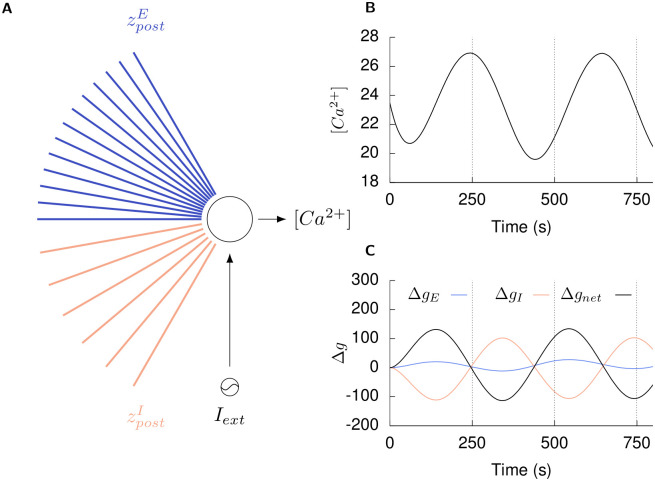
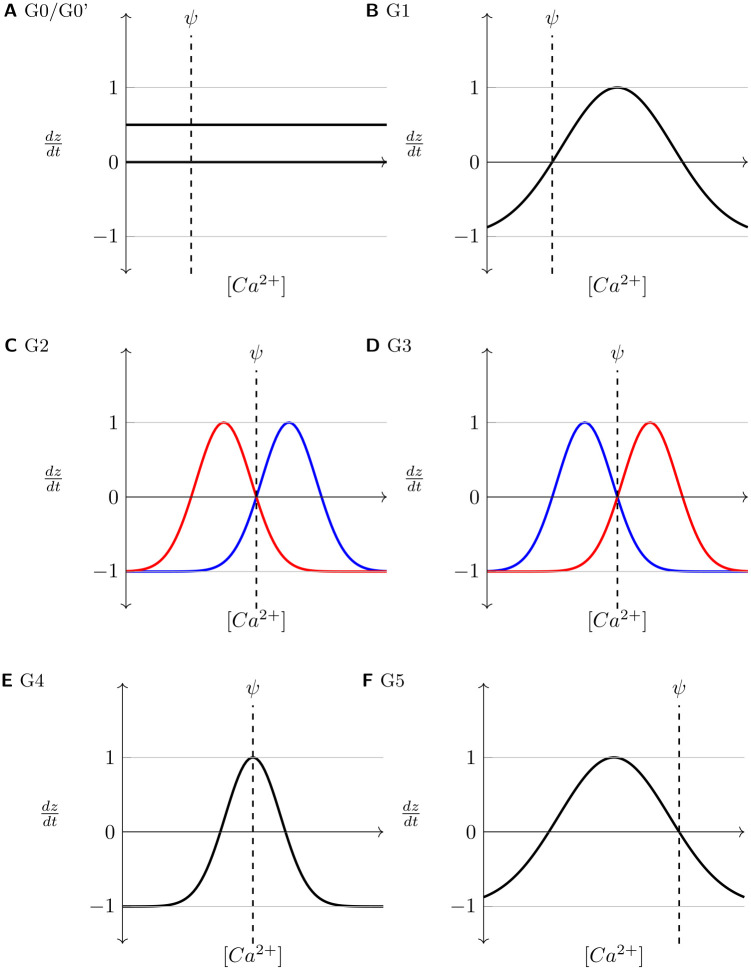
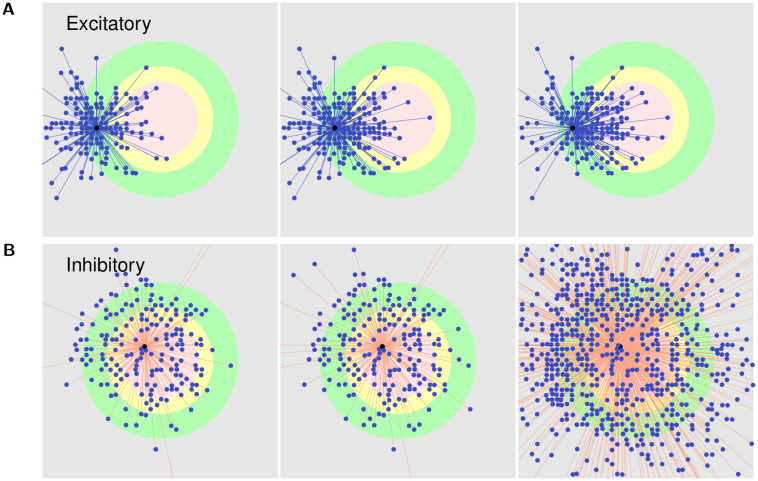
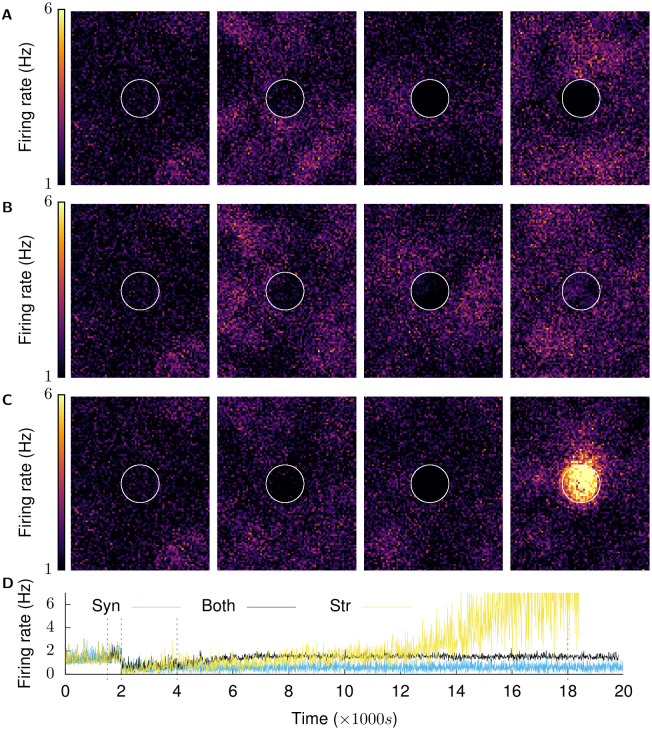
Several homeostatic mechanisms enable the brain to maintain desired levels of neuronal activity. One of these, homeostatic structural plasticity, has been reported to restore activity in networks disrupted by peripheral lesions by altering their neuronal connectivity. While multiple lesion experiments have studied the changes in neurite morphology that underlie modifications of synapses in these networks, the underlying mechanisms that drive these changes are yet to be explained. Evidence suggests that neuronal activity modulates neurite morphology and may stimulate neurites to selective sprout or retract to restore network activity levels. We developed a new spiking network model of peripheral lesioning and accurately reproduced the characteristics of network repair after deafferentation that are reported in experiments to study the activity dependent growth regimes of neurites. To ensure that our simulations closely resemble the behaviour of networks in the brain, we model deafferentation in a biologically realistic balanced network model that exhibits low frequency Asynchronous Irregular (AI) activity as observed in cerebral cortex. Our simulation results indicate that the re-establishment of activity in neurons both within and outside the deprived region, the Lesion Projection Zone (LPZ), requires opposite activity dependent growth rules for excitatory and inhibitory post-synaptic elements. Analysis of these growth regimes indicates that they also contribute to the maintenance of activity levels in individual neurons. Furthermore, in our model, the directional formation of synapses that is observed in experiments requires that pre-synaptic excitatory and inhibitory elements also follow opposite growth rules. Lastly, we observe that our proposed structural plasticity growth rules and the inhibitory synaptic plasticity mechanism that also balances our AI network both contribute to the restoration of the network to pre-deafferentation stable activity levels.


Conflict of interest statement

The authors have declared that no competing interests exist.

Figures

Fig 1
Fig 1. Overview of the model.
(A) Excitatory (E) and Inhibitory (I) neurons (NE = 4NI (see Methods)) are initially connected via synapses with a connection probability of (p = 0.02). All synapses (EE, EI, II), other than IE synapses, which are modulated by inhibitory spike-timing dependent plasticity, are static with conductances gEE, gEI, gII, respectively. All synapse sets are modifiable by the structural plasticity mechanism. External Poisson spike stimuli are provided to all excitatory and inhibitory neurons via static synapses with conductances gextE and gInhI, respectively. To simulate deafferentation, the subset of these synapses that project onto neurons in the Lesion Projection Zone (LPZ) (represented by dashed lines in the figure) are disconnected. (B) Spatial classification of neurons in relation to the LPZ: LPZ C (centre of LPZ) consists of 2.5% of the neuronal population; LPZ B (inner border of LPZ) consists of 2.5% of the neuronal population; Peri-LPZ (outer border of LPZ) consists of 5% of the neuronal population; Other neurons consist of the remaining 90% of the neuronal population. (Figure not to scale).
Fig 2
Fig 2. Gaussian growth curves modulate the rate of turnover of synaptic elements (dzdt) in a neuron as a function of its [Ca2+].
(A) Excitatory: Blue; Inhibitory: Red; All neurons possess excitatory and inhibitory post-synaptic elements (zpostE,zpostI) but excitatory and inhibitory neurons can only bear excitatory and inhibitory pre-synaptic elements, respectively (zpreE,zpreI); (B) and (C). Example Gaussian growth curves. Constants η and ϵ control the width and positioning of the growth curve on the x-axis. ω (see Eq 1) controls the positioning of the growth curve on the y-axis. ν (see Eq 1) is a scaling factor. ψ is the optimal [Ca2+] for the neuron. The minimum and maximum values of dz/dt can be analytically deduced to be −νω and ν(2 − ω) respectively (see Methods). The relationship between η, ϵ, and ψ regulates the activity dependent dynamics of neurites. (B) ψ = η = 5.0, ϵ = 15.0, ν = 1.0, ν = 1.0, −νω = −1.0, ν(2 − ω) = 1.0 (see Methods). Here, new neurites are formed when the neuronal activity exceeds the required level and removed when it falls below it. (C) η = 5.0, ψ = ϵ = 15.0, ν = 1.0, ω = 0.001, −νω = −0.001, ν(2 − ω) = 1.999 (see Methods). Here, the growth curve is shifted up along the y-axis by decreasing the value of ω. New neurites are formed when the neuronal activity is less than the homeostatic level and removed (at a very low rate) when it exceeds it.
Fig 3
Fig 3. Recovery of activity over time.
(Mean firing rates of neurons are calculated over a 2500 ms window and plotted in 100 ms increments.). (A) shows the firing rates of the whole excitatory population at t = {1500 s, 2001.5 s, 4000 s, and 18,000 s}. These are marked by dashed lines in the next graphs. The LPZ is indicated by white circles here and in following figures. (B) shows mean firing rate of neurons in LPZ-C; (C) shows mean firing rate of neurons in peri-LPZ; The network is permitted to achieve its balanced Asynchronous Irregular (AI) low frequency firing regime under the action of inhibitory synaptic plasticity (t ≤ 1500 s). Structural plasticity is then activated at all neurites—pre-synaptic and post-synaptic, excitatory and inhibitory—to confirm that the network remains in its balanced AI state (panel 1 in A). At (t = 2000 s), neurons in the LPZ are deafferented (panel 2 in A is at t = 2001.5 s) and the network allowed to repair itself under the action of our structural plasticity mechanism (panels 3 (t = 4000 s) and 4 (t = 18,000 s) in A).
Fig 4
Fig 4. Recovery of activity over time: population firing characteristics.
(A) shows the coefficient of variation (CV) of the inter-spike intervals of neurons in the LPZ-C and peri-LPZ. (B) shows the average pairwise cross-correlation between neurons in the LPZ-C and peri-LPZ calculated over 5 ms bins [43]. (dotted horizontal line is y = 0.1); (C) shows spike times of neurons in the LPZ C and peri-LPZ over a 1 s period at t = {1500 s, 2001.5 s, 4000 s, 18,000 s}. The network is permitted to achieve its balanced Asynchronous Irregular (AI) low frequency firing regime under the action of inhibitory synaptic plasticity (t ≤ 1500 s). At (t = 2000 s), neurons in the LPZ are deafferented (panel 2 in B is at t = 2001.5 s) and the network allowed to repair itself under the action of our structural plasticity mechanism (panels 3 (t = 4000 s) and 4 (t = 18,000 s) in B). As can be seen here, the network does not return to its AI state after repair (graphs are discontinuous because ISI CV and CC are undefined in the absence of spikes).
Fig 5
Fig 5. Activity-dependent dynamics of synaptic elements (dz/dt) as functions of a neuron’s time averaged activity ([Ca2+]).
(A) post-synaptic elements: Post-synaptic elements of a neuron react to deviations in activity from the optimal level (ψ) by countering changes in its excitatory or inhibitory inputs to restore its E-I balance. For both excitatory and inhibitory neurons, excitatory post-synaptic elements sprout when the neuron experiences a reduction in its activity, and retract when the neuron has received extra activity. Thus, the stable fixed point of the growth curve for post-synaptic excitatory neurites is found at ϵpostE where the slope of the growth curve is negative. Inhibitory post-synaptic elements for all neurons follow the opposite rule: they sprout when the neuron has extra activity and retract when the neuron is deprived of activity. The stable fixed point of the growth curve for post-synaptic inhibitory neurites is therefore, found at ηpostI where the slope of the growth curve is positive. Together, these growth curves ensure that when the neuron has more than optimal activity, it will lose excitation and attempt to gain inhibition to reduce its net activity (red arrow). Similarly, the neuron attempts to gain excitation and loses inhibition to gain net activity when it has less than optimal activity (blue arrow). The optimal activity level, ψ, thus acts as the stable fixed point for both post-synaptic growth curves. (B) pre-synaptic elements: The connectivity of the network also depends on the pre-synaptic connectivity. Specifically, neurons attempting to gain synapses can only do so if free neurites of the required type are available. In excitatory neurons, axonal sprouting is stimulated by extra activity. In inhibitory neurons, on the other hand, deprivation in activity stimulates axonal sprouting. Synaptic elements that do not find corresponding partners to form synapses (free synaptic elements) decay exponentially with time. These graphs are illustrations of the regimes that the growth curves must follow.
Fig 6
Fig 6. Excitatory projections to excitatory neurons in the centre of the LPZ.
(A) shows incoming excitatory projections to a randomly chosen neuron in the centre of the LPZ at different stages of our simulations. From left to right: t = 2000 s, t = 4000 s, and t = 18,000 s. (B) shows the total numbers of incoming excitatory projections to neurons in the centre of the LPZ from different regions at different points in time. (C) shows the mean weight of projections received by neurons in the centre of the LPZ from different regions at different points in time. Following our proposed growth rules for post-synaptic elements and consistent with experimental reports, the deprived neurons in the LPZ C gain lateral excitatory inputs from neurons outside the LPZ.
Fig 7
Fig 7. Inhibitory projections to excitatory neurons in the centre of the LPZ.
(A) shows incoming inhibitory projections to a randomly chosen neuron in the centre of the LPZ at different stages of our simulations. From left to right: t = 2000 s, t = 4000 s, and t = 18,000 s. (B) shows the total numbers of incoming inhibitory projections to neurons in the centre of the LPZ from different regions at different points in time. (C) shows the mean weight of projections received by neurons in the centre of the LPZ from different regions at different points in time. Also in line with biological observations, they temporarily experience dis-inhibition after deafferentation. However, as these neurons gain activity from their new lateral excitatory inputs, the number of their inhibitory input connections increases again in order to restore the E-I balance.
Fig 8
Fig 8. Excitatory projections to excitatory neurons in the peri-LPZ.
(A) shows incoming excitatory projections to a randomly chosen neuron in the peri-LPZ at different stages of our simulations. From left to right: t = 2000 s, t = 4000 s, and t = 18,000 s. (B) shows the total numbers of incoming excitatory projections to neurons in the peri-LPZ from different regions at different points in time. (C) shows the mean weight of projections received by neurons in the peri-LPZ from different regions at different points in time. In contrast to neurons in the LPZ, neurons outside the LPZ experience an increase in activity in our simulations. As a result of our growth rules, these neurons lose excitatory inputs.
Fig 9
Fig 9. Inhibitory projections to excitatory neurons in the peri-LPZ.
(A) shows incoming inhibitory projections to a randomly chosen neuron in the peri-LPZ at different stages of our simulations. From left to right: t = 2000 s, t = 4000 s, and t = 18,000 s. (B) shows the total numbers of incoming excitatory projections to neurons in the peri-LPZ from different regions at different points in time. (C) shows the mean weight of projections received by neurons in the peri-LPZ from different regions at different points in time. In contrast to neurons in the LPZ, neurons outside the LPZ experience an increase in activity in our simulations. As a result of our growth rules, these neurons gain inhibitory inputs.
Fig 10
Fig 10. Single neuron simulations show the homeostatic effect of the post-synaptic growth rules.
(A) A neuron in its balanced state receives excitatory (gE) and inhibitory (gI) conductance inputs through its excitatory (zpostE) and inhibitory (zpostI) dendritic elements, respectively, such that its activity ([Ca2+]) is maintained at its optimal level (ψ) by its net input conductance (gnet). (B) An external sinusoidal current stimulus (Iext) is applied to the neuron to vary its activity from the optimal level. (C) Under the action of our post-synaptic growth curves, the neuron modifies its dendritic elements to change its excitatory (ΔgE) and inhibitory (ΔgI) conductance inputs such that the net change in its input conductance (Δgnet) counteracts the change in its activity: an increase in [Ca2+] due to the external stimulus is followed by a decrease in net input conductance received through the post-synaptic elements and vice versa (dashed lines in B and C).
Fig 11
Fig 11. Axonal growth curves investigated in the study (where applicable, Red: Inhibitory, Blue: Excitatory).
Only growth curves shown in C/G2 reproduce the course of repair observed in experiments (Table 2). G0: no growth curves (no sprouting or retraction); G0’: constant axonal sprouting, irrespective of neuronal activity; G1: both inhibitory and excitatory axons sprout when activity is more than required; G2: inhibitory axons sprout when activity is less than optimal, but excitatory axons sprout when activity is more than required; G3: excitatory axons sprout when activity is less than optimal, but inhibitory axons sprout when activity is more than required; G4: both excitatory and inhibitory axons sprout at optimal activity. G5: both inhibitory and excitatory axons sprout when activity is less than optimal.
Fig 12
Fig 12. Outgoing projections.
(A) shows the outgoing (axonal) projections of an excitatory neuron in the peri-LPZ. (B) shows the outgoing (axonal) projections of an inhibitory neuron in the LPZ C. From left to right: t = 2000 s, t = 4000 s, and t = 18,000 s. As per our suggested growth rules for pre-synaptic elements, excitatory neurons produce new pre-synaptic elements and sprout axonal projections when they experience extra activity, while inhibitory neurons form new pre-synaptic elements and grow axons when they are deprived of activity. As a consequence and in line with experimental data, following deafferentation of the LPZ, excitatory neurons in the peri-LPZ sprout new outgoing projections that help transfer excitatory activity to neurons in the LPZ. Also in accordance with experimental work, inhibitory neurons inside the LPZ form new outgoing connections that transmit inhibition to neurons outside the LPZ.
Fig 13
Fig 13. Both structural and synaptic plasticity contribute to restoration of activity after deafferentation.
(A), (B), (C) show firing rate snapshots of neurons at t = 1500 s, 2001.5 s, 4000 s, 18,000 s. (A) Synaptic plasticity only: after the network has settled in its physiological state by means of synaptic plasticity, structural plasticity is not enabled. With only synaptic plasticity present, the network is unable to restore activity to neurons in the LPZ. Neurons outside the LPZ return to their balanced state, but the neurons in the LPZ are effectively lost to the network. (B) Both structural and synaptic plasticity are enabled: neurons in the LPZ regain their low firing rate as before deafferentation. (C) Structural plasticity only: after the network has settled in its physiological state by means of synaptic plasticity, homeostatic synaptic plasticity is turned off and only structural plasticity is enabled. With only structural plasticity present, activity returns to neurons in the LPZ but does not stabilise in a low firing rate regime. The firing rate of these neurons continues to increase and, as a result, these neurons continue to turn over synaptic elements. This cascades into increased activity in neurons outside the LPZ, further causing undesired changes in network connectivity. (D) shows the mean population firing rates of neurons in the centre of the LPZ for the three simulation configurations. (Panel 1 is identical in all three simulation configurations because the same parameters are used to initialise all simulations.).
Fig 14
Fig 14. The simulation runs in 2 phases.
Initially, the set-up phase (0 s < t < t2) is run to set the network up to the balanced AI state. At (t = t2), a subset of the neuronal population is deafferented to simulate a peripheral lesion and the network is allowed to organise under the action of homeostatic mechanisms until the end of the simulation at (t = tend). Each homeostatic mechanism can be enabled in a subset of neurons to analyse its effects on the network after deafferentation.

Similar articles

Cited by

References

    1. May A. Experience-dependent structural plasticity in the adult human brain. Trends in cognitive sciences. 2011;15(10):475–482. doi: 10.1016/j.tics.2011.08.002 - DOI - PubMed
    1. Majewska AK, Newton JR, Sur M. Remodeling of synaptic structure in sensory cortical areas in vivo. Journal of Neuroscience. 2006;26(11):3021–3029. doi: 10.1523/JNEUROSCI.4454-05.2006 - DOI - PMC - PubMed
    1. Knott GW, Quairiaux C, Genoud C, Welker E. Formation of dendritic spines with GABAergic synapses induced by whisker stimulation in adult mice. Neuron. 2002;34(2):265–273. doi: 10.1016/S0896-6273(02)00663-3 - DOI - PubMed
    1. Lee WCA, Huang H, Feng G, Sanes JR, Brown EN, So PT, et al.. Dynamic remodeling of dendritic arbors in GABAergic interneurons of adult visual cortex. PLoS biology. 2005;4(2):e29. doi: 10.1371/journal.pbio.0040029 - DOI - PMC - PubMed
    1. Stettler DD, Yamahachi H, Li W, Denk W, Gilbert CD. Axons and Synaptic Boutons Are Highly Dynamic in Adult Visual Cortex. Neuron. 2006;49(6):877–887. doi: 10.1016/j.neuron.2006.02.018 - DOI - PubMed