. 2021 Jun;18(179):20210206.
doi: 10.1098/rsif.2021.0206. Epub 2021 Jun 2.

Anticipating response function in gene regulatory networks

Affiliations

Anticipating response function in gene regulatory networks

Pankaj Gautam et al. J R Soc Interface. 2021 Jun.

Abstract

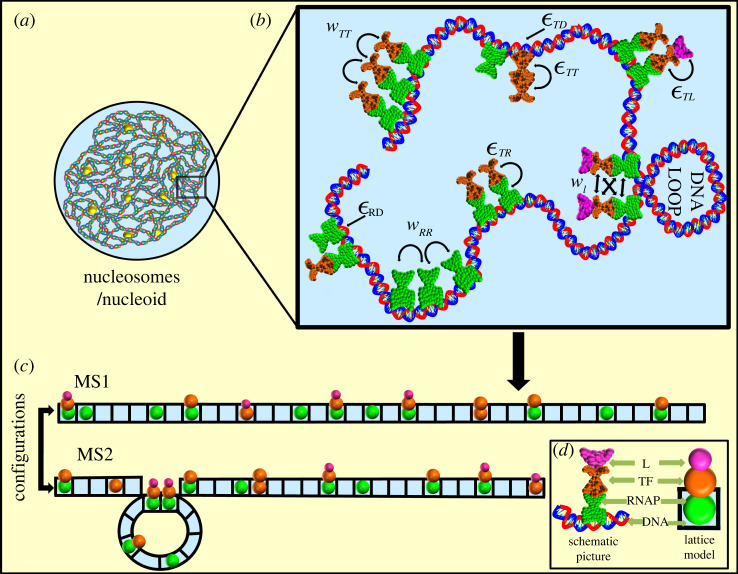
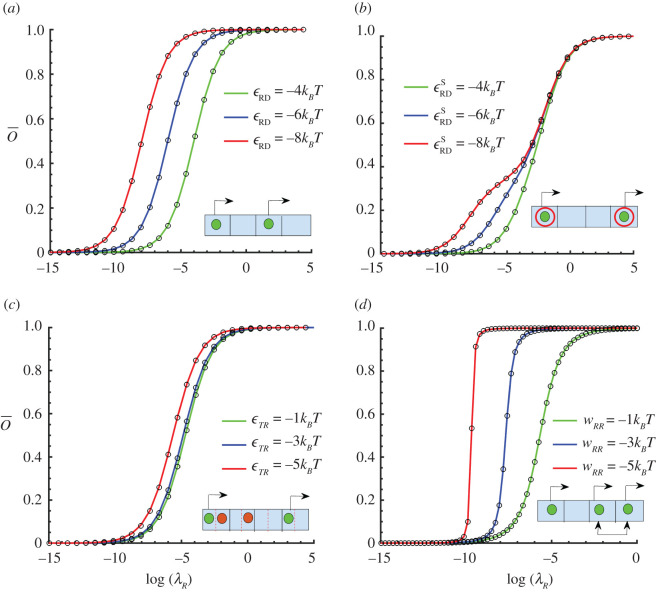
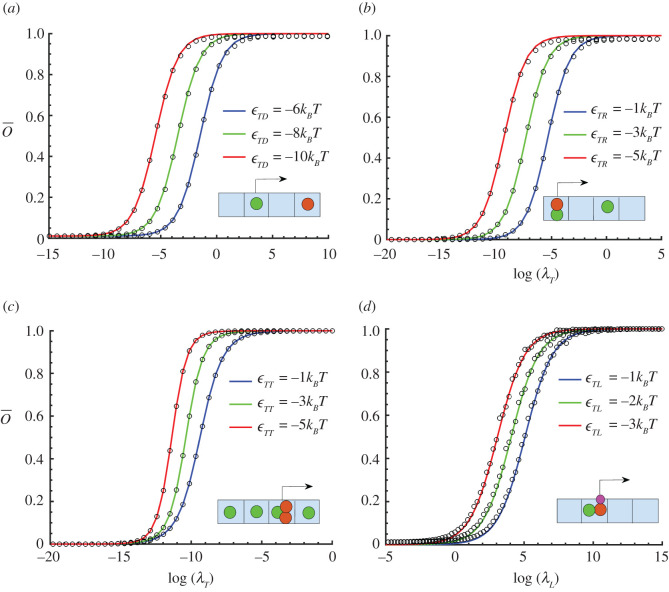
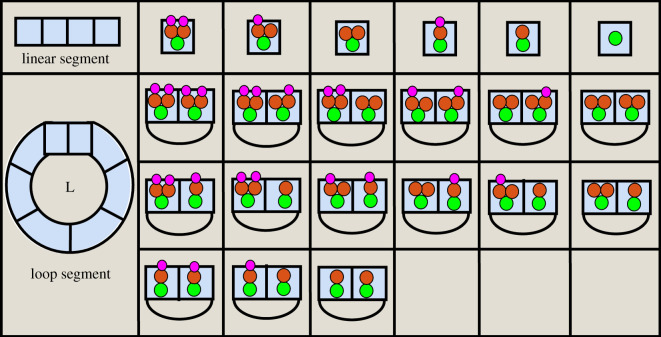
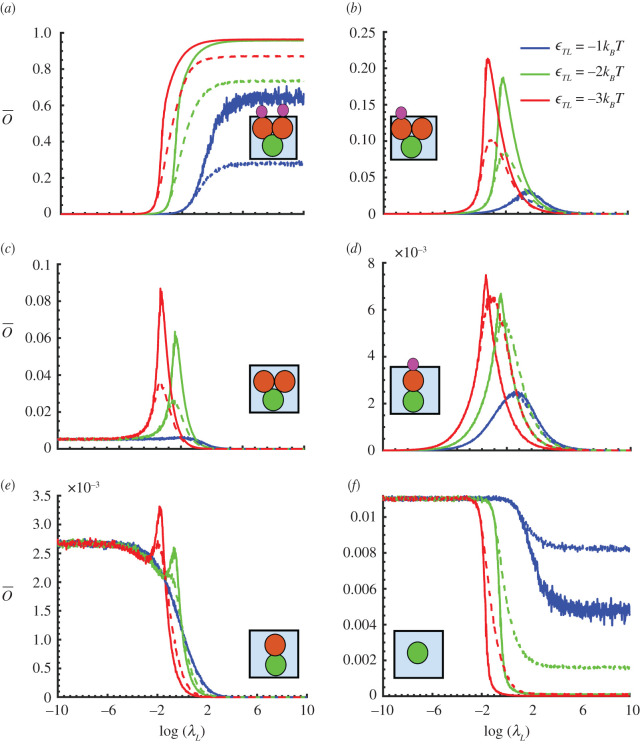
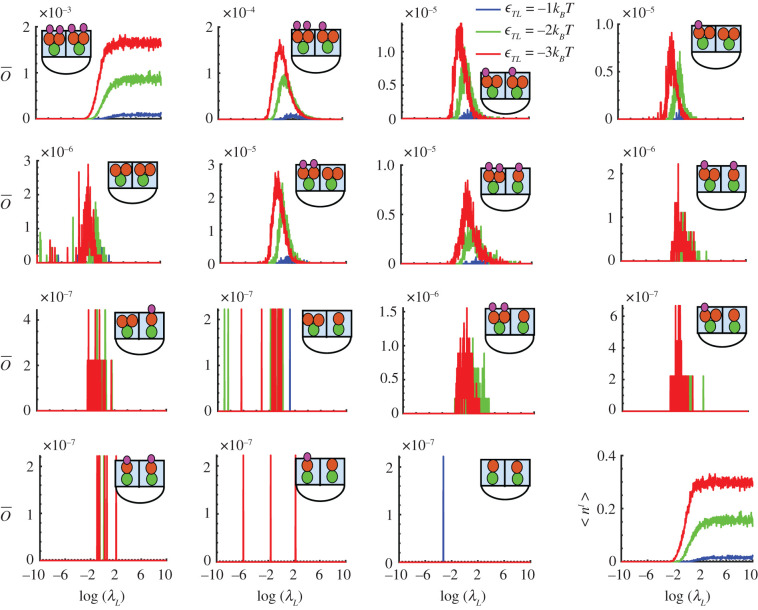
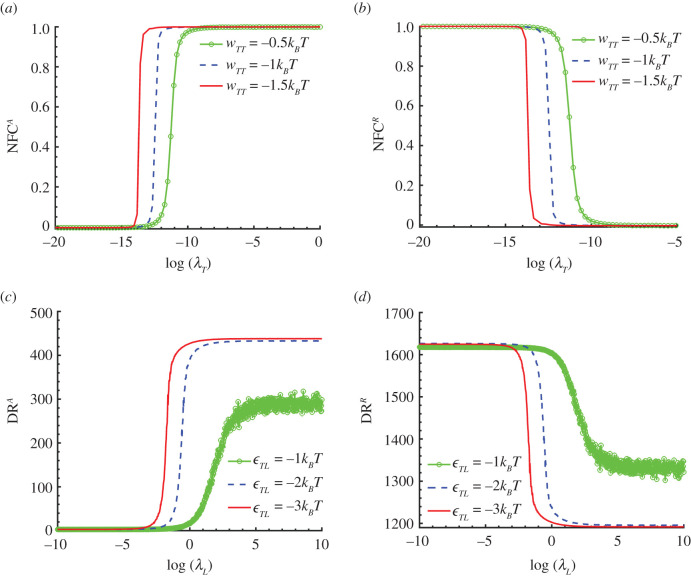
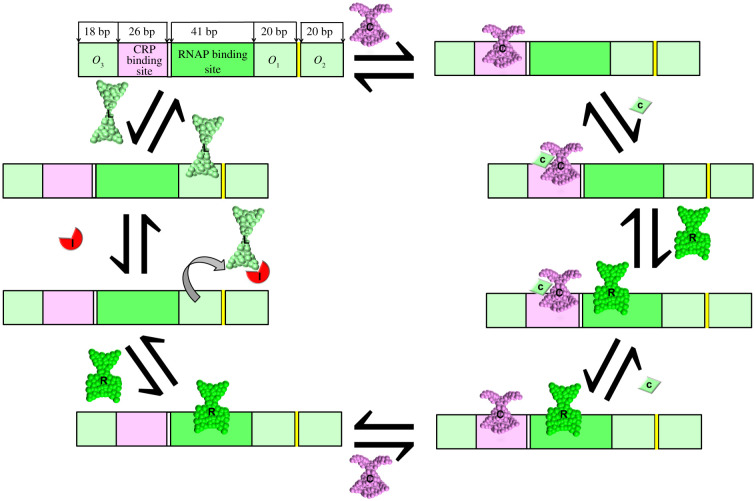
The origin of an ordered genetic response of a complex and noisy biological cell is intimately related to the detailed mechanism of protein-DNA interactions present in a wide variety of gene regulatory (GR) systems. However, the quantitative prediction of genetic response and the correlation between the mechanism and the response curve is poorly understood. Here, we report in silico binding studies of GR systems to show that the transcription factor (TF) binds to multiple DNA sites with high cooperativity spreads from specific binding sites into adjacent non-specific DNA and bends the DNA. Our analysis is not limited only to the isolated model system but also can be applied to a system containing multiple interacting genes. The controlling role of TF oligomerization, TF-ligand interactions, and DNA looping for gene expression has been also characterized. The predictions are validated against detailed grand canonical Monte Carlo simulations and published data for the lac operon system. Overall, our study reveals that the expression of target genes can be quantitatively controlled by modulating TF-ligand interactions and the bending energy of DNA.

Keywords: GCMC simulation; gene regulation; protein–DNA networks; response function; statistical mechanics.


Figures

Figure 1.
Figure 1.
(a) Schematic view of the complex structure of nucleosomes/nucleoid. (b) The zoomed view of a section of nucleosomes/nucleoid. Different types of protein–DNA interactions control the populations of a specific configuration. We denote RNAP–DNA, TF–DNA, TF–RNAP and TF–ligand by εRD, εTD, εTR, εTL. The nearest-neighbour interactions for TF and RNAP on the DNA lattice are wTT and wRR. wl represents the long-distance interactions among RNAP and TF molecules. The colour-coding schemes for RNAP, TF and ligand are green, orange and purple. The formation of the DNA loop is also shown here. (c) Protein–DNA interactions are modelled as a lattice of possible binding sites that TFs can occupy. Two possible configurations out of an enormous number of microstates are shown for representation. (d) A correspondence between the bead and 3-D structures of protein and DNA is shown.
Figure 2.
Figure 2.
Average occupation number of RNAP and RNAP–TF complex, o¯ for non-interacting and interacting systems as a function of RNAP activity. Solid lines and the symbol circles represent theoretical and simulation results. The calculations are done for three different values of interaction energies as shown by three different line colours, red, blue and green. Schematic lattice configurations of short segments of protein–DNA complexes are shown in the respective panels. Panel (a) simple binding between RNAP and DNA. Panel (b), when RNAP binds specifically and non-specifically to DNA. The value of binding interaction for RNAP with non-specific DNA binding sites, ϵRDO=2kBT is considered. Three values of εRD are considered for both analyses. Panel (c), simultaneous binding of RNAP and TFs on DNA. The binding interactions of RNAPs and TFs with DNA, εRD = −4.68kBT, εTD = −8.88kBT and λT = 1.5 × 10⁻⁶ are considered. Three values of εTR are considered. (d) The nearest-neighbour interactions (wRR) are introduced when both sites are occupied by RNAP. Three values of wRR are considered for the calculation.
Figure 3.
Figure 3.
Average occupation number (o¯) of RNAP, TF–RNAP and TF–RNAP–L complexes for non-interacting systems as function of λT and λL. Solid lines and the symbol circles represent theoretical and simulation results. Schematic lattice configurations of short segments of protein–DNA complexes are shown in the respective panels. (a) Recruitment of RNAP by TF, (b) stimulation of RNAP due to the binding of TF, (c) cooperative stimulation by the dimeric TFs, (d) activation due to the binding of a ligand to TFs. Following binding interaction parameter are used: εRD = −4.68kBT, εTD = −8.88kBT, λR = 10−4, λT = 1.5 × 10⁻⁶.
Figure 4.
Figure 4.
Various complexes formed in our MCS. The RNAP, TF and ligand are represented by green, orange and magenta beads. The arc in the figure corresponds with the DNA loop. Complexes formed on a linear DNA segment are shown in the first row. In the subsequent rows, we show the possible complexes formed due to DNA loop formation.
Figure 5.
Figure 5.
Fraction of different species formed on linear DNA segments for both of the stiff (solid lines) and flexible (dashed lines) DNAs are shown as a function of ligand activity, λL. The following values of energy of interactions for various complex formations are considered, εRD = −4.68kBT, εTD = −8.88kBT, εTR = −3kBT, εTT = −2kBT, wl = −0.2kBT, wRR = −5kBT wTT = −1kBT, kl = 3.8(kBT/d2). The calculations are done at fixed values of activities for RNAP and TF, those are given by λR = 10−4, λT = 1.5 × 10⁻⁶, respectively.
Figure 6.
Figure 6.
The population of higher-order oligomeric species formed on the flexible DNA due to the looping. The following values of energy of interactions for various complex formations are considered, εRD = −4.68kBT, εTD = −8.88kBT, εTR = −3kBT, εTT = −2kBT, wl = −0.2kBT, wRR = −5kBT, wTT = −1kBT, kl = 3.8(kBT/d2). The calculations are done at fixed values of activities for RNAP and TF, those are λR = 10−4, λT = 1.5 × 10⁻⁶, respectively. The average number of loops per configuration is shown at the extreme bottom right panel of the figure.
Figure 7.
Figure 7.
Quantification of functional responses in GR systems. (a) NFC for the activation as a function of λT. (b) NFC for repression as a function of λT. (c) Control activation with a ligand, i.e. DRA as a function of λL. (d) Control of repression with a ligand, i.e. DRR as a function of λL.
Figure 8.
Figure 8.
Protein–DNA interaction network for lac operon system at thermodynamic equilibrium. Different binding regions of the promoter of the lac operon gene are depicted by different shades of colour in the lattice. O1, O2, O3 are three operators, where LacR can bind. CRP and RNAP bind to their respective binding regions. Different shapes are used to represent the different biomolecules in the figure. The letters inside the shapes such as R, L, C, I and c correspond with the RNAP, LacR, CRP, IPTG and cAMP molecules in the figure.
Figure 9.
Figure 9.
Fold change (FC) and dose–response (DR) as a function of biomolecular activities, λL, λC, λI and λc. Solid lines represent theoretical results, and the results obtained from 20 independent GCMC simulation runs are shown by shaded colours. (a) Repression as a function of λL. The calculations are done at three values of λI. (b) Activation as a function of λC. Here the calculation is also done at three constant values of λc. (c) Activation as a function of λI. The calculations are done for both stiff and flexible DNAs. (d) Activation as a function of λc. Here, we also consider two cases such as with and without loop cases. The results obtained from GCMC simulations for the interacting system, where we consider nearest-neighbour interactions among RNAP molecules (wRR = −5kBT), are shown by solid green and blue colours in each of the panels.

Similar articles

Cited by

References

    1. Alberts B. 2017. Molecular biology of the cell. New York, NY: CRC Press.
    1. Phillips R, Theriot J, Kondev J, Garcia H. 2012. Physical biology of the cell. New York, NY:Garland Science.
    1. Gerland U, Moroz JD, Hwa T. 2002. Physical constraints and functional characteristics of transcription factor–DNA interaction. Proc. Natl Acad. Sci. USA 99, 12 015-12 020. (10.1073/pnas.192693599) - DOI - PMC - PubMed
    1. Dangkulwanich M, Ishibashi T, Bintu L, Bustamante C. 2014. Molecular mechanisms of transcription through single-molecule experiments. Chem. Rev. 114, 3203-3223. (10.1021/cr400730x) - DOI - PMC - PubMed
    1. Chen ZP, Iyer J, Bourguet W, Held P, Mioskowski C, Lebeau L, Noy N, Chambon P, Gronemeyer H. 1998. Ligand- and DNA-induced dissociation of RXR tetramers. J. Mol. Biol. 275, 55-65. (10.1006/jmbi.1997.1413) - DOI - PubMed

Publication types

LinkOut - more resources