. 2021 Jun 24;184(13):3410-3425.e17.
doi: 10.1016/j.cell.2021.04.047. Epub 2021 May 31.

TRIM7 inhibits enterovirus replication and promotes emergence of a viral variant with increased pathogenicity

Affiliations

TRIM7 inhibits enterovirus replication and promotes emergence of a viral variant with increased pathogenicity

Wenchun Fan et al. Cell. .

Abstract

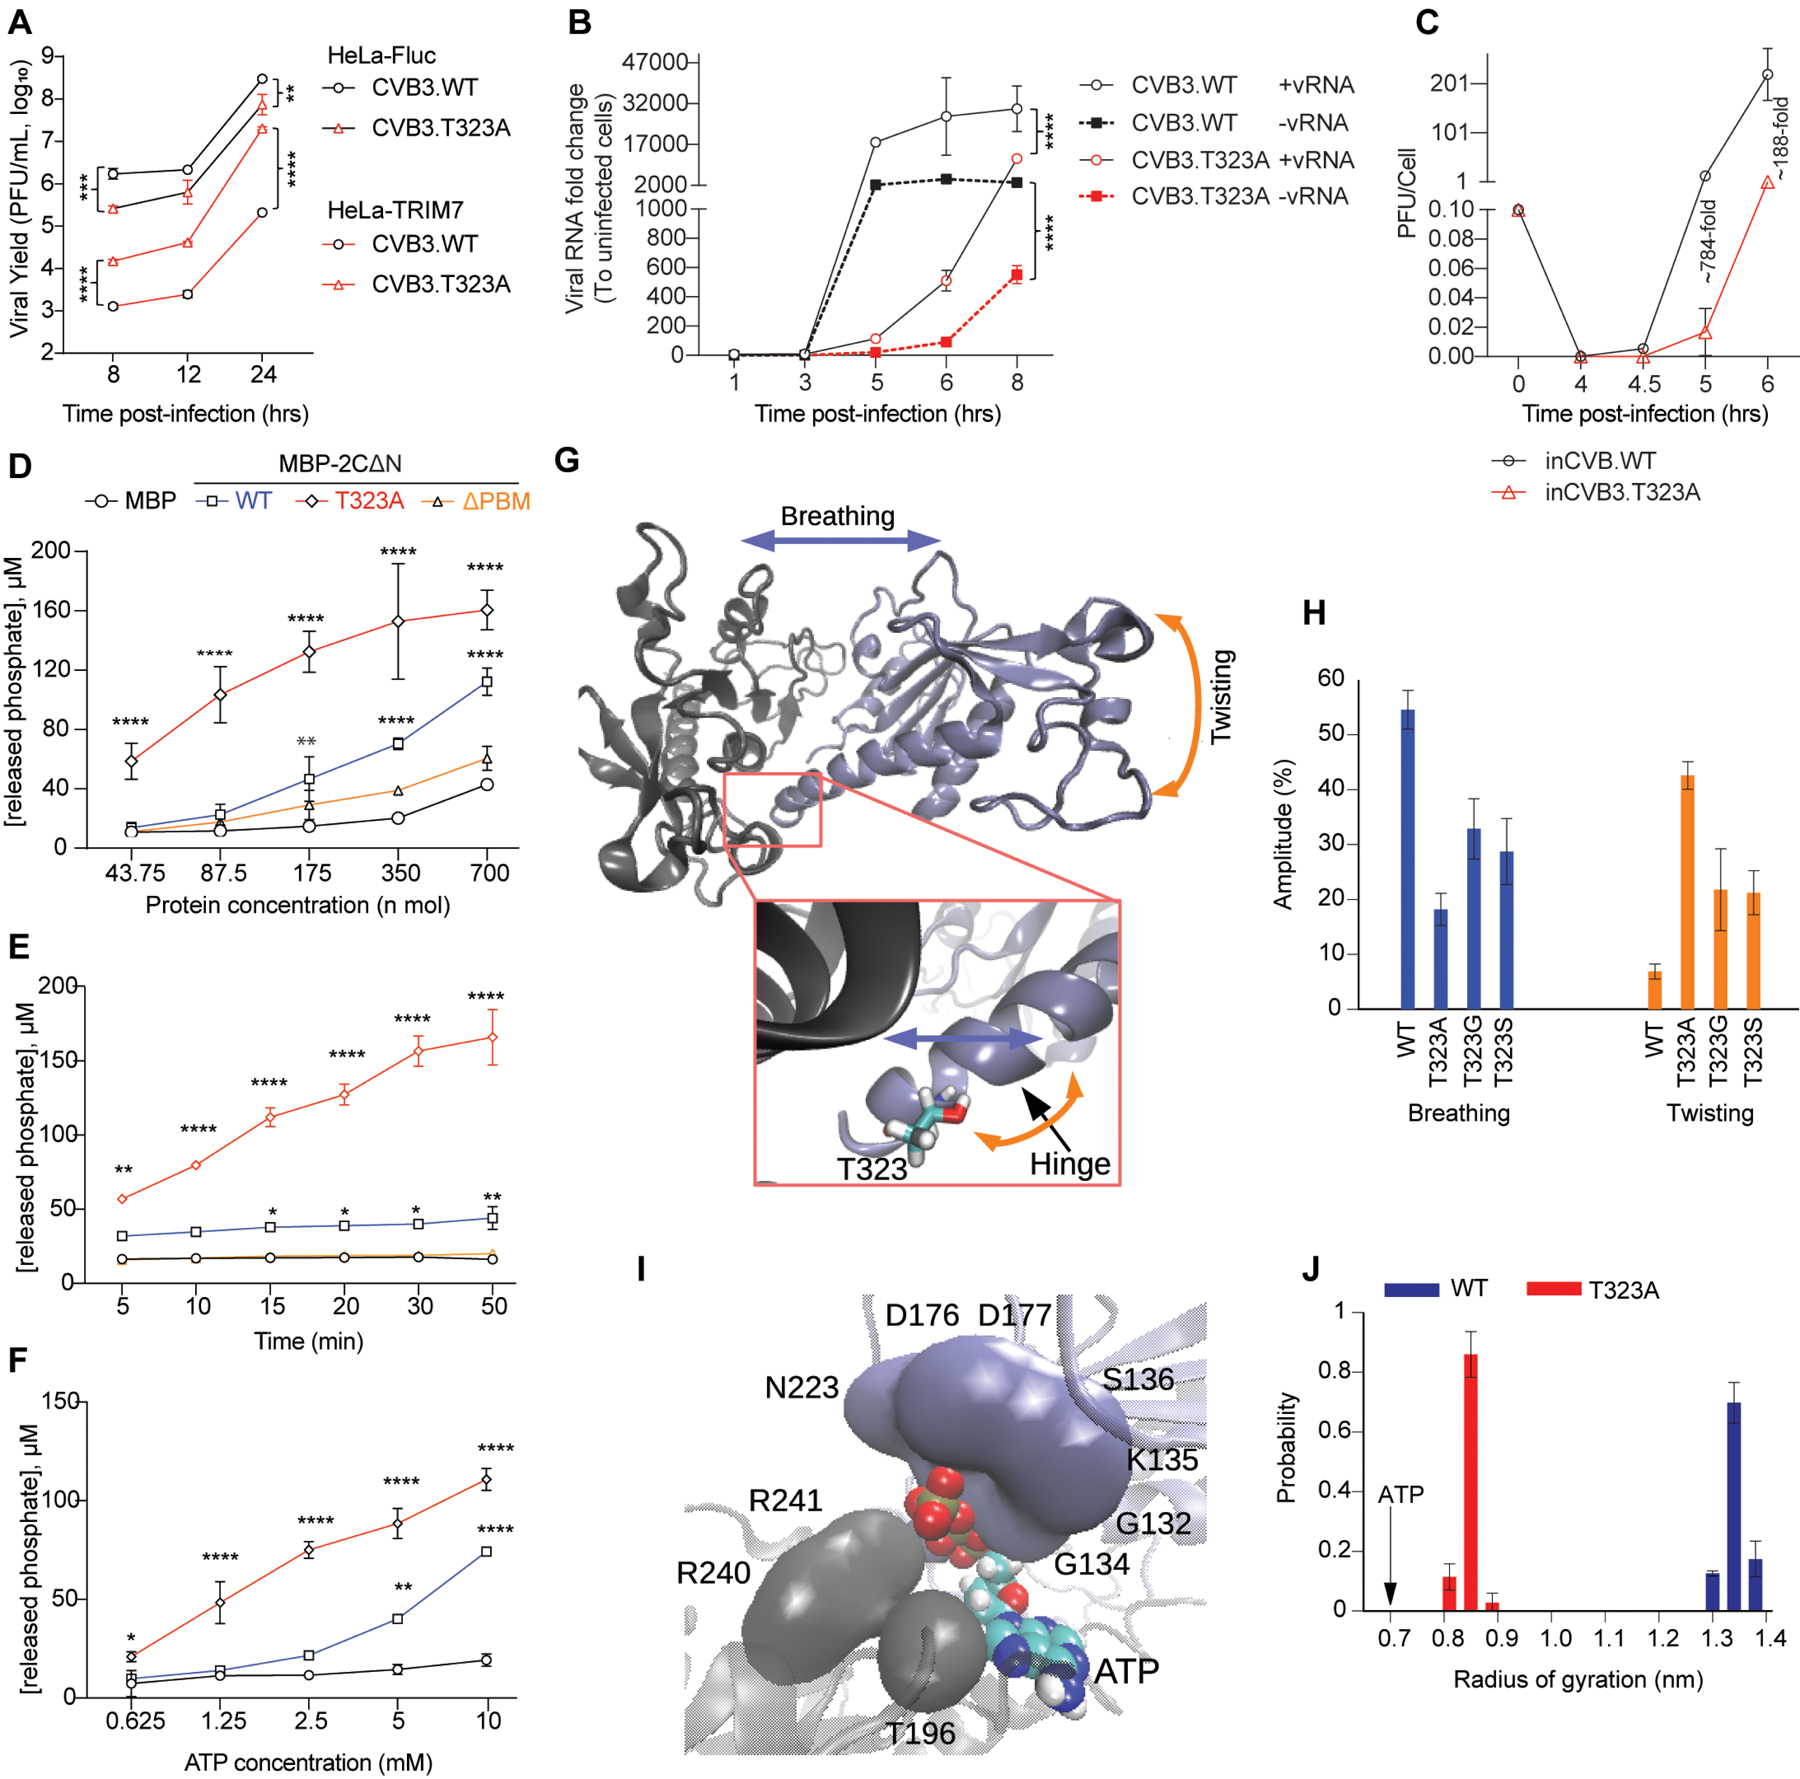
To control viral infection, vertebrates rely on both inducible interferon responses and less well-characterized cell-intrinsic responses composed of "at the ready" antiviral effector proteins. Here, we show that E3 ubiquitin ligase TRIM7 is a cell-intrinsic antiviral effector that restricts multiple human enteroviruses by targeting viral 2BC, a membrane remodeling protein, for ubiquitination and proteasome-dependent degradation. Selective pressure exerted by TRIM7 results in emergence of a TRIM7-resistant coxsackievirus with a single point mutation in the viral 2C ATPase/helicase. In cultured cells, the mutation helps the virus evade TRIM7 but impairs optimal viral replication, and this correlates with a hyperactive and structurally plastic 2C ATPase. Unexpectedly, the TRIM7-resistant virus has a replication advantage in mice and causes lethal pancreatitis. These findings reveal a unique mechanism for targeting enterovirus replication and provide molecular insight into the benefits and trade-offs of viral evolution imposed by a host restriction factor.

Keywords: Antiviral immunity; E3 ubiquitin ligase; Enterovirus; Restriction factor; Viral evolution; Viral pathogenesis.


Conflict of interest statement

Declaration of interests The authors declare no competing interests.

Figures

Figure 1.
Figure 1.. Identification of TRIM7 as an antiviral effector against human enteroviruses
(A) HeLa cells expressing 118 RING type E3 ubiquitin ligases were infected with CVB3-GFP, and virus infectivity was quantified by flow cytometry. Data were normalized to a Fluc-expressing control. (B) Viral titers of supernatants from HeLa-Fluc or HeLa-TRIM7 cells infected with 0.01 or 0.1 MOI CVB3 for 12 h and 24 h, quantified by plaque assay. (C) Same as (B), cells infected with 10 MOI CVB3 for 4h and 8 h. (D) HeLa-Fluc or HeLa-TRIM7 cells were infected with indicated viruses at 1 MOI. Cells were harvested at 8 h (CVB3, PV, MenV) or 12 h (EV71, E11) and infectivity was assessed by flow cytometry using anti-dsRNA antibody staining. (E–G) Viral titers of supernatants from HeLa-Fluc or HeLa-TRIM7 cells infected with EV71, E11, or EVD68 at 1 MOI for 24 h, quantified by tissue culture infectivity dose 50% (TCID50) assay. (H) Infectivity of 1 MOI PV-GFP in HeLa-Fluc or HeLa-TRIM7 cells, determined as percentage of GFP-positive cells by flow cytometry. (I) Same as (B), cells infected with 1 MOI MenV for 8h. (J) Viral Titers of supernatants from HepG2 cells expressing shRNA targeting LacZ or TRIM7 and infected with 0.1 or 1 MOI CVB3 for 8 h, quantified by plaque assay. Data represent averages of independent biological replicates and are presented as means ± SD (n=2–5). (B–D, H, J) 2-way ANOVA with Sidak’s multiple comparisons test (*P<0.05, **P<0.01, ***P<0.001, ****P<0.0001). (E-G) unpaired t-test (*P<0.05, **P<0.01, ***P<0.001, ****P<0.0001).
Figure 2.
Figure 2.. TRIM7 restricts CVB3 RNA replication
(A) HeLa-Fluc or HeLa-TRIM7 were infected with 1000 MOI CVB3 at 4°C for 1.5 h bound virus was quantified by plaque assay. (B) Same as (A), and cells were shifted to 37°C for 30 min and internalized virus was quantified by plaque assay. (C–D) Same as (A, B). Bound (C) or internalized virus (D) was assessed by staining cells with anti-VP1 antibody followed by confocal microscopy analysis. Scale bar, 8 μm. (E) HeLa-Fluc or HeLa-TRIM7 cells were transfected with infectious CVB3-GFP RNA. Images were taken at 4, 6, 8, and 24 h post-transfection. Scale bar, 50 μm. Schematic created with Biorender.com. (F) Supernatants from (E) were used to infect HeLa cells. Infectivity of progeny virus was assessed by flow cytometry. (G) HeLa-Fluc or HeLa-TRIM7 cells were transfected with infectious PV-GFP RNA. Supernatants were harvested at 24 h and used to infect HeLa cells. Infectivity of progeny virus was assessed by flow cytometry. (H–I) HeLa-Fluc or HeLa-TRIM7 cells were transfected with wild type (H) or replication-defective (I) CVB3-Rluc replicon RNA. Cells were harvested at indicated time points and Renilla luciferase activity was quantified. (J) HeLa-Fluc or HeLa-TRIM7 cells were infected with 0.1 MOI CVB3. Positive (+vRNA) or negative (−vRNA) viral RNA was quantified by RT-qPCR. (K) HeLa-Fluc or HeLa-TRIM7 cells were infected with 0.1 MOI CVB3. Intracellular (inV)and extracellular (exV) virus production was determined by plaque assay. Data represent averages of independent biological replicates and are presented as means ± SD (n=3). (A,B, G) unpaired t-test (ns, P>0.05, ****P<0.00001). For F, H–I, statistical significance was determined by (F, H–J) 2-way ANOVA with Sidak’s (F, H–I) or Tukey’s (J) multiple comparisons test. (*P<0.05, **P<0.01, ***P<0.001, ****P<0.0001).
Figure 3.
Figure 3.. Emergence of TRIM7-resistant virus reveals TRIM7 interactions with viral 2C and 2BC
(A) Schematic of CVB3 polyprotein and 2BC region annotated with TRIM7 resistance mutation T323A. (B) Fluorescence microscopy images of HeLa-Fluc or HeLa-TRIM7 cells infected with CVB3.WT-GFP and CVB3.T323A-GFP (1 MOI, 8 h). Scale bar, 50 μm. (C) 293T cells were co-transfected with plasmids expressing TRIM7-3F (TRIM7 with C-terminal 3x FLAG epitope) or empty vector and HA-tagged 2B or 2BC. Cells were harvested for co-IP using anti-HA beads and analyzed by Western blot. (D) Schematic of TRIM7 constructs. (E) 293T cells were co-transfected with HA-2BC plasmid or empty vector control and indicated TRIM7-3F expressing plasmids. Cells were harvested for co-IP using anti-HA beads and analyzed by Western blot. (F) Similar to (E), reciprocal co-IP using anti-FLAG beads. (G) Confocal microscopy analysis of HeLa cells co-transfected for 24 h with HA-2BC and TRIM7-3F or PRY/SPRY deleted TRIM7-3F (TRIM7ΔPS) plasmids. HA-2BC (green); TRIM7-3F or TRIM7ΔPS (red); DAPI-stained nuclei (blue). Scale bar, 5 μm. (H) HeLa cells were transfected with TRIM7-3F (top) or HA-2BC (bottom) plasmids. Co-localization with LDs was assessed by confocal microscopy at 24 h. TRIM7-3F and HA-2BC (red); LDs (Bodipy493-green); DAPI-stained nuclei (blue). Scale bar, 5 μm. (I) Confocal microscopy of HeLa cells co-transfected for 24 h with TRIM7-3F and CVB3 HA-2BC plasmids HA-2BC (magenta); TRIM7-3F (red); LDs (Bodipy493: green); DAPI-stained nuclei (blue). Scale bar, 5 or 2.5 μm. (J) Western blots of post-nuclear supernatant (PNS), ER, and LD fractions from HeLa-TRIM7-CA-3xFlag cells infected with CVB3 (10 MOI, 6 h). (K–L) HeLa cells expressing Fluc or TRIM7 (WT or ΔPS) were infected with CVB3-GFP (K) or PV-GFP (L) for 8 h. Virus infectivity was analyzed by flow cytometry. (M) 293T cells were co-transfected with TRIM7-3F HA-tagged 2BC or 2BC-T323A plasmids. Cells were harvested for co-IP using anti-HA beads and analyzed by Western blot. (N) In vitro binding analysis of TRIM7-2C interaction. (Left) schematic of recombinant full-length (FL) CVB3 2C and mutants. (Right) Coomassie-staining showing the in vitro binding of GST-tagged TRIM7-PRY/SPRY to His-MBP-His-tagged wild type 2C and its mutants, or His-MBP control. Black and red arrows denote GST-TRIM7PRY/SPRY in input or after pulldown with Ni-NTA beads, respectively. Data represent averages of independent biological replicates and are presented as means ± SD (n=3). (K) 2-way ANOVA with Sidak’s multiple comparisons test (****P<0.0001). (L) One-way ANOVA with Dunnet’s multiple comparison test (****P<0.0001).
Figure 4.
Figure 4.. TRIM7 promotes proteasome-dependent degradation of enterovirus 2BC
(A) Western blot analysis of 293T cells co-transfected for 30 h with indicated HA-tagged CVB3 viral protein expressing plasmids and TRIM7-3F or empty plasmids. (B) Western blot/Licor analysis of 293T cells co-transfected for 30 h with consistent amounts of plasmid expressing CVB3 HA-2C or HA-2BC and increasing amounts of TRIM7-3F plasmid. (C) Quantitation of 2BC:GAPDH TRIM7:GAPDH ratio from Licor analysis in (B). n=3, error bars, SD. (D) Western blot analysis of 293T cells co-transfected for 30 h with consistent amounts of plasmid expressing CVB3 HA-2BC, and with CA mutant TRIM7-3F or increasing amounts of WT TRIM7-3F plasmid. (E) HeLa cells expressing Fluc or TRIM7 variants were infected with CVB3-GFP (1 MOI, 8 h) and infectivity was quantified by flow cytometry. (F) Same as (B). Cells were treated with DMSO or MG132 (10 μM) at 24 h post-transfection for 6 h and then assessed by Western blot. (G) Same as (F), with HA-tagged 2BC from EV71, EVD68, or MenV. (H) Same as (D) with HA-tagged 2BC from EV71 or MenV. (I) Co-IP analysis of lysates from 293T cells co-transfected for 30 h with TRIM7-3F and HA-tagged EV71 2BC, MenV 2BC, or empty vector plasmids. (J) Cell-based ubiquitination assay. 293T cells were co-transfected for 24 h with HA-2BC, TRIM7-3F (WT and CA), and indicated StrepII-tagged ubiquitin expressing plasmids. Cells were treated with MG132 (10 μM) for 6 h. Cells were harvested for co-IP using anti-HA beads and analyzed by Western blot. (K) In vitro ubiquitination assay. TRIM7-3F and HA-2BC were purified from 293T cells using anti-Flag beads and anti-HA beads, respectively. Ubiquitination assays were performed as described in STAR Methods. (E) Data represent average of 3 independent biological replicates and is presented as mean ± SD; One-way ANOVA with Dunnett’s multiple comparisons test (****P<0.0001). Western blots are representative of three (J) or two (K) independent experiments showing similar results. Numbers indicate quantitation by Licor.
Figure 5.
Figure 5.. TRIM7 resistance mutation T323A reduces viral replication in vitro and increases plasticity and ATPase activity of 2C
(A) Viral titers of supernatants from HeLa-Fluc or HeLa-TRIM7 cells infected with CVB3-WT or CVB3-T3232A, quantified by plaque assay. (B) HeLa cells were infected with 1.0 MOI CVB3-WT or CVB3-T323A. Positive (+vRNA) or negative (−vRNA) viral RNA was quantified by RT-qPCR. (C) HeLa cells were infected with 0.1 MOI CVB3-WT or CVB3-T323A. Intracellular (‘in’) virus production was determined by plaque assay. (D–F) ATPase activity of WT and mutant CVB3 2C proteins or His-MBP-His control was measured under different conditions: (D) enzyme dose dependence, (E) time course at 140 nM protein, (F) substrate dose dependence. (G) The two primary modes of protein dynamics, breathing and twisting, as obtained from principle components analysis of MD simulations. Inset: ‘hinge’ region close to the mutation site that facilitates both motions (also see Supplemental Movies S1 and S2). (H) Quantification of each mode of dynamics for WT and mutant 2C dimers as a percentage of total conformational variation during MD simulations. (I) Crystal structure of the ATP binding pocket from EVA71 2C (PDB: 5GRB). ATP molecule is shown by ball-and-stick representation; hydrolysis residues are depicted as van der Waals surfaces. (J) Probability distributions of pocket size as determined by radius of gyration of hydrolysis residues calculated from MD simulations of 2C-WT and 2C-T323A bound to ATP. Data represents average of independent biological replicates and is presented as mean ± SD (n=3). (A–F) 2-way ANOVA with Tukey’s multiple comparisons test (*P<0.05, **P<0.01, ***P<0.001, ****P<0.0001).
Figure 6.
Figure 6.. CVB3-T323A has a replicative advantage in mice
(A) Viral titers of supernatants from C2C12 cells transfected with siRNA targeting Trim7 or non-targeting control and infected with CVB3 at 2, 5, or 20 MOI for 24 h, quantified by plaque assay. (B) Same as (A), in mouse primary cardiomyocytes (CM) infected with CVB3 at 1 MOI for 48 h. (C) HeLa cells expressing Fluc, hTRIM7, or mTrim7 were infected with CVB3-GFP (WT or 2C-T323A) for 8 h. Viral infectivity was determined by flow cytometry. (D) Viral titers in liver and spleen of mice administrated LNPs loaded with Fluc or mTrim7 mRNA and then infected with WT or 2C-T323A CVB3 (i.p., 104 PFU, 2 d). Schematic created with Biorender.com. (E) Trim7 expression in mouse tissue, assessed by Western blot. (F) Viral titers in thigh muscle, heart, liver, and spleen of mice challenged with CVB3-WT or CVB3-T323A (i.m., 106 PFU, 2 d). (G) Same as (F), viral titers in blood. (H) Viral titers in thigh heart, liver, and spleen of mice challenged with CVB3-WT or CVB3-T323A (i.p., 104 PFU, 2 d). In D, n = 7, one experiment. In F, G, H, n = 3–5 mice per group, three independent experiments. (A, B, D, and G) unpaired t-test (*P< 0.05, **P<0.01, ***P<0.001, or exact P value specified). (C, F, and H) 2-way ANOVA with Sidak’s multiple comparisons test (****P<0.0001, or exact P value specified). Dotted line is limit of detection.
Figure 7.
Figure 7.. CVB3-T323A causes increased pathogenicity in mice
(A) Daily weights of mice challenged with CVB3-WT or CVB3-T323A (i.m., 106 PFU). (B) Survival of mice from (A). (C–D) Images of peritoneal cavity from mice euthanized 3 and 7 d post-infection. Red arrow: necrotic fat. (E) Viral titers in pancreata of mice challenged with CVB3-WT or CVB3-T323A (i.m., 106 PFU, 3 d). (F–I) Hematoxylin and eosin staining of pancreata and perigonadal white adipose tissue (3 and 7d post-infection) Scale bar, 100 μm. In F and G, white asterisk: islets of Langerhans; black asterisk: injury; black arrowheads: inflammation. In H and I, black asterisk: necrotic adipocytes. A–E represent three (A–D) or two (E) independent experiments, 3–5 mice per group. n=11 (A); n=13 (B); n = 9 (e); n=4 per group (F, H); n=4 PBS, 9 WT, 10 T323A (G); n=1 PBS, 2 WT, 2 T323A (I). (B) Log-rank (Mantel-Cox) test (****P<0.0001). (E) unpaired t-test (***P<0.001).

References

    1. Abraham MJ, Murtola T, Schulz R, Páll S, Smith JC, Hess B, and Lindah E (2015). Gromacs: High performance molecular simulations through multi-level parallelism from laptops to supercomputers. SoftwareX 1–2, 19–15.
    1. Aguilera ER, Nguyen Y, Sasaki J, and Pfeiffer JK (2019). Bacterial Stabilization of a Panel of Picornaviruses. MSphere 4(2), e00183–19. - PMC - PubMed
    1. Althof N, Harkins S, Kemball CC, Flynn CT, Alirezaei M, and Whitton JL (2014). In Vivo Ablation of Type I Interferon Receptor from Cardiomyocytes Delays Coxsackieviral Clearance and Accelerates Myocardial Disease. J. Virol 88, 5087–5099. - PMC - PubMed
    1. Amadei A, Linssen ABM, and Berendsen HJC (1993). Essential dynamics of proteins. Proteins Struct. Funct. Bioinforma 17(4), 412–425. - PubMed
    1. Amamuddy OS, Verkhivker GM, and Bishop ÖT (2020). Impact of early pandemic stage mutations on molecular dynamics of SARS-CoV-2 MPro. J. Chem. Inf. Model 60, 5080–5102. - PMC - PubMed

Publication types

MeSH terms

LinkOut - more resources