. 2021 Aug;23(8):907-919.
doi: 10.1016/j.jmoldx.2021.04.014. Epub 2021 May 29.

SARS-CoV-2 RNA Quantification Using Droplet Digital RT-PCR

Affiliations

SARS-CoV-2 RNA Quantification Using Droplet Digital RT-PCR

Natalie N Kinloch et al. J Mol Diagn. 2021 Aug.

Abstract

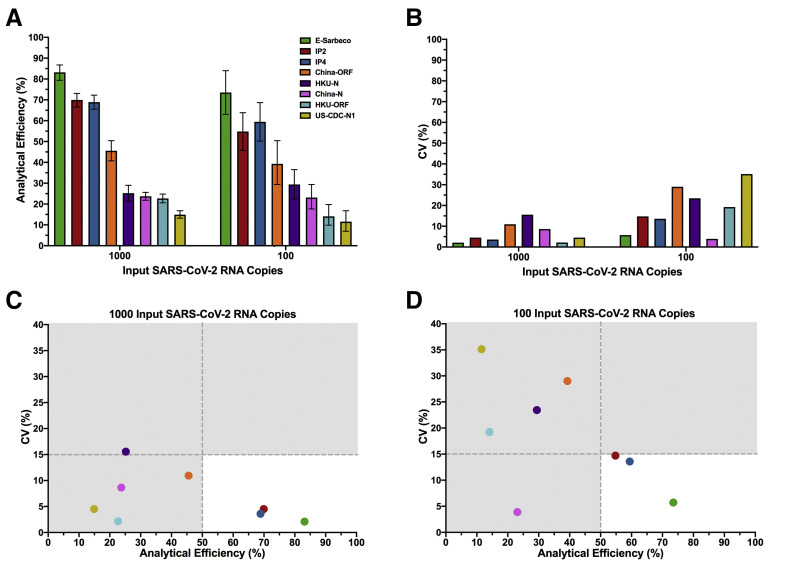
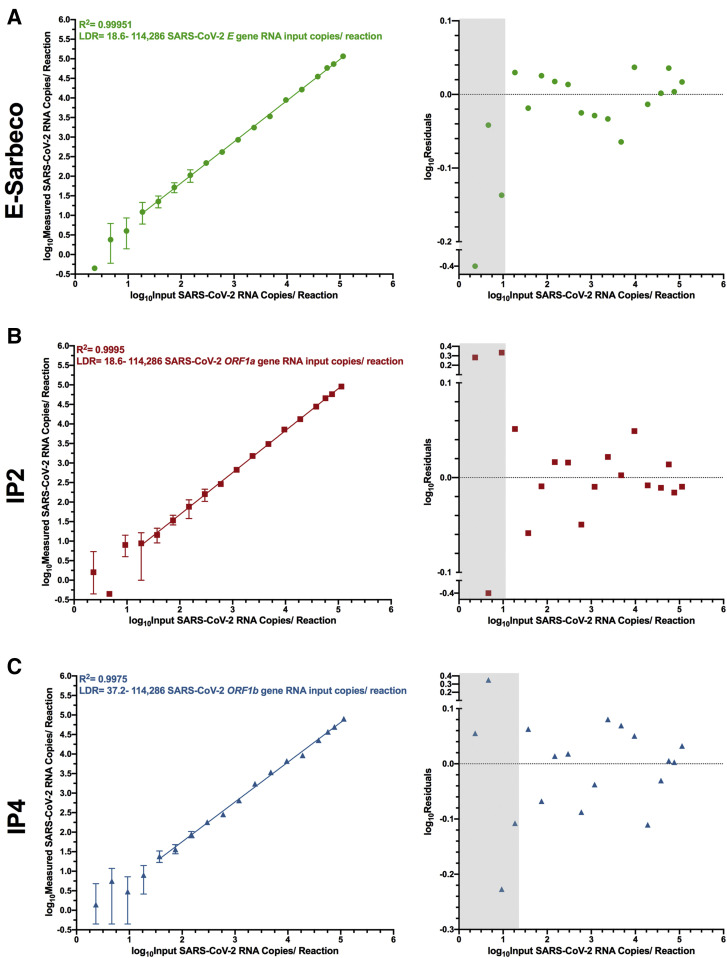
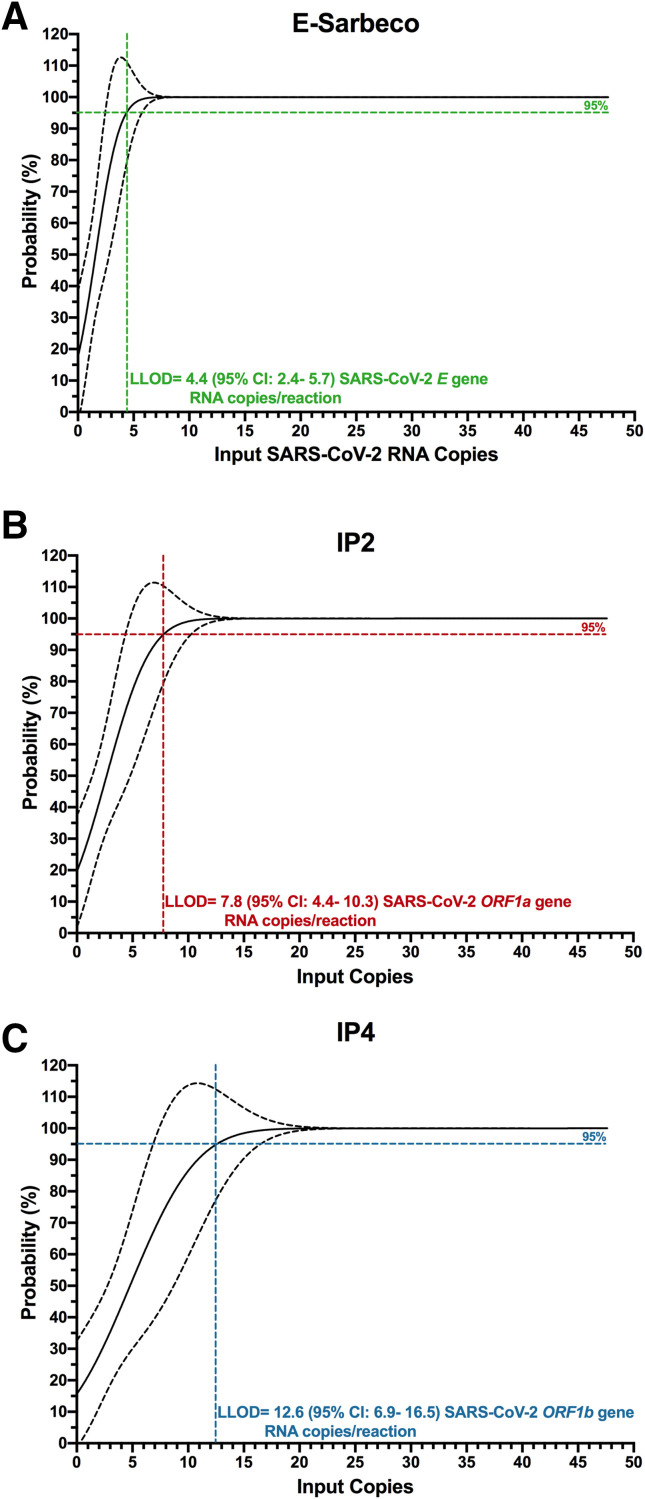
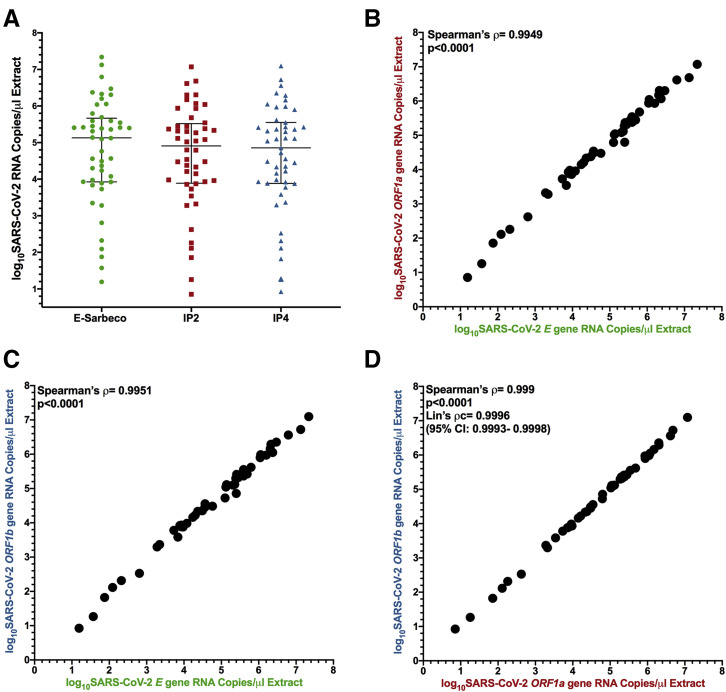
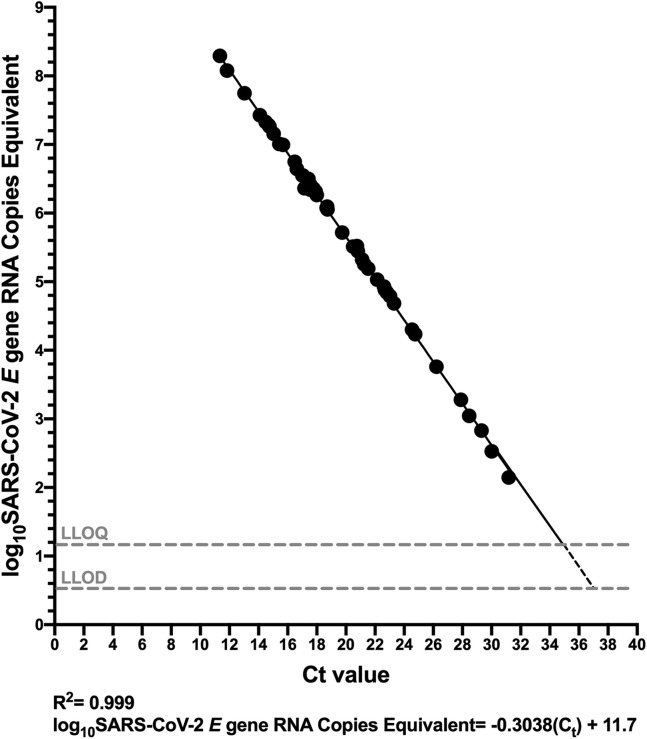
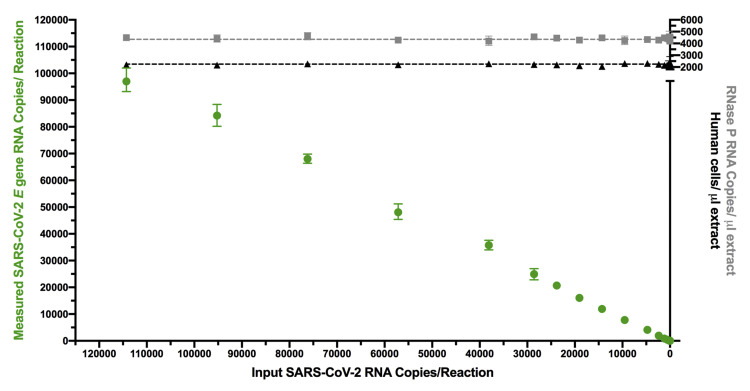
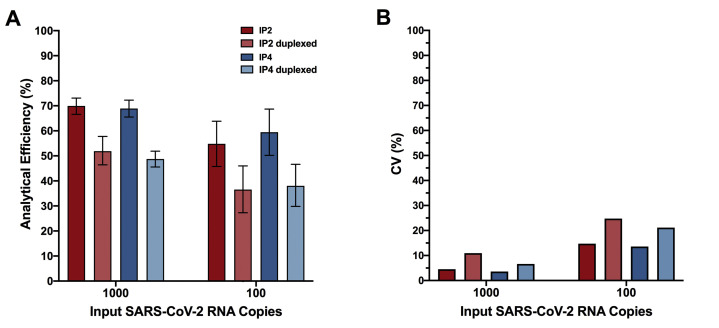
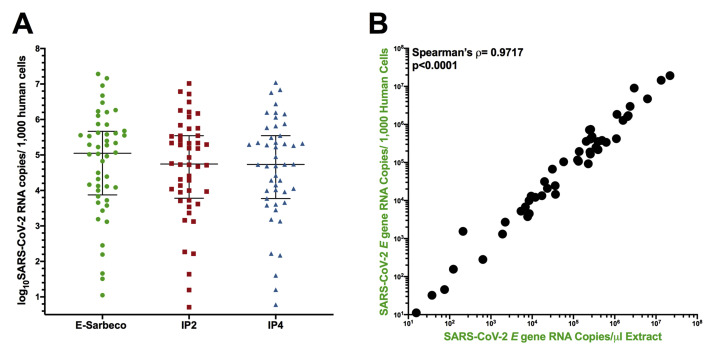
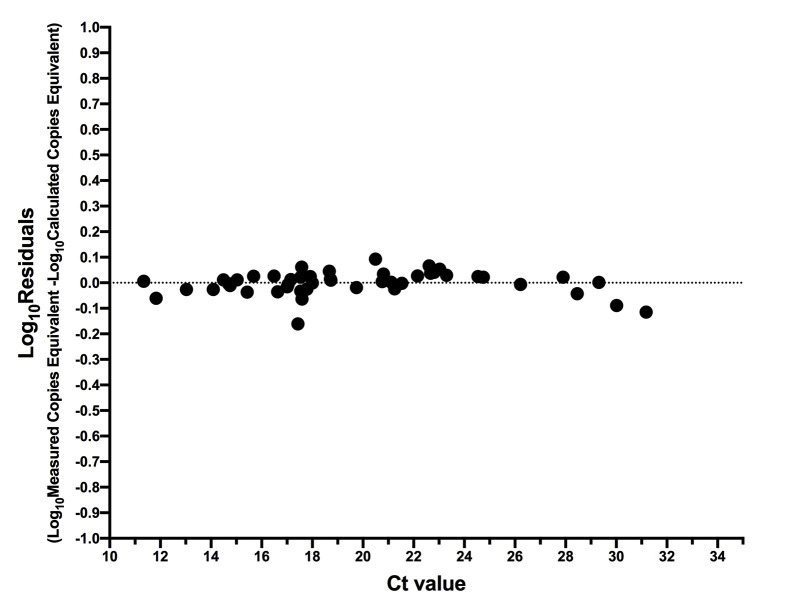
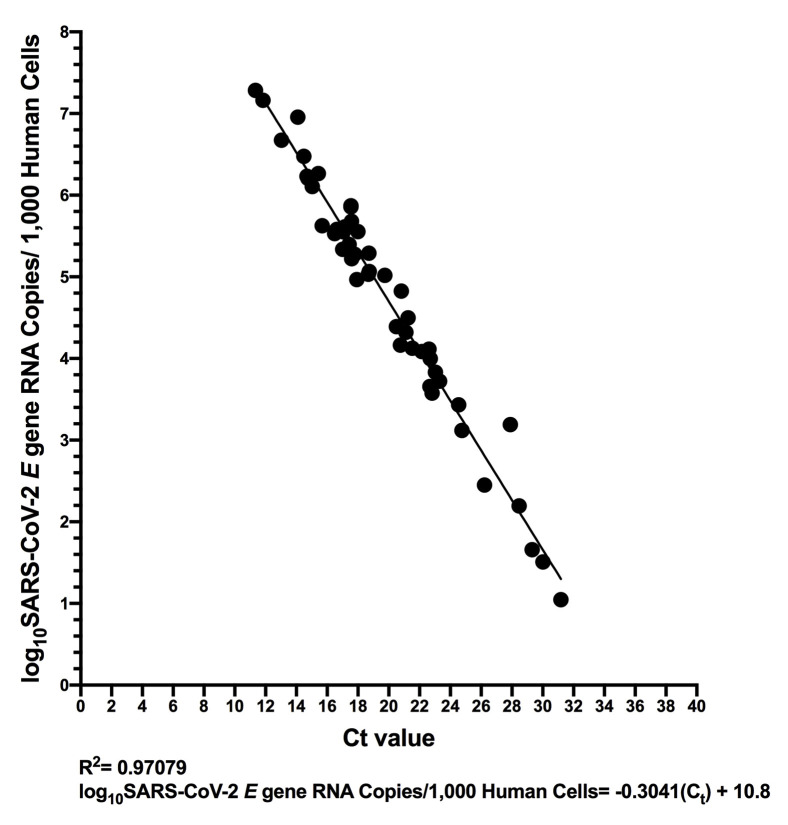
Quantitative viral load assays have transformed our understanding of viral diseases. They hold similar potential to advance COVID-19 control and prevention, but SARS-CoV-2 viral load tests are not yet widely available. SARS-CoV-2 molecular diagnostic tests, which typically employ real-time RT-PCR, yield semiquantitative results only. Droplet digital RT-PCR (RT-ddPCR) offers an attractive platform for SARS-CoV-2 RNA quantification. Eight primer/probe sets originally developed for real-time RT-PCR-based SARS-CoV-2 diagnostic tests were evaluated for use in RT-ddPCR; three were identified as the most efficient, precise, and sensitive for RT-ddPCR-based SARS-CoV-2 RNA quantification. For example, the analytical efficiency for the E-Sarbeco primer/probe set was approximately 83%, whereas assay precision, measured as the coefficient of variation, was approximately 2% at 1000 input copies/reaction. Lower limits of quantification and detection for this primer/probe set were 18.6 and 4.4 input SARS-CoV-2 RNA copies/reaction, respectively. SARS-CoV-2 RNA viral loads in a convenience panel of 48 COVID-19-positive diagnostic specimens spanned a 6.2log10 range, confirming substantial viral load variation in vivo. RT-ddPCR-derived SARS-CoV-2 E gene copy numbers were further calibrated against cycle threshold values from a commercial real-time RT-PCR diagnostic platform. This log-linear relationship can be used to mathematically derive SARS-CoV-2 RNA copy numbers from cycle threshold values, allowing the wealth of available diagnostic test data to be harnessed to address foundational questions in SARS-CoV-2 biology.


Figures

Figure 1
Figure 1
Thermal cycling optimization. A: Droplet digital RT-PCR (RT-ddPCR) plots for annealing/extension under a 50°C to 63°C thermal gradient for the E-Sarbeco primer/probe set. A representative RT-ddPCR plot for a no template control (NTC), which only included nontarget DNA/RNA (Materials and Methods) at the temperature used in subsequent experiments, is also shown. Positive droplets (blue) are above the threshold (pink line); negative droplets (gray) are below the line. Colored boxes below each well indicate whether results met standards for inclusion (green) or not (red) (Materials and Methods). B: Same as A, but for HKU-ORF primer/probe set.
Figure 2
Figure 2
Analytical efficiency and precision of primer/probe sets. A: Analytical efficiency of each primer/probe set, calculated as the measured divided by the input SARS-CoV-2 RNA copies multiplied by 100%, is shown for reactions containing 1000 and 100 input copies of synthetic SARS-CoV-2 RNA. Bars represent 95% total Poisson CIs. B: Precision of each primer/probe set, defined as the coefficient of variation [expressed as a percentage, coefficient of variation (CV)] of measured copies, is shown for reactions containing 1000 and 100 input copies of synthetic SARS-CoV-2 RNA. C: Plotting precision versus analytical efficiency at 1000 input SARS-CoV-2 RNA copies identifies E-Sarbeco, IP2, and IP4 primer/probe sets as having analytical efficiencies >50% and CV (%) <15% (white background). All other primer/probe sets had analytical efficiencies <50% and in many cases CV (%) >15% (gray background). D: Same as C, but for 100 input SARS-CoV-2 RNA copies.
Figure 3
Figure 3
Linear dynamic range (LDR) of E-Sarbeco, IP2, and IP4 droplet digital RT-PCR (RT-ddPCR) assays. A: Left: log10 measured SARS-CoV-2 RNA copies over serial dilutions of synthetic SARS-CoV-2 RNA standards ranging from 114,286 to 2.32 copies/reaction (shown as log10 values), using the E-Sarbeco primer/probe set. Error bars indicate 95% total Poisson CIs for two merged replicates, where in some cases error bars are too small to visualize. The regression line joins all data points included in the LDR, where the lower boundary of the LDR represents the lower limit of quantification of the assay. Data points that yielded undetectable measurements are set arbitrarily to −0.35log10 measured copies/reaction for visualization. Right: Log10 residuals, calculated as log10 measured SARS-CoV-2 RNA copies/reaction minus log10 calculated SARS-CoV-2 RNA copies/reaction from the LDR regression. Gray shading indicates data points outside the LDR. Residuals for data points that yielded undetectable measurements are arbitrarily set to −0.4 for visualization. B: Same as A, but for the IP2 primer/probe set. C: Same as A, but for the IP4 primer/probe set.
Figure 4
Figure 4
Lower limit of detection (LLOD) of the E-Sarbeco, IP2, and IP4 droplet digital RT-PCR (RT-ddPCR) assays. A: The probability of detecting SARS-CoV-2 RNA (%) in 1:2 in serial dilutions of synthetic SARS-CoV-2 RNA from 47.6 to 0.74 input copies/reaction using the E-Sarbeco primer/probe set is analyzed using probit regression (solid black line; dashed line denotes the 95% CI). The LLOD, defined as the concentration of SARS-CoV-2 RNA in a reaction where the probability of detection in the assay was 95%, was interpolated from the probit curve and is shown as a colored dashed line. B: Same as A, but for the IP2 primer/probe set. C: Same as A, but for the IP4 primer/probe set.
Figure 5
Figure 5
Log10SARS-CoV-2 RNA loads in diagnostic specimens. A: SARS-CoV-2 E (green circles), ORF1a (red squares), and ORF1b (blue triangles) gene copy numbers, expressed as RNA copies/microliter of nucleic acid extract. Line and bars indicate median and interquartile range, respectively. B: Spearman's correlation (ρ) between log10 SARS-CoV-2 E and ORF1a gene RNA copies/microliter extract. C: Spearman's correlation (ρ) between log10 SARS-CoV-2 E and ORF1b gene RNA copies/microliter extract. D: Spearman's correlation (ρ) and Lin's concordance correlation (ρc) between log10 SARS-CoV-2 ORF1a and ORF1b gene RNA copies/microliter extract.
Figure 6
Figure 6
Relationship between SARS-CoV-2 RNA copies equivalent and diagnostic test cycle threshold (Ct) value. Ct value, determined using the LightMix 2019-nCoV real-time RT-PCR assay (E gene target) is plotted against log10 SARS-CoV-2 E gene RNA copies equivalent, which represents the number of SARS-CoV-2 RNA copies measured by droplet digital RT-PCR (RT-ddPCR) in 9 μL of extract (the template volume in the LightMix assay). The linear regression (solid black line) transitions to a dashed line below the LLOQ.
Supplemental Figure S1
All experiments using synthetic SARS-CoV-2 synthetic standards were performed in a consistent background of human nucleic acids to mimic a real human sample. Example experiment showing consistent levels of background human cells/microliter extract (determined by dividing measured human RPP30 DNA copy number by two; black triangles), and human RNAse P RNA levels (gray squares) across a titration of SARS-CoV-2 synthetic RNA standards, measured using the E-Sarbeco primer/probe set (green circles). Error bars indicate 95% total Poisson CIs for two merged replicates, where in some cases, error bars are too small to visualize. Gray dashed lines (RNase P) and black dashed lines (RPP30) indicate copies measured in control experiments lacking SARS-CoV-2 RNA.
Supplemental Figure S2
Duplexing the IP2 and IP4 primer/probe sets reduces analytical efficiency and precision. A: Analytical efficiency of SARS-CoV-2 quantification was evaluated for the IP2 and IP4 primer/probe sets when used in separate reactions (dark red and dark blue, respectively) and when duplexed (light red and light blue, respectively), in reactions containing 1000 and 100 viral RNA input copies. Error bars represent 95% total Poisson CIs. B: Same as A, but for assay precision (coefficient of variation, CV).
Supplemental Figure S3
Log10 SARS-CoV-2 RNA loads in diagnostic specimens, normalized to human cells sampled. A: SARS-CoV-2 E (green circles), ORF1a (red squares), and ORF1b (blue triangles) gene copy numbers, expressed as RNA copies/1000 human cells. Line and bars indicate median and interquartile range, respectively. B: Spearman's correlation (ρ) between SARS-CoV-2 RNA copies/μL extract and RNA copies/1000 human cells.
Supplemental Figure S4
Residuals of relationship between SARS-CoV-2 RNA copies equivalent and diagnostic test cycle threshold (Ct) value. Log10 residuals are calculated as log10 measured SARS-CoV-2 RNA copies equivalent minus log10 calculated SARS-CoV-2 RNA copies equivalent from the regression line shown in Figure 6.
Supplemental Figure S5
Relationship between SARS-CoV-2 RNA copies/1000 human cells and cycle threshold (Ct) value. Same data as shown in Figure 6, but where the measured SARS-CoV-2 RNA copies/μL extract were normalized to copies/1000 human cells. The linear regression is shown as a solid black line.

Similar articles

Cited by

References

    1. Mellors J.W., Rinaldo C.R., Jr., Gupta P., White R.M., Todd J.A., Kingsley L.A. Prognosis in HIV-1 infection predicted by the quantity of virus in plasma. Science. 1996;272:1167–1170. - PubMed
    1. Mellors J.W. Viral-load tests provide valuable answers. Sci Am. 1998;279:90–93. - PubMed
    1. Riddler S.A., Mellors J.W. HIV-1 viral dynamics and viral load measurement: implications for therapy. AIDS Clin Rev. 1997:47–65. - PubMed
    1. Mellors J.W., Muñoz A., Giorgi J.V., Margolick J.B., Tassoni C.J., Gupta P., Kingsley L.A., Todd J.A., Saah A.J., Detels R., Phair J.P., Rinaldo C.R., Jr. Plasma viral load and CD4+ lymphocytes as prognostic markers of HIV-1 infection. Ann Intern Med. 1997;126:946–954. - PubMed
    1. Durante-Mangoni E., Zampino R., Portella G., Adinolfi L.E., Utili R., Ruggiero G. Correlates and prognostic value of the first-phase hepatitis C virus RNA kinetics during treatment. Clin Infect Dis. 2009;49:498–506. - PubMed

Publication types