. 2021 Oct 1:189:113307.
doi: 10.1016/j.bios.2021.113307. Epub 2021 May 15.

Electrophoretic mobility shift as a molecular beacon-based readout for miRNA detection

Affiliations

Electrophoretic mobility shift as a molecular beacon-based readout for miRNA detection

Getulio P Oliveira-Jr et al. Biosens Bioelectron. .

Abstract

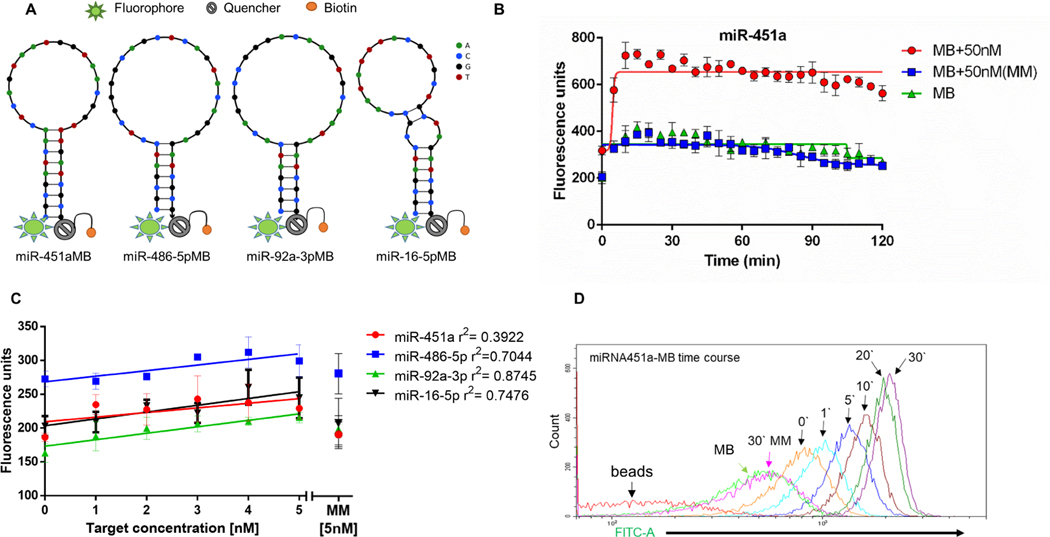
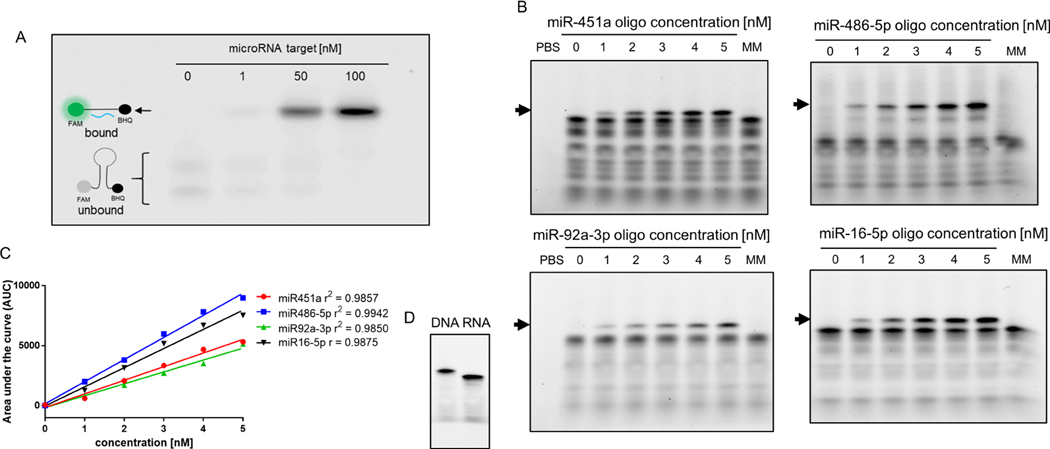
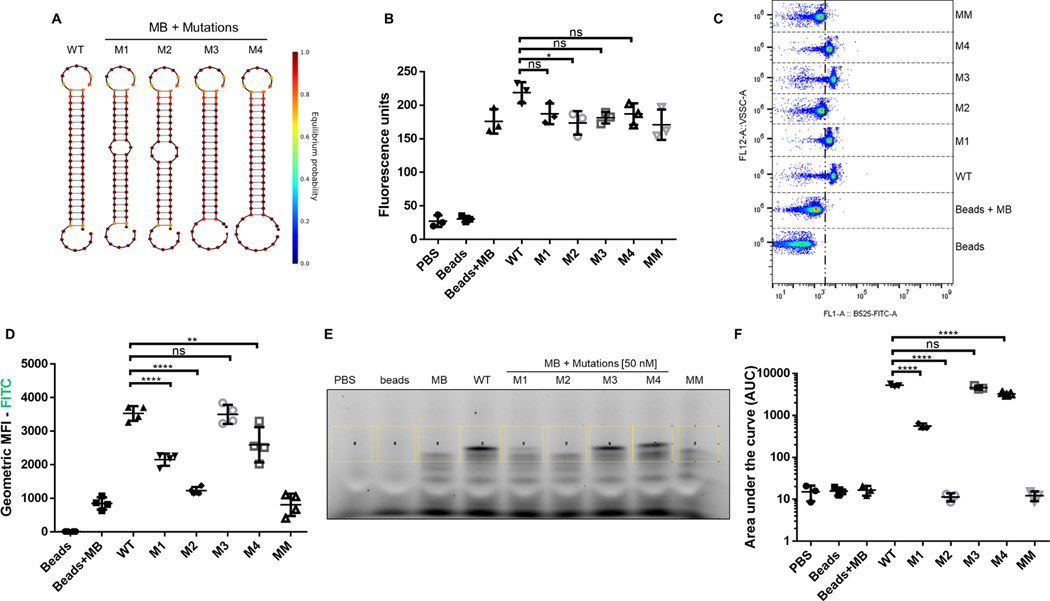
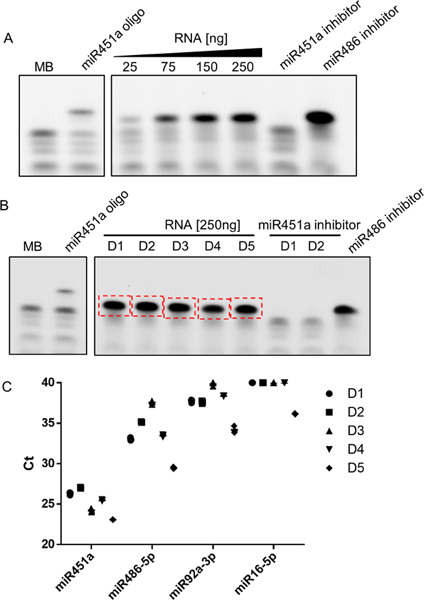
MicroRNAs are short, non-coding RNA sequences involved in gene expression regulation. Quantification of miRNAs in biological fluids involves time consuming and laborious methods such as Northern blotting or PCR-based techniques. Molecular beacons (MB) are an attractive means for rapid detection of miRNAs, although the need for sophisticated readout methods limits their use in research and clinical settings. Here, we introduce a novel method based on delayed electrophoretic mobility, as a quantitative means for detection of miRNAs-MB hybridization. Upon hybridization with the target miRNAs, MB form a fluorescent duplex with reduced electrophoretic mobility, thus bypassing the need for additional staining. In addition to emission of light, the location of the fluorescent band on the gel acts as an orthogonal validation of the target identity, further confirming the specificity of binding. The limit of detection of this approach is approximately 100 pM, depending on the MB sequence. The method is sensitive enough to detect specific red blood cell miRNAs molecules in total RNA, with single nucleotide specificity. Altogether, we describe a rapid and affordable method that offers sensitive detection of single-stranded small DNA and RNA sequences.

Keywords: Electrophoretic mobility; Gel electrophoresis; Molecular beacons; microRNA (miRNA).


Conflict of interest statement

Conflict of Interest

Beth Israel Deaconess Medical Center (GPO, ICG), and Boston Children’s Hospital (WPW) have submitted a patent covering the methods described in this manuscript. The other co-authors declare no conflict of interest.

Figures

Figure 1.
Figure 1.. Fluorometry and flow cytometry-based quantification of MB-miRNAs target analog hybridization.
(A) Secondary conformation of the four MBs used (miR451aMB, 486–5pMB, 92a-3pMB, 16–5pMB) at 55°C. Each MB is composed of a 5`-end 6-FAM, a CGCGATC stem sequence, a loop sequence complementary to its miRNA target, a 3`-end internal quencher, linker and a biotin molecule. (B) Kinetic fluorescence measurements (every 5 min for 2h) generated by the MB alone (green line), MB-target (red line), and mismatched-target (blue line) hybridization. Lines were fitted using a nonlinear regression model. The fluorescence reached a peak between 20 and 30 min of incubation at 55°C. (C) Dose dependence fluorescence values of the MB-miRNAs target analog from 1 to 5 nM, for 30 min at 55°C. Lines were fitted using a linear regression of MB-miRNAs target analogs hybridization showing the respective r2 values (D) Flow cytometric kinetic measurements of the 500 nm bead-attached MB following incubation with 50 nM of either mismatched miRNA (light purple histogram), or target miRNA measured at 0 (orange), 1 (light blue), 5 (cobalt blue), 10 (brown), 20 (green), or 30 (dark purple) min. For time 0, there was a delay of about 10–15 seconds between adding the miRNA to the MB-beads, mixing and actual acquisition of the data. The X-axis represents the intensity of fluorescence emitted by the MB following interaction with the miRNA. Data represent three independent experiments. Error bars indicate the s.e.m. *
Figure 2.
Figure 2.. Electrophoretic mobility patterns of unbound and bound molecular beacons (MB).
(A) miR451aMB (100 nM) was hybridized with increasing concentration of hsa-miR-451a target analogs (0, 1, 50, and 100 nM), followed by gel electrophoresis. Top band represents the duplex MB-target hybridization (lower electrophoretic mobility), while bottom bands represent unbound MB (higher electrophoretic mobility)(B) MBs (50 nM) were incubated with increasing concentrations of corresponding miRNA target analogs (0 to 5 nM). The pattern of top (duplex MB-target analog), and bottom (unbound MB) bands was maintained. (C) Linear regression was calculated using area under the curve (AUC) values measured from positive fluorescence bands MB-miRNA target analog (top bands). (D) miR451aMB (50 nM) was incubated with same concentration (50 nM) of either a DNA backbone has-miR451a or RNA backbone hsa-miR451a.
Figure 3.
Figure 3.. Electrophoretic mobility shift differentiates certain hsa-miR-451a mutated sequences.
(A) Secondary structures of different hybridization patterns between miR451aMB hybridized with WT or hsa-miR-451a mutated sequences M1 (center C to A), M2 (center CC to AA), M3 (5’-end U to C), and M4 (5’-end UU to CC). Heat map represents the minimum free energy between the hybridization of each base pair. (B) One-hundred nM of miR451a MB were coupled with 500 nm streptavidin beads and hybridized with 50 nM of hsa-miR451a WT or mutated sequences (M1 to M4). Fluorescence was measured by fluorometry after 30 min incubation at 55°C. (C) Flow cytometric analysis of MB-beads incubated with 50 nM of either miR451a (WT), various mutations of miR451a (M1-M4), or MM (miR486). X-axis shows fluorescence intensity of the FAM MB fluorochrome, and Y-axis represent violet side scatter values of the 500 nm beads (D) Flow cytometry geometric mean fluorescence intensity analysis of miR451aMB hybridized with hsa-miR-451a WT or mutated sequences M1 to M4 (E) Gel electrophoresis of the miR451aMB hybridized with has-miR-451a WT or mutated sequences M1 to M4. Yellow squares represents the region of interest for measuring the area under the curve (AUC). (F) AUC of miR451aMB hybridized with WT or mutated sequences. Data represent three to four independent experiments. Error bars indicate the s.e.m. One-way Anova, and Dunnett’s multiple comparison test were performed. One asterisk represents p ≤ 0.05, **p ≤ 0.01, ***p≤ 0.001, ****p≤ 0.0001
Figure 4.
Figure 4.. Identification of endogenous hsa-miR-451a by MB hybridization and electrophoretic mobility shift.
(A) Detection of hsa-miR-451a in increasing concentrations of total RNA purified from RBCs isolated from a donor. The miR451a signal did not form when the isolated total RNA was preincubated with miR451a inhibitor. (B) Two hundred fifty nanograms of total RNA RBCs isolated from five self-declared healthy donors (D1 to D5) were incubated with miR451aMB. The MB-miRNAs hybrid bands (red rectangles) were cut, and the eluted RNA was prepared for qPCR. (C) Confirmation of the identity of the target in MB-miRNAs bands. Quantitative PCR data obtained from five donors shows the lowest Ct values for miR451a, followed by miR-16-5p. miR92a was not identified in any of the samples, and the sample were represented by Ct of 40

Similar articles

Cited by

References

    1. Adegoke O, Park EY, 2017. Journal of Materials Chemistry B 5(16), 3047–3058. - PubMed
    1. Baker MB, Bao G, Searles CD, 2012. Nucleic acids research 40(2), e13–e13. - PMC - PubMed
    1. Bhadra S, Ellington AD, 2014. Rna 20(8), 1183–1194. - PMC - PubMed
    1. Bonnet G, Tyagi S, Libchaber A, Kramer FR, 1999. Proceedings of the National Academy of Sciences 96(11), 6171–6176. - PMC - PubMed
    1. Burris KP, Wu T-C, Vasudev M, Stroscio MA, Millwood RJ, Stewart CN, 2013. IEEE transactions on nanobioscience 12(3), 233–238. - PubMed

MeSH terms

LinkOut - more resources