. 2021 May 1;10(5):549.
doi: 10.3390/pathogens10050549.

Regulation of Expression of the TIR-Containing Protein C Gene of the Uropathogenic Escherichia coli Strain CFT073

Affiliations

Regulation of Expression of the TIR-Containing Protein C Gene of the Uropathogenic Escherichia coli Strain CFT073

Julia Ittensohn et al. Pathogens. .

Abstract

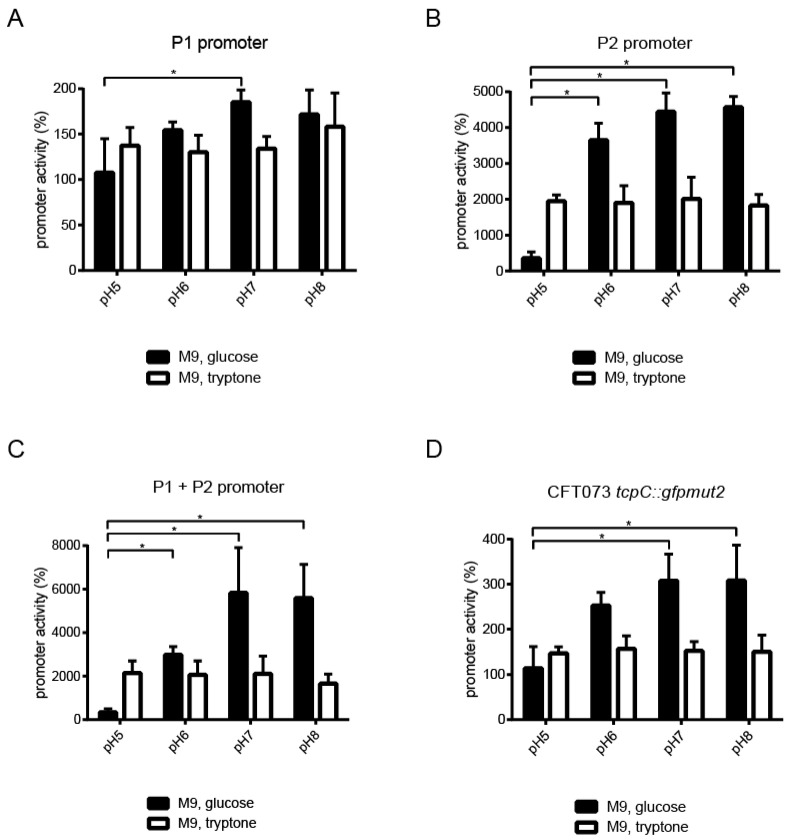
The uropathogenic Escherichia coli strain CFT073 causes kidney abscesses in mice Toll/interleukin-1 receptor domain-containing protein C (TcpC) dependently and the corresponding gene is present in around 40% of E. coli isolates of pyelonephritis patients. It impairs the Toll-like receptor (TLR) signaling chain and the NACHT leucin-rich repeat PYD protein 3 inflammasome (NLRP3) by binding to TLR4 and myeloid differentiation factor 88 as well as to NLRP3 and caspase-1, respectively. Overexpression of the tcpC gene stopped replication of CFT073. Overexpression of several tcpC-truncation constructs revealed a transmembrane region, while its TIR domain induced filamentous bacteria. Based on these observations, we hypothesized that tcpC expression is presumably tightly controlled. We tested two putative promoters designated P1 and P2 located at 5' of the gene c2397 and 5' of the tcpC gene (c2398), respectively, which may form an operon. High pH and increasing glucose concentrations stimulated a P2 reporter construct that was considerably stronger than a P1 reporter construct, while increasing FeSO4 concentrations suppressed their activity. Human urine activated P2, demonstrating that tcpC might be induced in the urinary tract of infected patients. We conclude that P2, consisting of a 240 bp region 5' of the tcpC gene, represents the major regulator of tcpC expression.

Keywords: glucose; hydrogen-Ion concentration; promoter region; uropathogenic Escherichia coli; virulence.


Conflict of interest statement

Authors have no conflict of interest to declare.

Figures

Figure 1
Figure 1
Overexpression of tcpC impairs growth of the uropathogenic E. coli strain CFT073. We used untransformed CFT073 as ATc control (A), CFT073 transformed with pASK-IBA3plus (B) as empty vector control or with tcpC fused to eYFP (C). We further transformed CFT073with pASK-IBA5plus (D) as empty vector control or with tcpC or E244A-mutated tcpC fused to a Strep-tag (E,F). The plasmids contained an ATc-inducible promoter. The plasmids were not induced (dots), induced with ATc (0.2 µg/mL) at the initiation of the culture (triangles) or induced at an OD600 of 0.5 (diamonds). Bacteria were cultivated in LB medium for the indicated periods. The graphs represent three independent experiments. * p < 0.05 not induced vs. induced at OD600 = 0.5 and not induced vs. induced at t = 0; # p < 0.05 not induced vs. induced at t = 0; § p < 0.05 CFT073 pASK-IBA5 induced at t = 0 vs. CFT073 pStrep-tag tcpC-E244A induced at t = 0; $ p < 0.05 CFT073 pTcpC-eYFP induced at OD600 = 0.5 vs. CFT073 pASK-IBA3 induced at OD600 = 0.5; % p < 0.05 CFT073 pStrep-tag tcpC induced at OD600 = 0.5 vs. CFT073 pASK-IBA5 induced at OD600 = 0.5; CFT073 pStrep-tag tcpC-E244A induced at OD600 = 0.5 vs. CFT073 pASK-IBA5 induced at OD600 = 0.5; ANOVA post-hoc Tukey’s test.
Figure 2
Figure 2
The TIR domain of TcpC induces filamented bacteria. CFT073 transformed with pAMP, which contained no eYFP, served as the negative control (A). We transformed CFT073 with the IPTG-inducible eYFP-reporter plasmids p(tcpC 1–150):eYFP:AMP (B), p(tcpC 127–507):eYFP:AMP (C), p(tcpC 1–507):eYFP:AMP (D), p(tcpC 508–924):eYFP:AMP (E), p(tcpC 127–924):eYFP:AMP (F) or p(tcpC 1–924):eYFP:AMP (G). We analyzed the expression of the different truncated or full-length constructs of tcpC as well as the morphology of the bacteria by fluorescence microscopy four hours post induction with IPTG. Bacteria were cultured in M9-minimal medium containing glucose, thiamine and nicotinic acid. We repeated the experiment once with identical results.
Figure 3
Figure 3
Intracellular distribution of TcpC four hours post induction. High-resolution (magnification ×1000) fluorescence-microscopy of the CFT073 transformants analyzed in Figure 2. Bacteria were transformed with the plasmids as indicated (AG) and cultured in M9-minimal medium containing glucose, thiamine and nicotinic acid (A,CG), except in (B) where LB medium was used. We repeated the experiment once with identical results.
Figure 4
Figure 4
Intracellular distribution of TcpC 24 h post induction. High-resolution (magnification ×1000) fluorescence-microscopy of the CFT073 transformants analyzed in Figure S2. The plasmids used are indicated in (AF). We repeated the experiment once with identical results.
Figure 5
Figure 5
Genomic location and activity of putative promoter regions controlling the tcpC gene. The scheme depicts the central part of the serU island of CFT073. Top line illustrates the position of this part of the genome within the chromosome of CFT073. Black arrows illustrate gene sizes and the direction of gene transcription. The positions of the putative promotors 1 (P1) and 2 (P2) are also indicated (A). CFT073 was transformed either with the plasmids pPc2397:gfpmut2:KAN, pPc2398:gfpmut2:KAN or p(Pc2397–Pc2398):gfpmut2:KAN containing the promoter P1, or P2 or P1 plus P2, respectively, as indicated (BD). In addition, we analyzed the chromosomal reporter strain CFT073 tcpC::gfpmut2 (E). Untransformed, wild-type CFT073 served as negative control (F). Bacteria were incubated for four hours in M9-minimal medium containing glucose (0.4% = 22.2 mmol/L) and analyzed by flow cytometry directly after the incubation period without fixation. In addition to the depicted experiment, we repeated the experiment twice with identical results.
Figure 6
Figure 6
Detection of tcpC transcripts and genomic position of the P2 promoter. We cultured CFT073 or CFT073 transformed with the plasmid pTcpC overnight in M9-minimal medium containing glucose (0.4% = 22.2 mmol/L), pH8 until an OD600 of 0.65 was reached. (A) We prepared RNA and reverse transcribed or not (as indicated) using the primer c2398rev and performed a PCR using the primers c2398fw and c2398rev to amplify the almost complete tcpC (c2398) mRNA. We also used primers c2397fw and c2398rev to detect a long transcript encompassing the genes c2397 and c2398. (B) We cultured CFT073, prepared RNA and reverse transcribed or not as indicated and described in (A). PCR reactions were also performed as described in (A) but in addition we used the primer GSP3 (forward primer) and GSP2 (reverse primer) to amplify a shorter fragment of c2398. Genomic DNA of CFT073 served as the positive PCR control in (A,B). (C) For 5′ RACE PCR we synthesized cDNA using the primer GSP1. We performed a control PCR using the primers GSP3 (forward primer) and GSP2 (reverse primer) to detect tcpC (c2398) mRNA. To detect the start of the c2398 transcript we used the forward primer AAP and the reverse primer GSP2. We only detected a transcript post addition of oligo C by terminal deoxynucleotidyl transferase (TdT) as expected. (D) We re-amplified the 5′ RACE tcpC band depicted in (C) using the forward primer AUAP and GSP2 (rev. primer). (E) Sequencing of the PCR product depicted in (D) revealed that the transcript starts at position 2202778 of the CFT073 genome, or 44 bp 5′ of a possible start codon of c2398. Binding sites of all primers used for reverse transcription PCR and 5′ RACE PCR are depicted in Figure 12.
Figure 7
Figure 7
High pH induces the tcpC promoter. CFT073 was transformed either with the plasmids pPc2397:gfpmut2:KAN, pPc2398:gfpmut2:KAN or p(Pc2397–Pc2398):gfpmut2:KAN containing the promoter P1, or P2 or P1 plus P2, respectively (AC). In addition, we analyzed the chromosomal reporter strain CFT073 tcpC::gfpmut2 (D). We incubated bacteria overnight in M9-minimal medium-containing either glucose or tryptone at increasing pH as indicated and measured the expression of GFPmut2 by flow cytometry determining the mean fluorescence intensity (MFI). The values indicated by the bars represent three independent experiments and were normalized to MFI of wild-type CFT073 cultured in M9-minimal medium-containing glucose or tryptone at the pH tested. * p < 0.05, ANOVA post-hoc Tukey’s test.
Figure 8
Figure 8
Glucose stimulates activity of the tcpC promoter. We cultured CFT073 carrying the plasmids described in Figure 5 in M9-minimal medium in the absence of glucose for 2 h, then added glucose in concentrations as indicated in the graphs for 3 h and measured the expression of GFPmut2 by flow cytometry. Since P2 was considerably more active than P1 we analyzed the reactivity of this promoter towards titrated amounts of glucose as indicated (A) and tested P1 (B) and P1 + P2 (C) only in the presence of the maximal glucose concentration. (D) demonstrates the chromosomal reporter strain CFT073 tcpC::gfpmut2. * p < 0.05, ANOVA post-hoc Tukey’s test. The values indicated by the bars represent three independent experiments.
Figure 9
Figure 9
FeSO4 impairs the tcpC promoter. CFT073 transformed with the plasmids pPc2398:gfpmut2:KAN (A,B), or pPc2397:gfpmut2:KAN (C,D), or p(Pc2397–Pc2398):gfpmut2:KAN (E,F), or the mutant strain CFT073 tcpC::gfpmut2 (G,H) were cultured in M9-minimal medium containing glucose in the presence of FeSO4 as indicated in the graphs. Fluorescence intensity of the reporter constructs was measured by flow cytometry 3 h (A,C,E,G) or overnight (B,D,F,H) post addition of FeSO4. * p < 0.05, ANOVA post-hoc Tukey’s test. In addition to the depicted experiment, we repeated the experiment twice with identical results.
Figure 10
Figure 10
The iron chelator 2,2’-bipyridine induces the P2 promoter. CFT073 transformed with the plasmid pPc2398:gfpmut2:KAN were cultured in M9-minimal medium containing glucose in the presence of 2,2’-bipyridine (0.2 mmol/L) or 2,2’-bipyridine (0.2 mmol/L) plus FeSO4 (0.05 mmol/L), as indicated in the graphs. Fluorescence intensity of the reporter construct was measured by flow cytometry after 4 (A) or 24 h (B) of culture. The graphs depict three independent experiments. * p < 0.05, ANOVA post-hoc Tukey’s test.
Figure 11
Figure 11
TcpC promoter is active in human urine. CFT073 pPc2398:gfpmut2:KAN was cultured in human urine diluted with M9-minimal medium supplemented with glucose as indicated in the graphs (A,B). Fluorescence intensity of the reporter constructs was measured by flow cytometry after 4 h (A) or 24 h of culture (B). CFT073 p(Pc2397:gfpmut2:KAN), CFT073 pPc2398:gfpmut2:KAN or CFT073 p(Pc2397–Pc2398):gfpmut2:KAN (C), or the mutant strain CFT073 tcpC::gfpmut2 (D) were cultured overnight in urine (100%) and reporter activity was determined by flow cytometry. CFT073 pAMP served as negative control. * p < 0.05, ANOVA post-hoc Tukey’s test. Graphs in (C,D) depict the results of three independent experiments.
Figure 12
Figure 12
Binding sites of forward and reverse primers for reverse transcription PCR and 5′ RACE PCR.

Similar articles

Cited by

References

    1. Cirl C., Wieser A., Yadav M., Duerr S., Schubert S., Fischer H., Stappert D., Wantia N., Rodriguez N., Wagner H., et al. Subversion of Toll-like receptor signaling by a unique family of bacterial Toll/interleukin-1 receptor domain-containing proteins. Nat. Med. 2008;14:399–406. doi: 10.1038/nm1734. - DOI - PubMed
    1. Snyder G.A., Cirl C., Jiang J., Chen K., Waldhuber A., Smith P., Römmler F., Snyder N., Fresquez T., Durr S., et al. Molecular mechanisms for the subversion of MyD88 signaling by TcpC from virulent uropathogenic Escherichia coli. Proc. Natl. Acad. Sci. USA. 2013;110:6985–6990. doi: 10.1073/pnas.1215770110. - DOI - PMC - PubMed
    1. Newman R.M., Salunkhe P., Godzik A., Reed J.C. Identification and characterization of a novel bacterial virulence factor that shares homology with mammalian Toll/interleukin-1 receptor family proteins. Infect. Immun. 2006;74:594–601. doi: 10.1128/IAI.74.1.594-601.2006. - DOI - PMC - PubMed
    1. Norenberg D., Wieser A., Magistro G., Hoffmann C., Meyer C., Messerer M., Schubert S. Molecular analysis of a novel Toll/interleukin-1 receptor (TIR)-domain containing virulence protein of Y. pseudotuberculosis among Far East scarlet-like fever serotype I strains. Int. J. Med. Microbiol. 2013;303:583–594. doi: 10.1016/j.ijmm.2013.08.002. - DOI - PubMed
    1. Salcedo S.P., Marchesini M.I., Lelouard H., Fugier E., Jolly G., Balor S., Muller A., Lapaque N., Demaria O., Alexopoulou L., et al. Brucella control of dendritic cell maturation is dependent on the TIR-containing protein Btp1. PLoS Pathog. 2008;4:e21. doi: 10.1371/journal.ppat.0040021. - DOI - PMC - PubMed

LinkOut - more resources