. 2021 May 1;10(5):1081.
doi: 10.3390/cells10051081.

AGMO Inhibitor Reduces 3T3-L1 Adipogenesis

Affiliations

AGMO Inhibitor Reduces 3T3-L1 Adipogenesis

Caroline Fischer et al. Cells. .

Abstract

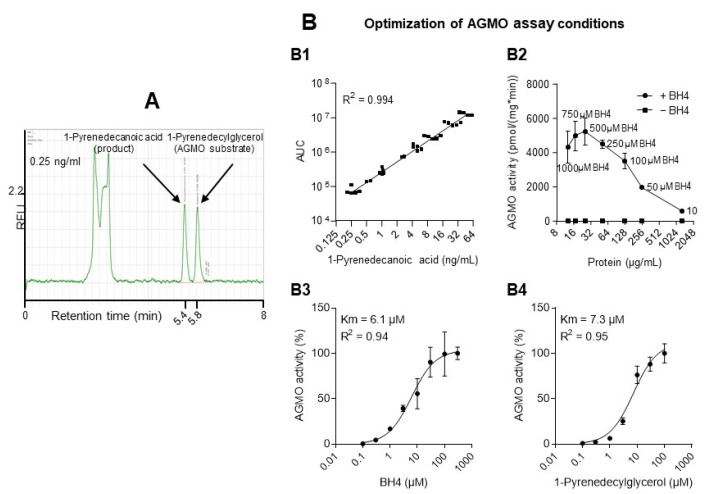
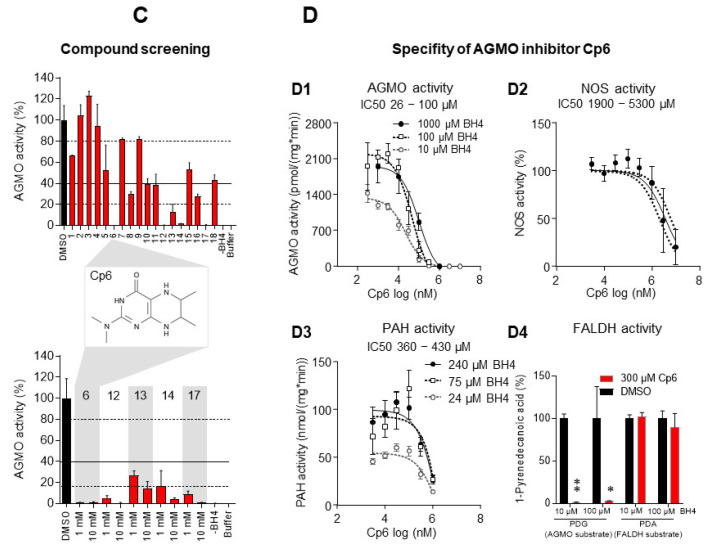
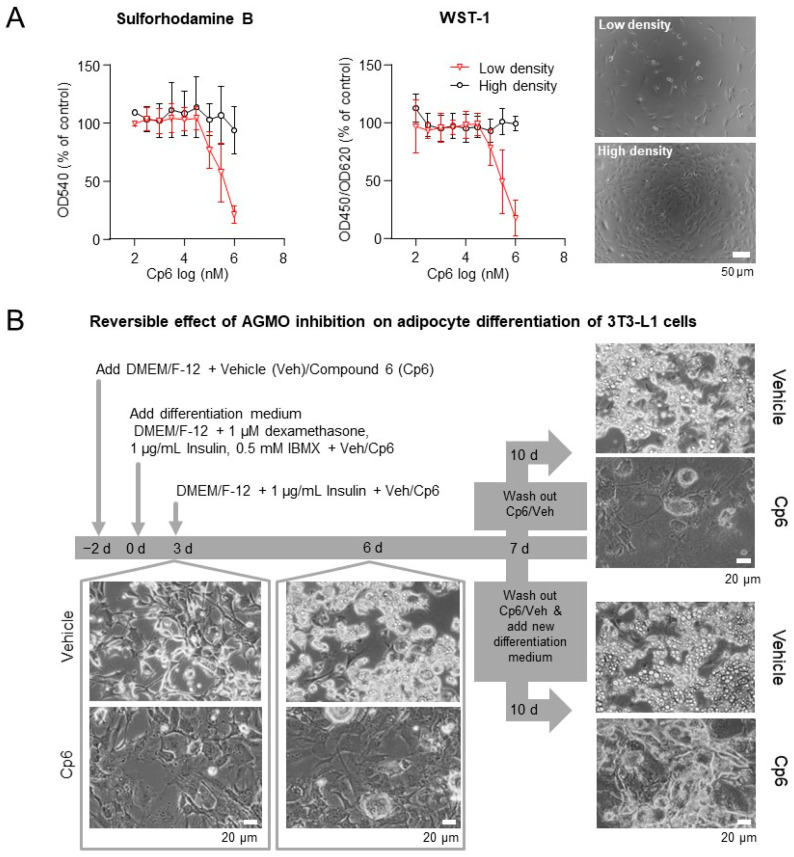
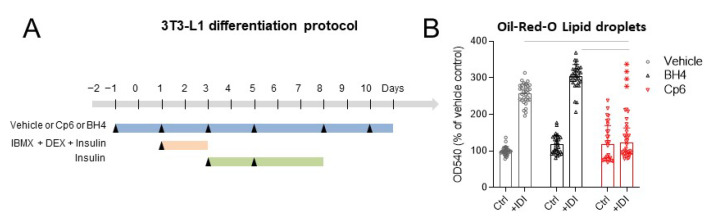
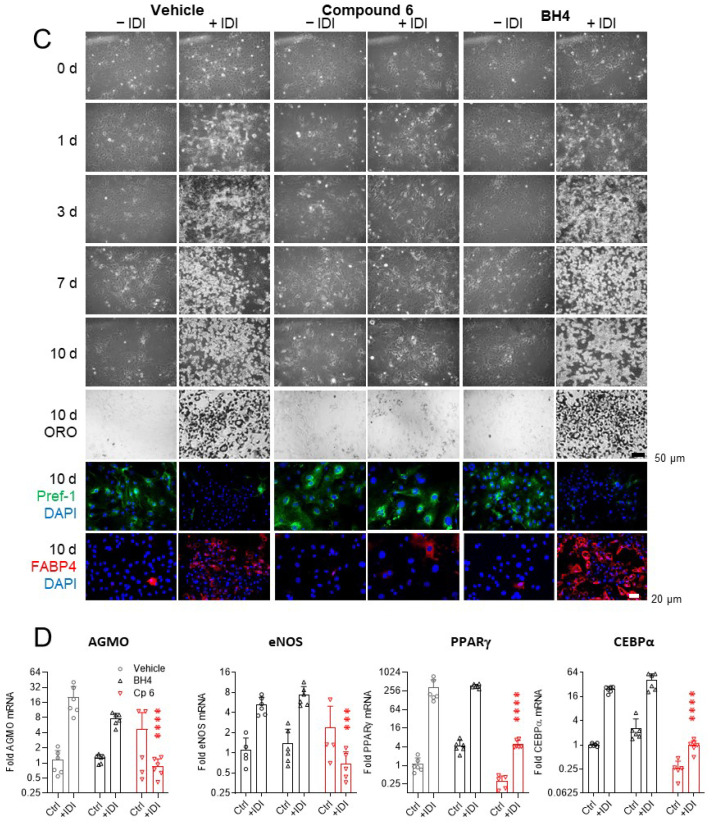
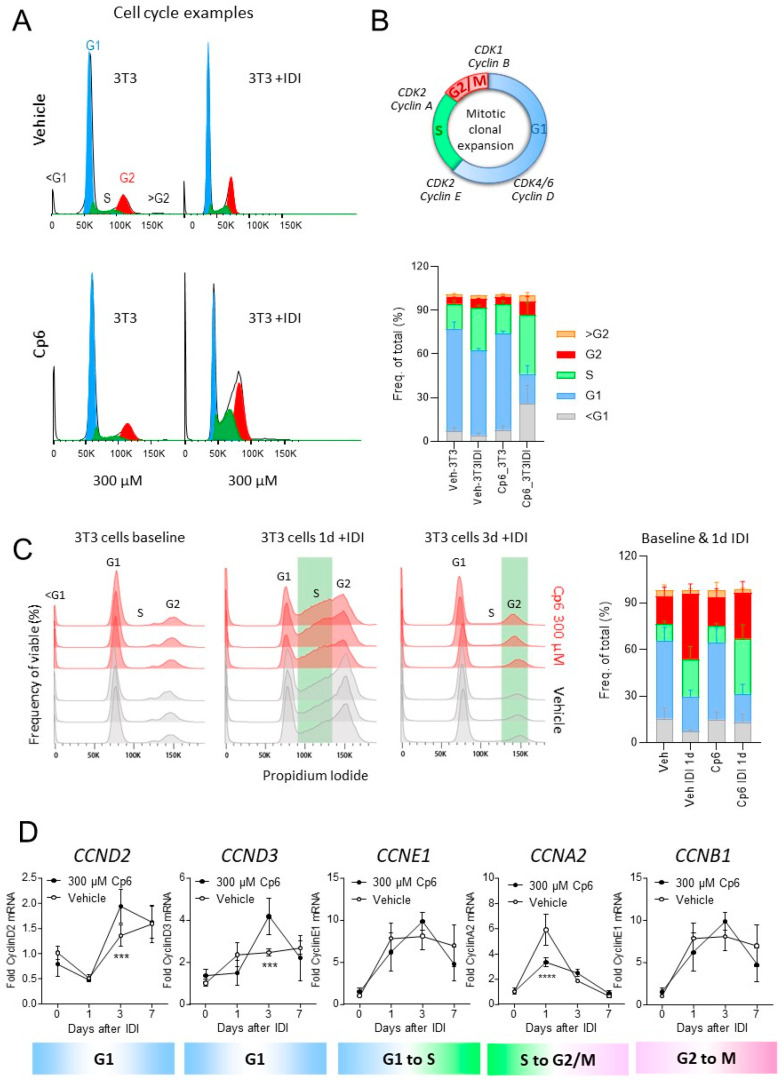
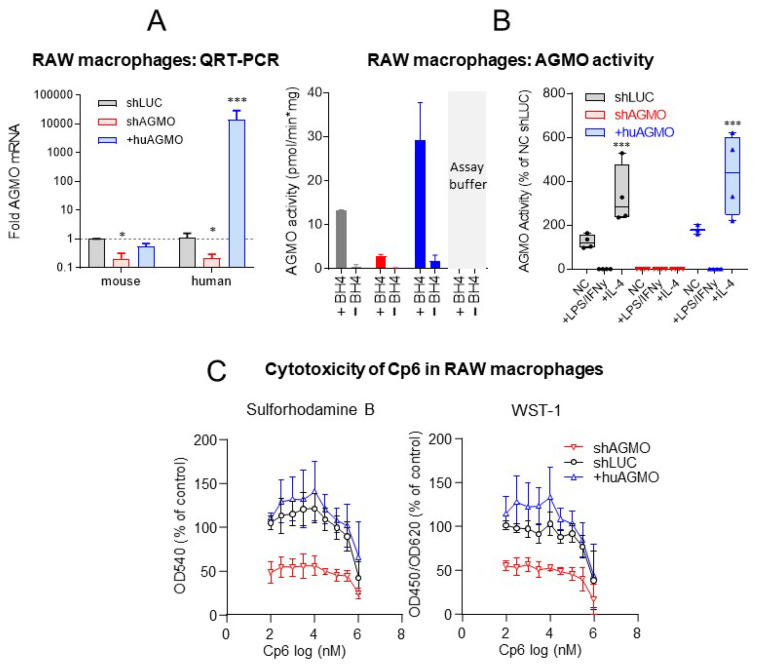
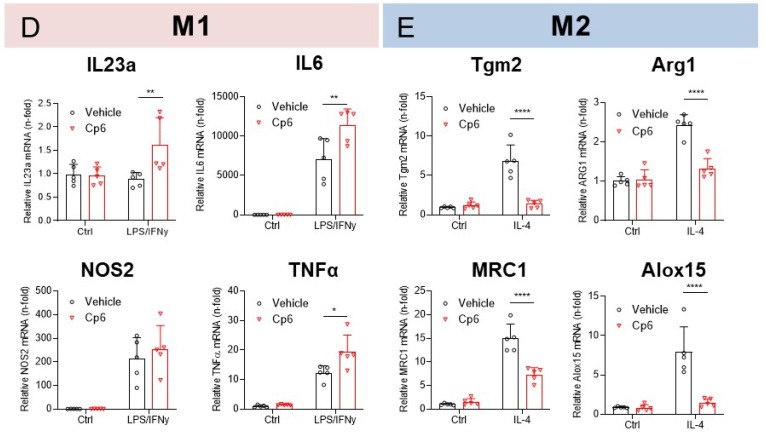
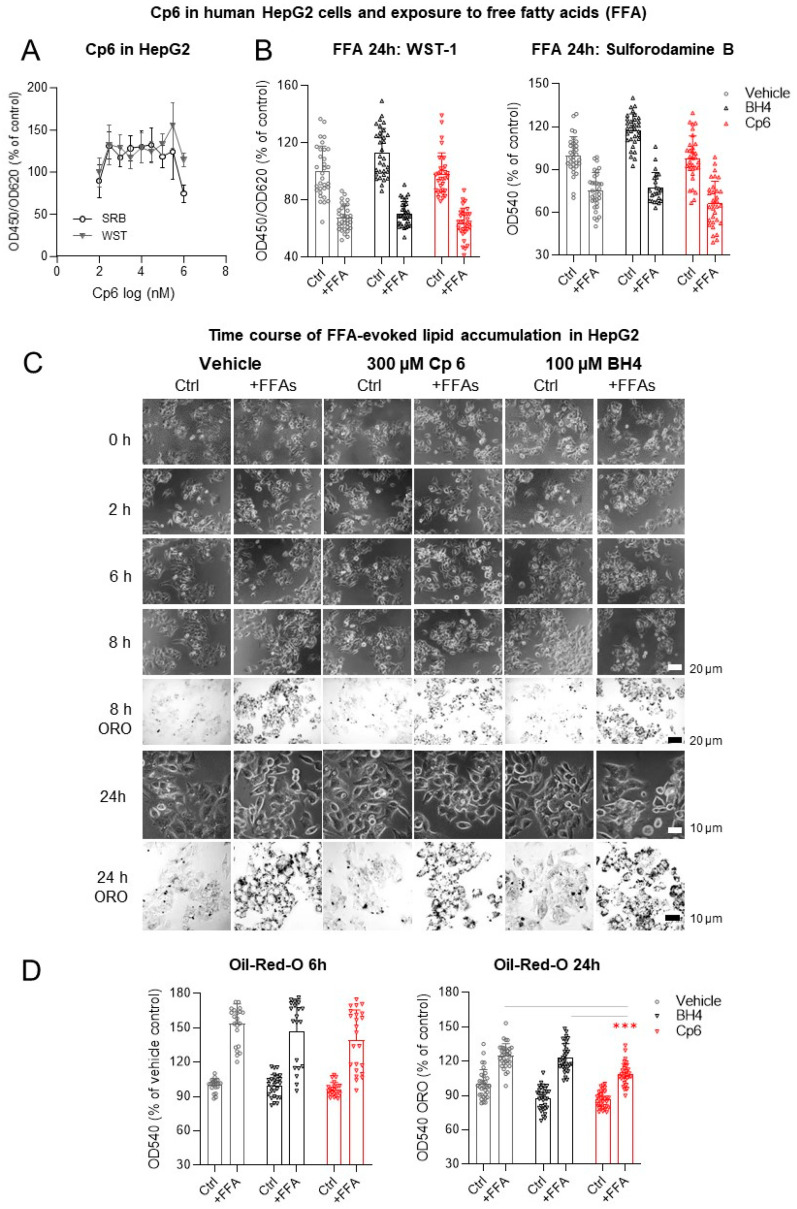
Alkylglycerol monooxygenase (AGMO) is a tetrahydrobiopterin (BH4)-dependent enzyme with major expression in the liver and white adipose tissue that cleaves alkyl ether glycerolipids. The present study describes the disclosure and biological characterization of a candidate compound (Cp6), which inhibits AGMO with an IC50 of 30-100 µM and 5-20-fold preference of AGMO relative to other BH4-dependent enzymes, i.e., phenylalanine-hydroxylase and nitric oxide synthase. The viability and metabolic activity of mouse 3T3-L1 fibroblasts, HepG2 human hepatocytes and mouse RAW264.7 macrophages were not affected up to 10-fold of the IC50. However, Cp6 reversibly inhibited the differentiation of 3T3-L1 cells towards adipocytes, in which AGMO expression was upregulated upon differentiation. Cp6 reduced the accumulation of lipid droplets in adipocytes upon differentiation and in HepG2 cells exposed to free fatty acids. Cp6 also inhibited IL-4-driven differentiation of RAW264.7 macrophages towards M2-like macrophages, which serve as adipocyte progenitors in adipose tissue. Collectively, the data suggest that pharmacologic AGMO inhibition may affect lipid storage.

Keywords: 3T3-L1 mouse fibroblasts; AGMO; adipocytes; compound screen; enzyme activity assay; macrophage polarization; tetrahydrobiopterin.


Conflict of interest statement

The authors declare no conflict of interest. The funders had no role in the design of the study; in the collection, analyses or interpretation of data; in the writing of the manuscript, or in the decision to publish the results.

Figures

Figure 1
Figure 1
Enzyme activity of alkylglycerol monooxygenase (AGMO) and compound screening. (A) Exemplary HPLC chromatograms show the fluorescent 1-pyrenedyclglycerol AGMO substrate and the product 1-pyrenedecanoic acid which is detected at 5.4 min via its fluorescence (340 nm excitation and 367 nm emission). Chromatograms show efficient separation of substrate and product at 0.25 ng/mL substrate concentrations. (B) Optimization of AGMO activity assay conditions. (B1) Association of substrate concentrations with product peak areas (areas under the curve, AUCs). (B2) AGMO enzyme activity in the presence and absence of the coenzyme, tetrahydrobiopterin (BH4 in µM) in dependence of microsome protein concentration. (B3) Michaelis–Menten kinetics with Km values depending on concentrations of its cofactor BH4. (B4) Michaelis–Menten kinetics with Km values depending on substrate concentrations of 1-pyrendyclglycerol follows. Data points represent the means with SD of 3 experiments. (C) Compound screen of 18 candidate AGMO-inhibitory compounds. AGMO activity was assessed at 25 µg/mL microsomal protein, 100 µM BH4 and 30 µM 1-pyrenedecylglycerol. Candidate compounds were selected according to their structural similarity to BH4. The screening revealed 5 putative candidates that led to a decrease >80% of AGMO activity (6, 12, 13, 14, 17). Cp6 showed the strongest effect. The data represent the means ± SD of the of relative AGMO activity of n = 3 experiments. (D) Assessment of Cp6 inhibitory effects on AGMO and of putative unspecific inhibitory effects on phenylalanine hydroxylase (PAH), nitric oxide synthase (NOS) and free fatty aldehyde dehydrogenase (FALDH). (D1) Cp6 inhibited AGMO in a BH4-independent manner with an IC50 of 26–100 µM (n = 3). (D2) Cp6 inhibited NOS activity from LPS, and IFNγ stimulated RAW macrophages at IC50 of 1900–5300 µM, i.e., 10–20-fold higher than the IC50 for AGMO (n = 3). (D3) Cp6 inhibited PAH activity in a BH4-independent manner at high IC50 values of 360–430 µM (n = 3). (D4) Cp6 significantly inhibited AGMO activity (* p = 0.0317, ** p = 0.0067), but Cp6 had no effect on FALDH, the second essential enzyme of the AGMO activity assay. Bars show means with SD.
Figure 1
Figure 1
Enzyme activity of alkylglycerol monooxygenase (AGMO) and compound screening. (A) Exemplary HPLC chromatograms show the fluorescent 1-pyrenedyclglycerol AGMO substrate and the product 1-pyrenedecanoic acid which is detected at 5.4 min via its fluorescence (340 nm excitation and 367 nm emission). Chromatograms show efficient separation of substrate and product at 0.25 ng/mL substrate concentrations. (B) Optimization of AGMO activity assay conditions. (B1) Association of substrate concentrations with product peak areas (areas under the curve, AUCs). (B2) AGMO enzyme activity in the presence and absence of the coenzyme, tetrahydrobiopterin (BH4 in µM) in dependence of microsome protein concentration. (B3) Michaelis–Menten kinetics with Km values depending on concentrations of its cofactor BH4. (B4) Michaelis–Menten kinetics with Km values depending on substrate concentrations of 1-pyrendyclglycerol follows. Data points represent the means with SD of 3 experiments. (C) Compound screen of 18 candidate AGMO-inhibitory compounds. AGMO activity was assessed at 25 µg/mL microsomal protein, 100 µM BH4 and 30 µM 1-pyrenedecylglycerol. Candidate compounds were selected according to their structural similarity to BH4. The screening revealed 5 putative candidates that led to a decrease >80% of AGMO activity (6, 12, 13, 14, 17). Cp6 showed the strongest effect. The data represent the means ± SD of the of relative AGMO activity of n = 3 experiments. (D) Assessment of Cp6 inhibitory effects on AGMO and of putative unspecific inhibitory effects on phenylalanine hydroxylase (PAH), nitric oxide synthase (NOS) and free fatty aldehyde dehydrogenase (FALDH). (D1) Cp6 inhibited AGMO in a BH4-independent manner with an IC50 of 26–100 µM (n = 3). (D2) Cp6 inhibited NOS activity from LPS, and IFNγ stimulated RAW macrophages at IC50 of 1900–5300 µM, i.e., 10–20-fold higher than the IC50 for AGMO (n = 3). (D3) Cp6 inhibited PAH activity in a BH4-independent manner at high IC50 values of 360–430 µM (n = 3). (D4) Cp6 significantly inhibited AGMO activity (* p = 0.0317, ** p = 0.0067), but Cp6 had no effect on FALDH, the second essential enzyme of the AGMO activity assay. Bars show means with SD.
Figure 2
Figure 2
Cp6 reversibly inhibits differentiation of 3T3-L1 preadipocytes. (A) Effect of Cp6 on cell viability and proliferation as assessed by sulforhodamine B (SRB) and WST-1 assays in low-density and high-density cultures of undifferentiated 3T3-L1 mouse fibroblast-like cells (exemplary culture images right). Data are means ± SD (n = 2–5 independent experiments). Cp6 reduced viability and proliferation in low-density cultures (IC50 300–400 µM, best-fit value of pooled data) but had no impact on cell viability at high culture density. Scale bar 50 µm. (B) Flowchart of the differentiation of 3T3-L1 fibroblast-like cells towards adipocyte-like cells in the presence of Cp6 (1 mM) or vehicle (0.1% DMSO) up to 6d of continuous treatment, and subsequent “wash-out” from day 7–10. Exemplary culture images show 3T3-L1 preadipocytes at different stages of the differentiation process. Cp6 reversibly inhibited the proliferation and irreversibly prevented the formation of lipid droplets. Scale bars 20 µm.
Figure 3
Figure 3
Cp6 preserves preadipocyte markers and prevents accumulation of lipid droplets. (A) Flowchart showing the differentiation procedure with/without treatment of 3T3-L1 preadipocytes. Cells were treated with vehicle (0.1% DMSO), 1 mM Cp6 or 100 µM BH4 before and continuously after addition of differentiation medium (+IDI). The differentiation medium (IDI+) consisted in dexamethasone, 3-isobutyl-1-methylxanthine (IBMX) and insulin, referred to as IDI+. Controls were treated in parallel without differentiation medium (-IDI). (B) Quantification of lipid droplets in vehicle, Cp6 (1 mM) or BH4 (100 µM)-treated 3T3-L1 preadipocytes after 10 days of differentiation. Lipid droplets were stained with Oil-Red O and absorbance read at 540 nm and normalized to non-differentiated vehicle-treated controls. Data were compared with 2-way ANOVA and subsequent post hoc analysis for “treatment”. The scatter show replicates of n = 5 independent experiments, bars and whiskers show means ± SD, **** p ≤ 0.0001. (C) Morphology and expression of pre/adipocyte markers in 3T3-L1 pre/adipocytes after 10d of culture with/without differentiation medium (+IDI, –IDI) in the presence of vehicle (0.1% DMSO), 1 mM Cp6 or 100 µM BH4. Differentiating cells (IDI+ cultures) receiving vehicle or BH4 started to develop lipid droplets from 3 days on. Lipid droplets did not develop in Cp6-treated cells. Final staining with Oil-Red O (ORO) solution (at 10d) confirmed the complete absence of lipid droplets in Cp6-treated cultures. Vehicle and BH4-treated 3T3-L1 cells expressed fatty acid binding protein (FABP4), which is a marker for mature adipocytes, whereas Cp6-treated cells preserved the preadipocyte marker expression of preadipocyte factor 1 (Pref-1, gene Dlk, protein delta homolog 1). (D) QRT-PCR analysis of AGMO, eNOS, PPARγ and CEBPα mRNA expression in 3T3-L1 pre/adipocytes. Eukaryotic elongation factor 2 (Eef2) was used as a housekeeping gene, and mRNA was normalized to non-differentiated vehicle control cultures set to 1. Data were compared with 2-way ANOVA and subsequent post hoc Dunnett versus vehicle control; n = 5–6 independent cultures, bars and whiskers show means ± SD. The asterisks show significant results versus “vehicle +IDI”; **** p <0.0001, *** p < 0.001.
Figure 3
Figure 3
Cp6 preserves preadipocyte markers and prevents accumulation of lipid droplets. (A) Flowchart showing the differentiation procedure with/without treatment of 3T3-L1 preadipocytes. Cells were treated with vehicle (0.1% DMSO), 1 mM Cp6 or 100 µM BH4 before and continuously after addition of differentiation medium (+IDI). The differentiation medium (IDI+) consisted in dexamethasone, 3-isobutyl-1-methylxanthine (IBMX) and insulin, referred to as IDI+. Controls were treated in parallel without differentiation medium (-IDI). (B) Quantification of lipid droplets in vehicle, Cp6 (1 mM) or BH4 (100 µM)-treated 3T3-L1 preadipocytes after 10 days of differentiation. Lipid droplets were stained with Oil-Red O and absorbance read at 540 nm and normalized to non-differentiated vehicle-treated controls. Data were compared with 2-way ANOVA and subsequent post hoc analysis for “treatment”. The scatter show replicates of n = 5 independent experiments, bars and whiskers show means ± SD, **** p ≤ 0.0001. (C) Morphology and expression of pre/adipocyte markers in 3T3-L1 pre/adipocytes after 10d of culture with/without differentiation medium (+IDI, –IDI) in the presence of vehicle (0.1% DMSO), 1 mM Cp6 or 100 µM BH4. Differentiating cells (IDI+ cultures) receiving vehicle or BH4 started to develop lipid droplets from 3 days on. Lipid droplets did not develop in Cp6-treated cells. Final staining with Oil-Red O (ORO) solution (at 10d) confirmed the complete absence of lipid droplets in Cp6-treated cultures. Vehicle and BH4-treated 3T3-L1 cells expressed fatty acid binding protein (FABP4), which is a marker for mature adipocytes, whereas Cp6-treated cells preserved the preadipocyte marker expression of preadipocyte factor 1 (Pref-1, gene Dlk, protein delta homolog 1). (D) QRT-PCR analysis of AGMO, eNOS, PPARγ and CEBPα mRNA expression in 3T3-L1 pre/adipocytes. Eukaryotic elongation factor 2 (Eef2) was used as a housekeeping gene, and mRNA was normalized to non-differentiated vehicle control cultures set to 1. Data were compared with 2-way ANOVA and subsequent post hoc Dunnett versus vehicle control; n = 5–6 independent cultures, bars and whiskers show means ± SD. The asterisks show significant results versus “vehicle +IDI”; **** p <0.0001, *** p < 0.001.
Figure 4
Figure 4
Cp6 slows down cell cycle progression of 3T3 adipocytes during IDI-mediated clonal expansion. (A) Exemplary histograms of the cell cycle distribution as assessed per flow cytometry analysis of the DNA content via propidium iodide staining. The 3T3 cells were treated with vehicle (upper), or 300 µM Cp6 (bottom) with/without IDI differentiation medium for 24 h. One × exp5 cells were counted per culture, n = 5 per condition, and propidium iodide intensities were fitted according to the Watson Pragmatic model implemented in FlowJo. (B) Drawing of the cell cycle and major cyclins involved in transitions and quantitative result of the cell cycle distribution as shown in A. Cells in the subG1 phase (<2N) are considered apoptotic/dying cells. Cells with >4N DNA are considered polyploid. Data were compared via 2-way ANOVA for “IDI” and “treatment” and subsequent t-tests with Šidák adjustment of alpha. (C) Time course of the cell cycle distribution in 3T3 cells at baseline, 1d and 3d after adding IDI. Cells were treated with vehicle or 0.3 mM Cp6 (n = 6–9 per group and time point). At 1d, there are more Cp6-treated cells in S, at 3d, there are more in G2. Two-way ANOVA for the interaction “CC-phase X group” reveals a significant difference between groups, p < 0.0001 at 1d, p = 0.0103 at 3d. (D) Analysis of cyclin expression on mRNA level during adipogenesis in 3T3-L1 cells. Data were compared with 2-way ANOVA for “time” x “treatment” and subsequent post hoc analysis for “treatment” using a correction of alpha according to Sidak versus vehicle control; n = 6 independent cultures, bars and whiskers show means ± SD, *** p < 0.001.
Figure 5
Figure 5
Cp6 inhibits macrophage M1 to M2 polarization. (A) Relative mRNA of endogenous murine and transgenic human AGMO in shAGMO and in +huAGMO RAW 264.7 macrophages relative to control cells (shLUC). Bars show means ± SD. Data were compared with one-way ANOVA separately for murine and human AGMO expression and subsequent post hoc analysis using a correction of alpha according to Dunnett versus control cells; n = 3–6, *** p < 0.001, **** p < 0.0001). (B) AGMO activity in homogenates of in shAGMO and in +huAGMO RAW264.7 macrophages and shLUC RAW control cells. (NC, naïve control). Bars and whiskers show means ± SD (n = 2–3). In the right panel, cells were stimulated with LPS+IFNγ (20 ng/mL each) or with IL-4 (40 ng/mL) (n = 3–4 per group and stimulus). The box represents the interquartile range, the line is the median, and the whiskers show minimum and maximum. The scatters show results of individual samples. Data were compared with 2-way ANOVA for “cell line” by “stimulation” using a correction of alpha according to Dunnett (n = 3–4; * indicates differences between cell lines. (C) Effect of Cp6 on cell viability (sulforhodamine B assay, SRB) and cell proliferation (WST-assay) in shLUC, shAGMO and +huAGMO RAW264.7 macrophages. Data points show means with SD (n = 6–9 per cell line of 3 independent experiments) as percentage of treated control RAW264.7 cells. (D) Relative mRNA expression of M1 polarization markers (IL23a, IL6, NOS2/iNOS, TNFalpha) in vehicle or Cp6 (100 µM)-treated control and LPS+IFNγ (20 ng/mL each) stimulated +huAGMO RAW264.7 macrophages. Data were compared with 2-way ANOVA for “stimulation” x “treatment” and subsequent post hoc analysis using a correction of alpha according to Tukey. Asterisks indicate significant differences between vehicle and Cp6 (n = 5, * p < 0.05, ** p < 0.01). Bars and whiskers show means ± SD. (E) Relative mRNA expression of M2 polarization markers (Tgm2, Arg1, MRC1/CD206, Alox15) in vehicle or Cp6-treated control and IL-4 (40 ng/mL) stimulated +huAGMO RAW264.7 macrophages. Data were compared with 2-way ANOVA for “stimulation” x “treatment” and subsequent post hoc analysis using a correction of alpha according to Tukey. Statistics as in D. **** p < 0.0001.
Figure 5
Figure 5
Cp6 inhibits macrophage M1 to M2 polarization. (A) Relative mRNA of endogenous murine and transgenic human AGMO in shAGMO and in +huAGMO RAW 264.7 macrophages relative to control cells (shLUC). Bars show means ± SD. Data were compared with one-way ANOVA separately for murine and human AGMO expression and subsequent post hoc analysis using a correction of alpha according to Dunnett versus control cells; n = 3–6, *** p < 0.001, **** p < 0.0001). (B) AGMO activity in homogenates of in shAGMO and in +huAGMO RAW264.7 macrophages and shLUC RAW control cells. (NC, naïve control). Bars and whiskers show means ± SD (n = 2–3). In the right panel, cells were stimulated with LPS+IFNγ (20 ng/mL each) or with IL-4 (40 ng/mL) (n = 3–4 per group and stimulus). The box represents the interquartile range, the line is the median, and the whiskers show minimum and maximum. The scatters show results of individual samples. Data were compared with 2-way ANOVA for “cell line” by “stimulation” using a correction of alpha according to Dunnett (n = 3–4; * indicates differences between cell lines. (C) Effect of Cp6 on cell viability (sulforhodamine B assay, SRB) and cell proliferation (WST-assay) in shLUC, shAGMO and +huAGMO RAW264.7 macrophages. Data points show means with SD (n = 6–9 per cell line of 3 independent experiments) as percentage of treated control RAW264.7 cells. (D) Relative mRNA expression of M1 polarization markers (IL23a, IL6, NOS2/iNOS, TNFalpha) in vehicle or Cp6 (100 µM)-treated control and LPS+IFNγ (20 ng/mL each) stimulated +huAGMO RAW264.7 macrophages. Data were compared with 2-way ANOVA for “stimulation” x “treatment” and subsequent post hoc analysis using a correction of alpha according to Tukey. Asterisks indicate significant differences between vehicle and Cp6 (n = 5, * p < 0.05, ** p < 0.01). Bars and whiskers show means ± SD. (E) Relative mRNA expression of M2 polarization markers (Tgm2, Arg1, MRC1/CD206, Alox15) in vehicle or Cp6-treated control and IL-4 (40 ng/mL) stimulated +huAGMO RAW264.7 macrophages. Data were compared with 2-way ANOVA for “stimulation” x “treatment” and subsequent post hoc analysis using a correction of alpha according to Tukey. Statistics as in D. **** p < 0.0001.
Figure 6
Figure 6
Cp6 does not protect human HepG2 hepatocytes against free fatty acids (FFA) induced toxicity. (A) Concentration-dependent effect of Cp6 on cell viability and proliferation as assessed by sulforhodamine B (SRB) and WST-1 assays in human HepG2 hepatocytes. Data are means ± SD of n = 3 cultures. (B) Effects of Cp6 (300 µM) and BH4 (100 µM) in human HepG2 hepatocytes challenged with FFAs for 24 h. Neither Cp6 nor BH4 were able to prevent FFA-evoked toxicity. Data are the means ± SD 2 × 2 independent experiments per time point. Scatters show pooled replicates. (C) Time course of free fatty acid evoked lipid droplet accumulation in human HepG2 cells treated with Cp6 (300 µM), BH4 (100 µM) or vehicle (0.1% DMSO). (D) Lipid droplets were quantified per Oil-Red O (ORO) staining and were normalized versus control (vehicle non-FFA) set to 100%. Data show the mean ± SD. The scatter show pooled replicates of 2 × 2 cultures per time point and condition. Data were compared by 2-way ANOVA and subsequent post hoc Šidák; *** p < 0.001. Cp6 significantly reduced lipid droplets at 24 h FFA versus vehicle or BH4 groups.

Similar articles

Cited by

References

    1. Dean J.M., Lodhi I.J. Structural and functional roles of ether lipids. Protein Cell. 2018;9:196–206. doi: 10.1007/s13238-017-0423-5. - DOI - PMC - PubMed
    1. Van Meer G., Voelker D.R., Feigenson G.W. Membrane lipids: Where they are and how they behave. Nat. Rev. Mol. Cell Biol. 2008;9:112–124. doi: 10.1038/nrm2330. - DOI - PMC - PubMed
    1. Lohner K. Is the high propensity of ethanolamine plasmalogens to form non-lamellar lipid structures manifested in the properties of biomembranes? Chem. Phys. Lipids. 1996;81:167–184. doi: 10.1016/0009-3084(96)02580-7. - DOI - PubMed
    1. Paltauf F. Ether lipids in biomembranes. Chem. Phys. Lipids. 1994;74:101–139. doi: 10.1016/0009-3084(94)90054-X. - DOI - PubMed
    1. Pike L.J., Han X., Chung K.N., Gross R.W. Lipid rafts are enriched in arachidonic acid and plasmenylethanolamine and their composition is independent of caveolin-1 expression: A quantitative electrospray ionization/mass spectrometric analysis. Biochemistry. 2002;41:2075–2088. doi: 10.1021/bi0156557. - DOI - PubMed

Publication types

Substances

LinkOut - more resources