. 2021 May 1;12(5):409.
doi: 10.3390/insects12050409.

Effects of Multi-Component Backgrounds of Volatile Plant Compounds on Moth Pheromone Perception

Affiliations

Effects of Multi-Component Backgrounds of Volatile Plant Compounds on Moth Pheromone Perception

Lucie Conchou et al. Insects. .

Abstract

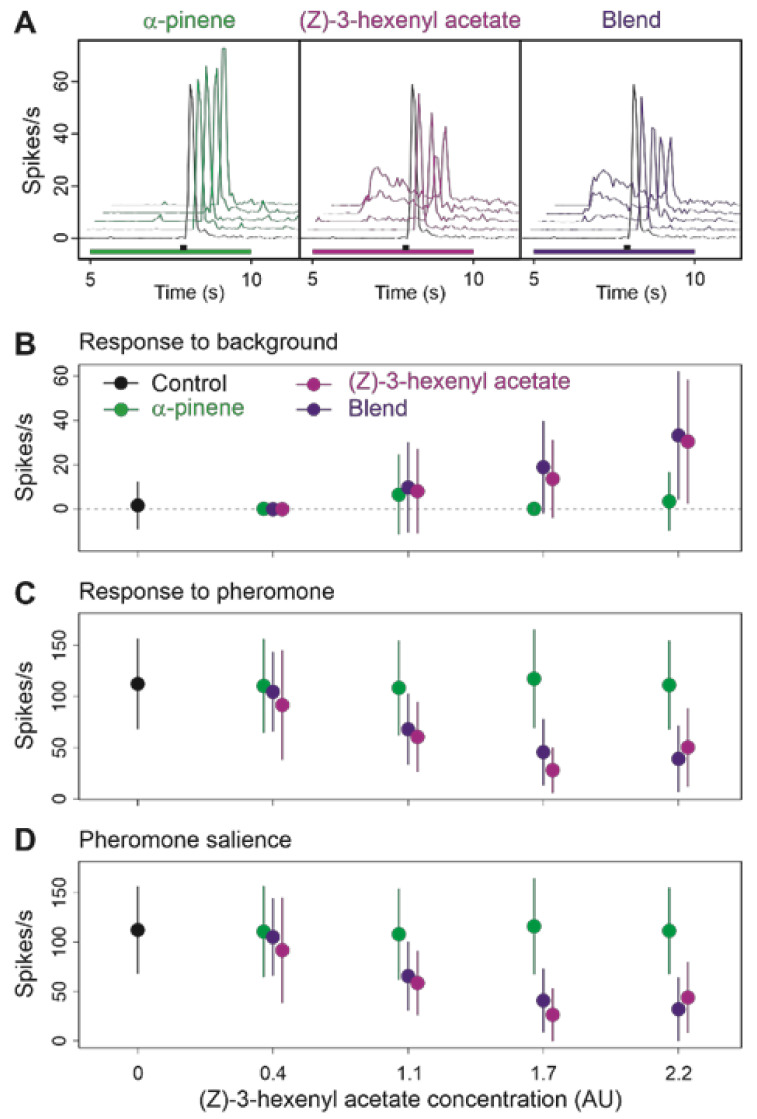
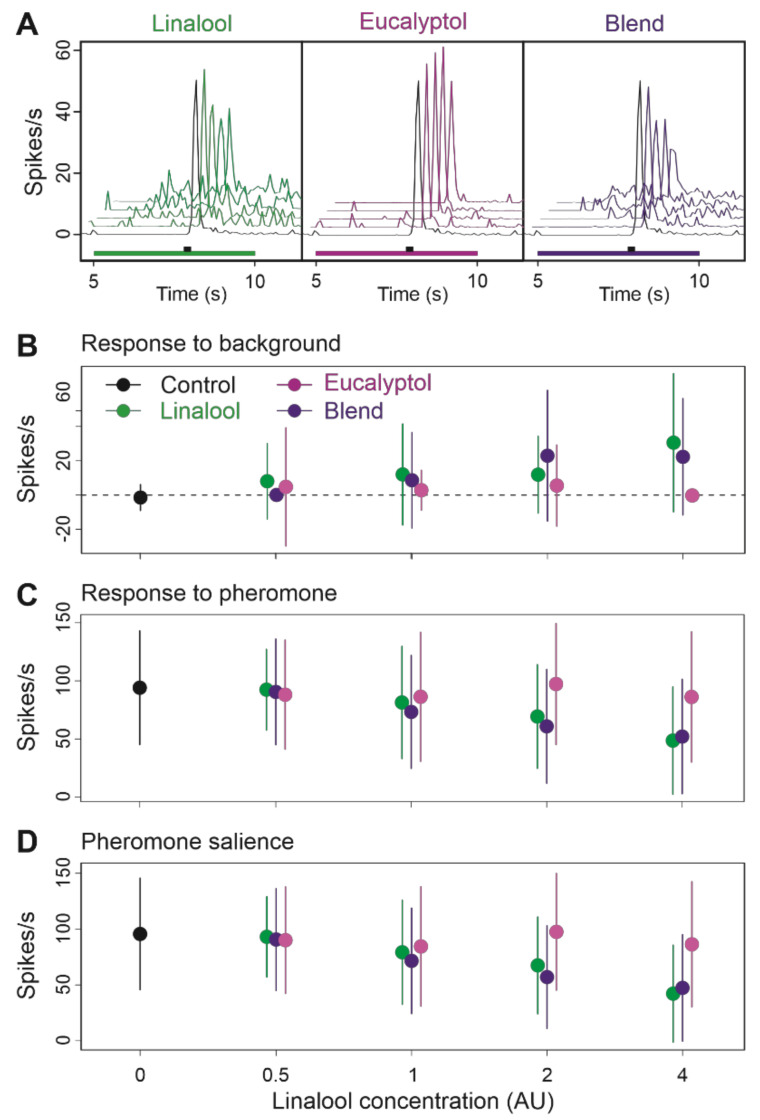
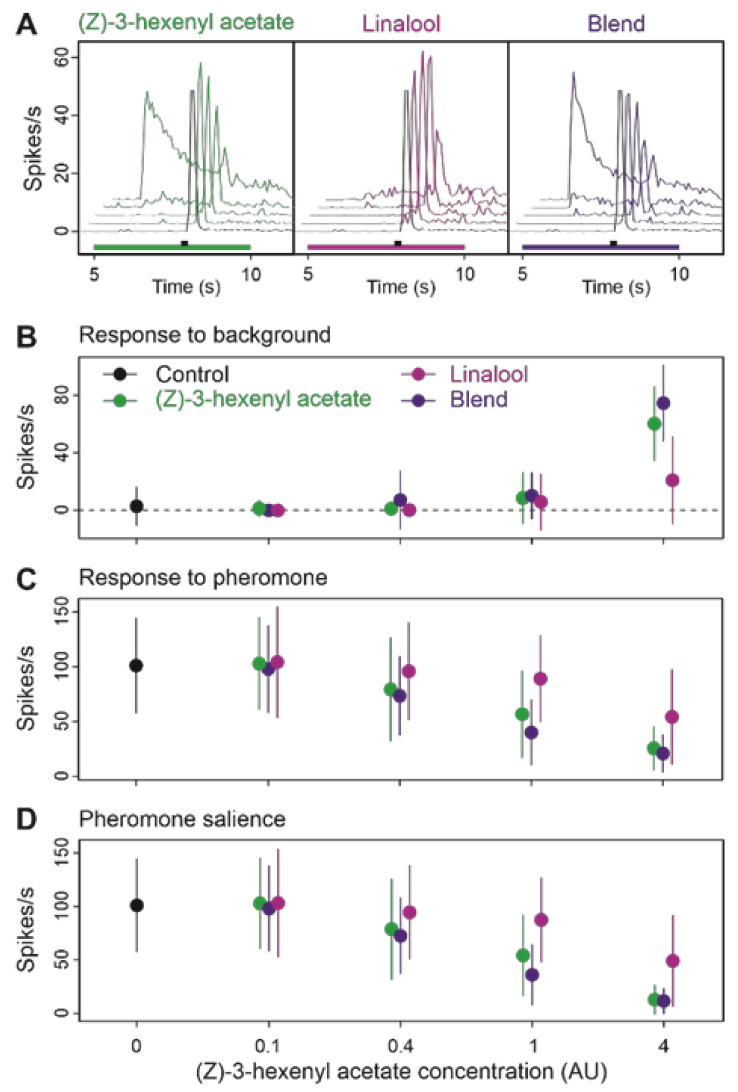
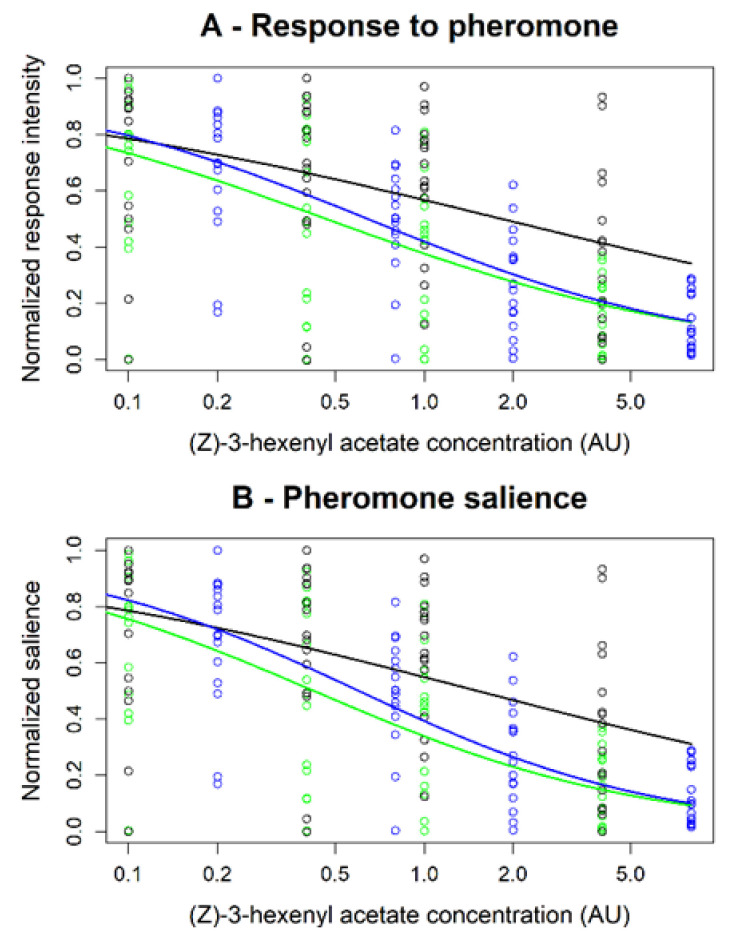
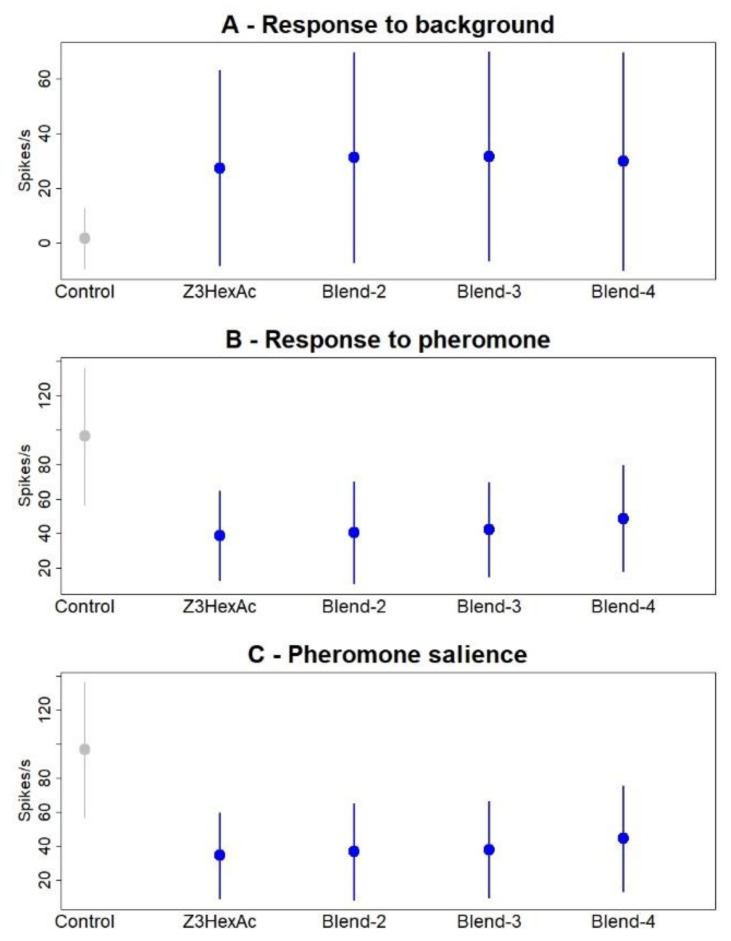
The volatile plant compounds (VPC) alter pheromone perception by insects but mixture effects inside insect olfactory landscapes are poorly understood. We measured the activity of receptor neurons tuned to Z7-12Ac (Z7-ORN), a pheromone component, in the antenna and central neurons in male Agrotis ipsilon while exposed to simple or composite backgrounds of a panel of VPCs representative of the odorant variety encountered by a moth. Maps of activities were built using calcium imaging to visualize which areas in antennal lobes (AL) were affected by VPCs. We compared the VPC activity and their impact as backgrounds at antenna and AL levels, individually or in blends. At periphery, VPCs showed differences in their capacity to elicit Z7-ORN firing response that cannot be explained by differences in stimulus intensities because we adjusted concentrations according to vapor pressures. The AL neuronal network, which reformats the ORN input, did not improve pheromone salience. We postulate that the AL network evolved to increase sensitivity and to encode for fast changes of pheromone at some cost for signal extraction. Comparing blends to single compounds indicated that a blend shows the activity of its most active component. VPC salience seems to be more important than background complexity.

Keywords: moth; odor background; odorscape; olfactory coding; olfactory neuron; pheromone; plant volatile compounds.


Conflict of interest statement

The authors declare no conflict of interest. The funders had no role in the design of the study; in the collection, analyses, or interpretation of data; in the writing of the manuscript, or in the decision to publish the results.

Figures

Figure 1
Figure 1
Stimulation protocol for electrophysiological experiments on Z7-ORNs and MGC-neurons. Black and green boxes indicate, respectively, the delivery of the background (VPC in mineral oil or pure mineral oil) and the pheromone compound Z7-12:Ac on the moth antenna. TW1 to TW4: limits of the time windows used to measure spontaneous activity (TW1), firing response to background (TW2), firing activity immediately before pheromone stimulus (TW3) and response to Z7-12:Ac (TW4).
Figure 2
Figure 2
Effects of a VPC background on the calcium-response to pheromone in the MGC area of the antennal lobe. Average time course (n = 15) of δF/F in response to VPCs (green curves) and to the pheromone in a background of the same VPCs (black curves) and to pheromone in control background (grey curves). The last panel presents the responses to the pheromone in the control background (mineral oil only) and to the control background. Green and black bars at the bottom of each graph mark the background and pheromone stimuli, respectively.
Figure 3
Figure 3
Effects of a VPC background on the firing activity of MGC-neurons and their responses to the pheromone. (A): raster plots of typical individual extracellular recordings. (B): Mean frequency plots showing the fast firing peak at background onset, followed by a sustained firing activity, and their effects on the amplitude of the firing peak at pheromone presentation. In (A,B), green and black bars indicate background and pheromone stimuli, respectively. (C): Strip charts comparing individual firing activities in each VPC background (green dots) with the control background (black dots). Firing frequency was measured on appropriate time windows to evaluate: response to background (left column), response to pheromone (middle column), and pheromone salience (right column). * and *** indicate p-values of the paired t test below FDR threshold; NS = p-value above FDR threshold. n = 5 for linalool and 10 for other compounds.
Figure 4
Figure 4
A background of (Z)-3-hexenyl acetate, linalool, eucalyptol or (E)-2-hexenal modifies the firing activity of Z7-ORNs and their responses to pheromone. (A): raster plots of samples of single sensillum recordings. (B): Mean frequency plots showing the time-course of the firing in response to background presentation and pheromone pulse. In (A,B), green and black bars indicate background and pheromone stimuli, respectively. (C): Strip charts comparing individual neuron firing activities in each VPC background (green dots) with the control background (black dots). Firing frequency was measured on appropriate time-windows to evaluate the response to background (left column), response to pheromone (middle column), and pheromone salience (right column). n = 26. Stars indicate p-values of the paired t test below FDR threshold; NS = p-value above FDR threshold. n = 5 for linalool and 10 for other compounds.
Figure 5
Figure 5
Effects on Ph-ORNs of a blend of α-pinene and (Z)-3-hexenyl acetate at 2:1 ratio as background to pheromone. (A): Mean frequency plots (n = 15) showing the time-course of the firing during background presentation and after pheromone pulse at increasing concentrations of background; below the plots green (α-pinene), light violet ((Z)-3-hexenyl acetate) or dark violet (blend) bars indicate background stimulus and black bars indicate pheromone stimulus. (BD): Effects of background dose and composition on response to background (B), response to pheromone (C) and pheromone salience (D). Means and standard deviations, n = 15.
Figure 6
Figure 6
Effects on Z7-ORNs of blending linalool with eucalyptol at a 1:2 ratio as background to a pheromone stimulus. (A): Mean frequency plots (n = 17) showing the time-course of the firing during background presentation and after pheromone pulse; below each plot a green (linalool), light violet (eucalyptol) or dark violet (blend) rectangle indicates background presentation and a black rectangle the pheromone stimulus. (BD): Effects of background dose and composition on response to background (B), response to pheromone (C), and pheromone salience (D). Means and standard deviations, n = 17.
Figure 7
Figure 7
Effects on Z7-ORNs of blending two agonists VPCs, (Z)-3-hexenyl acetate and linalool, at a 1:1 ratio as background. (A): Mean frequency plots showing the time-course of firing during background presentation and after pheromone pulse. Below the plots, green ((Z)-3-hexenyl acetate), light violet (linalool) or dark violet (blend) rectangles indicate background presentation; a black rectangle indicates the pheromone stimulus. (BD): Effects of background dose and composition on response to background (B), response to pheromone (C), and pheromone salience (D). Means and standard deviations, n = 16.
Figure 8
Figure 8
Modeling the dose dependence of the effects of blend (Z)-3-hexenyl acetate and linalool on (A) response to pheromone and (B) pheromone salience. Circles = experimental values after normalization in linalool (black dots), (Z)-3 hexenyl acetate (green dots), and the 1:1 blend (blue dots). Lines = predicted values obtained from fits of the modified Hill’s equation Rnorm or Snorm=EC50nCn+EC50n by a non-linear regression (see estimated parameter values in Table S2).
Figure 9
Figure 9
Effects of backgrounds with blends of 3- and 4-components on the Z7-ORN firing activity. Control = mineral oil. Z3HexAc = (Z)-3-hexenyl acetate. Blend-2 = (Z)-3-hexenyl acetate 1 AU plus linalool at ratios of 1:1. Blend 3 = (Z)-3-hexenyl acetate 1 AU plus indole and β-caryophyllene at ratios of 1:1:0.3. Blend 4 (Z)-3-hexenyl acetate 1 AU, linalool, α-pinene and eucalyptol at ratios of 1:1:2:2. (A) Response to the background, (B) Response to the pheromone, (C) Pheromone salience. Means of n = 34 measures on 17 Z7-ORNs. Error bars = standard deviations.

Similar articles

Cited by

References

    1. Conchou L., Anderson P., Birgersson G. Host plant species differentiation in a polyphagous moth: Olfaction is enough. J. Chem. Ecol. 2017 doi: 10.1007/s10886-017-0876-2. - DOI - PubMed
    1. Kantsa A., Raguso R.A., Lekkas T., Kalantzi O.I., Petanidou T. Floral volatiles and visitors: A meta-network of associations in a natural community. J. Ecol. 2019:1–13. doi: 10.1111/1365-2745.13197. - DOI
    1. Conchou L., Lucas P., Meslin C., Proffit M., Staudt M., Renou M. Insect odorscapes: From plant volatiles to natural olfactory scenes. Front. Physiol. 2019;10:972. doi: 10.3389/fphys.2019.00972. - DOI - PMC - PubMed
    1. Knudsen G.K., Eriksson R., Gershenzon J., Stahl B. Diversity and distribution of floral scent. Bot. Rev. 2006;72:1–120. doi: 10.1663/0006-8101(2006)72[1:DADOFS]2.0.CO;2. - DOI
    1. Knudsen J.T., Tollsten L., Bergstrom G.L. Floral scents—A checklist of volatile compounds isolated by head-space techniques. Phytochemistry. 1993;33:253–280. doi: 10.1016/0031-9422(93)85502-I. - DOI

LinkOut - more resources