. 2021 May 1;22(9):4819.
doi: 10.3390/ijms22094819.

GeromiRs Are Downregulated in the Tumor Microenvironment during Colon Cancer Colonization of the Liver in a Murine Metastasis Model

Affiliations

GeromiRs Are Downregulated in the Tumor Microenvironment during Colon Cancer Colonization of the Liver in a Murine Metastasis Model

Daniela Gerovska et al. Int J Mol Sci. .

Abstract

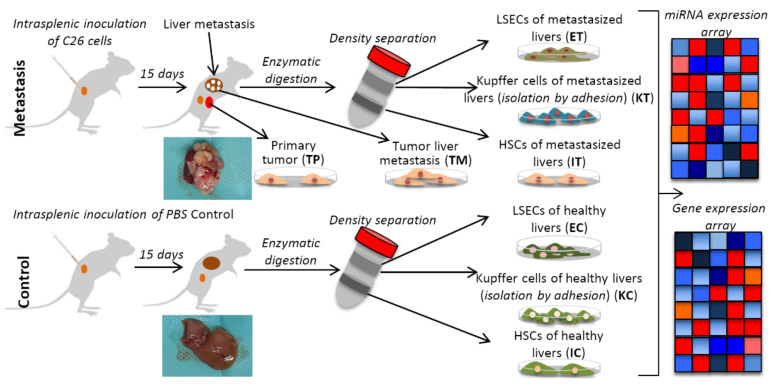
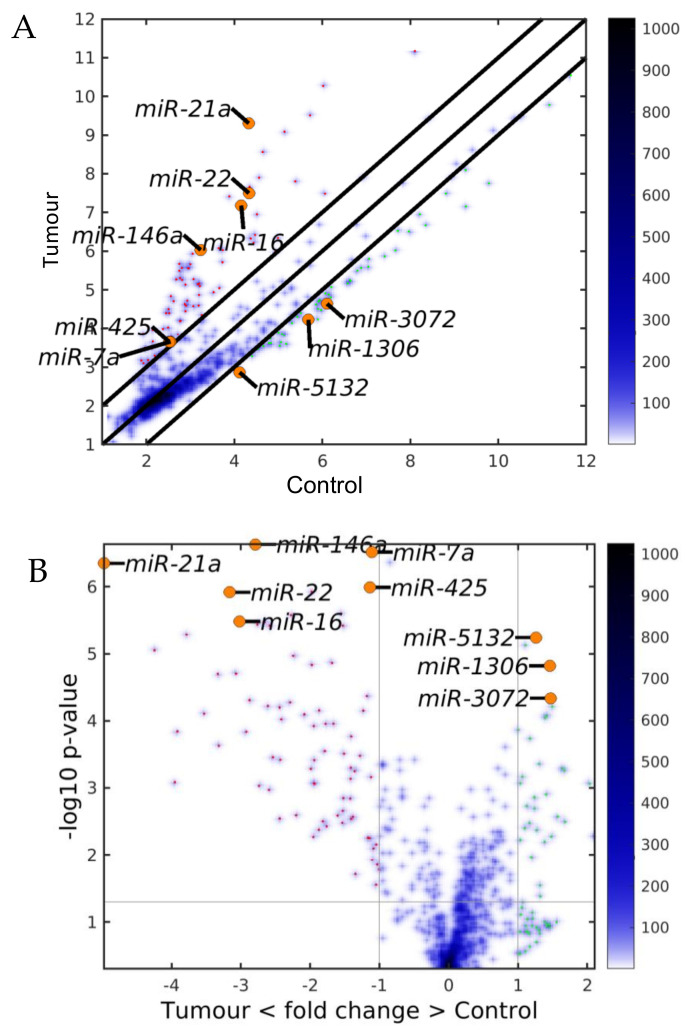
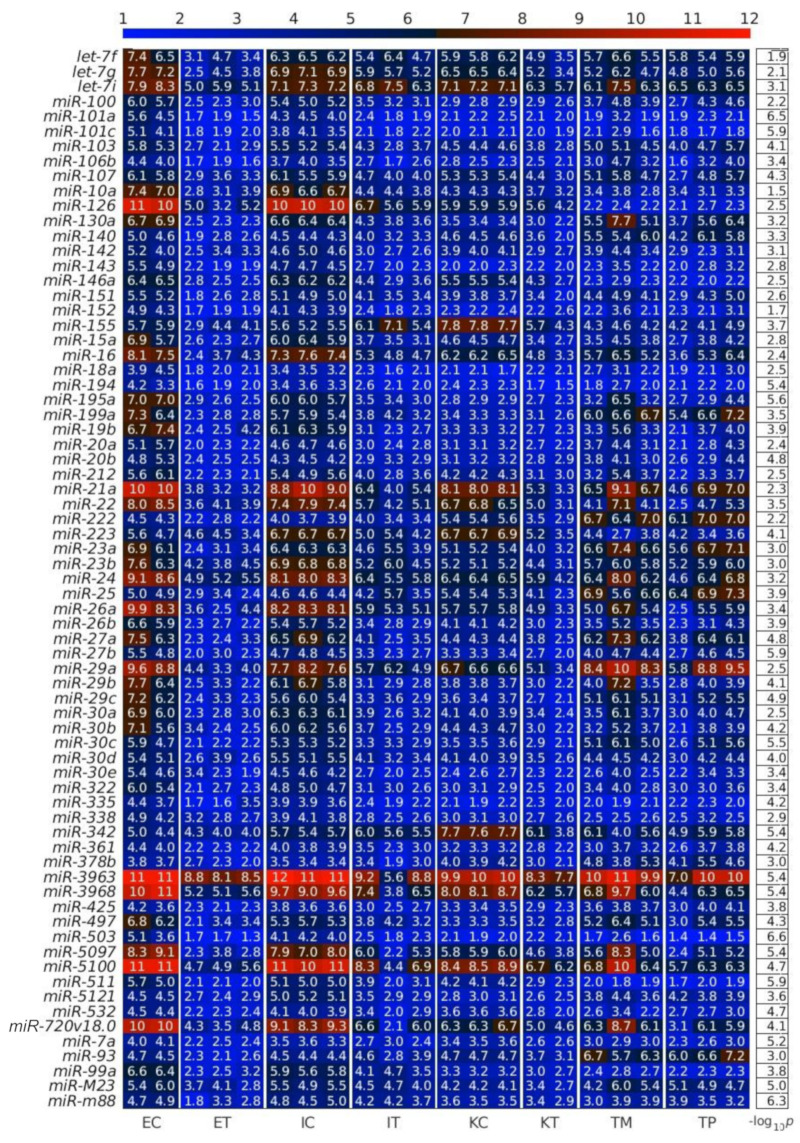
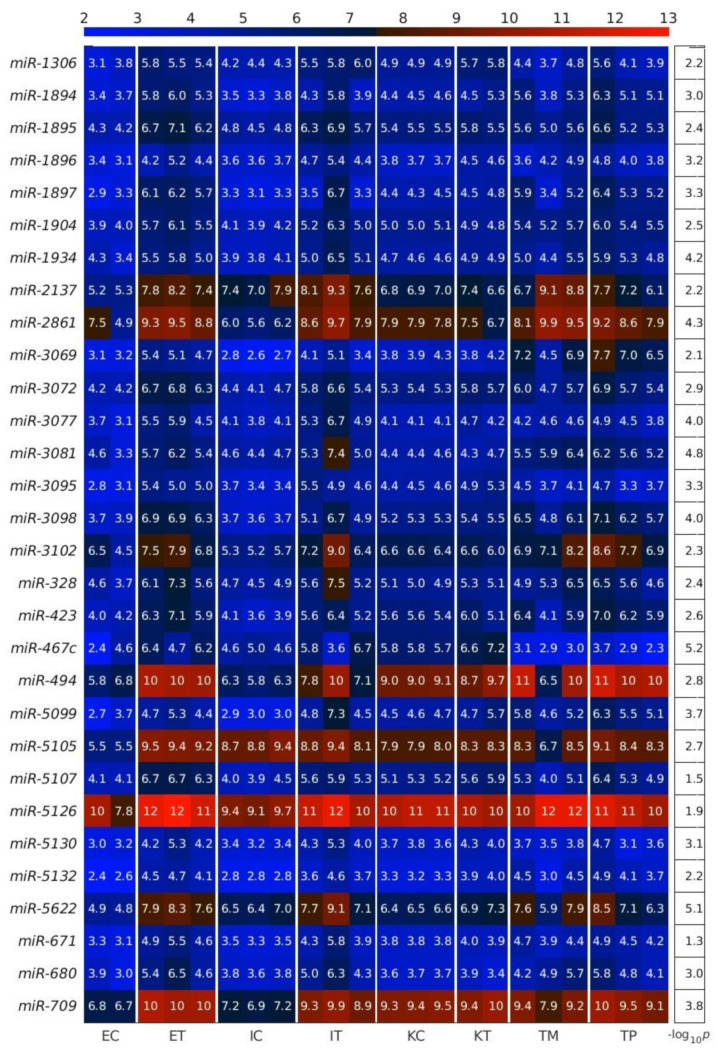
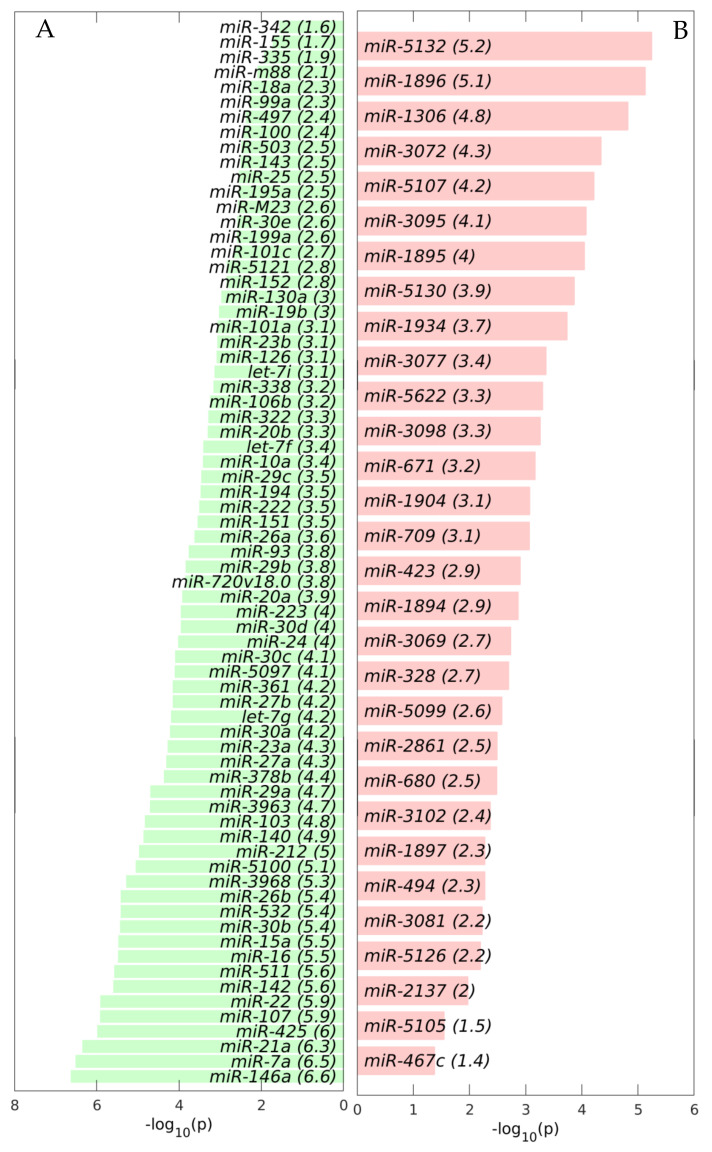
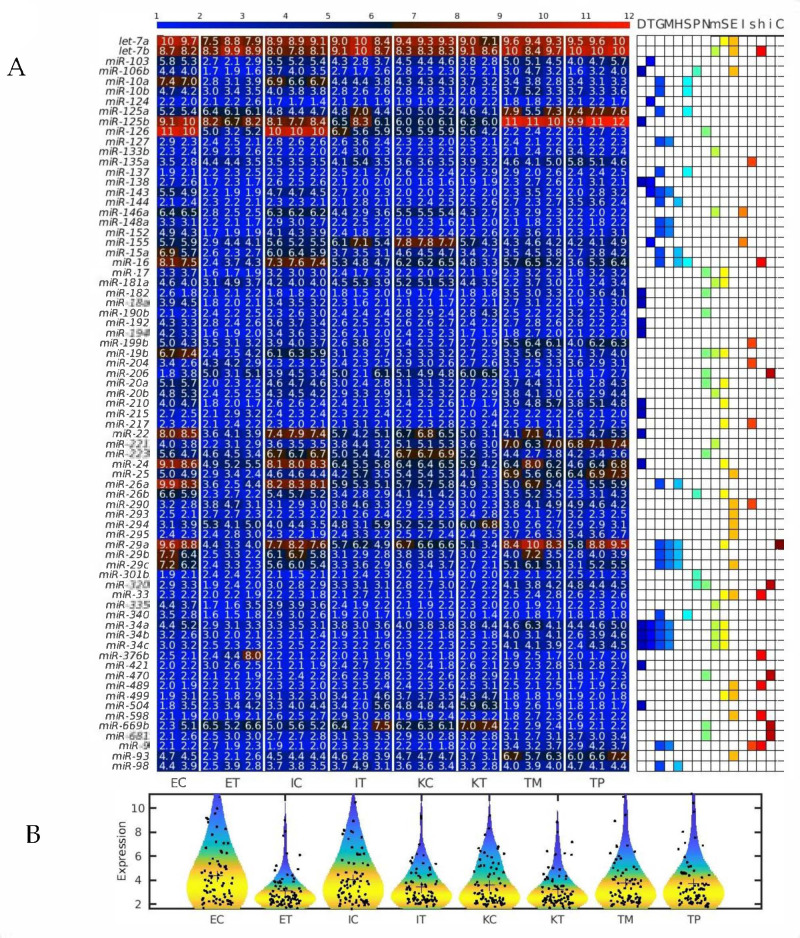
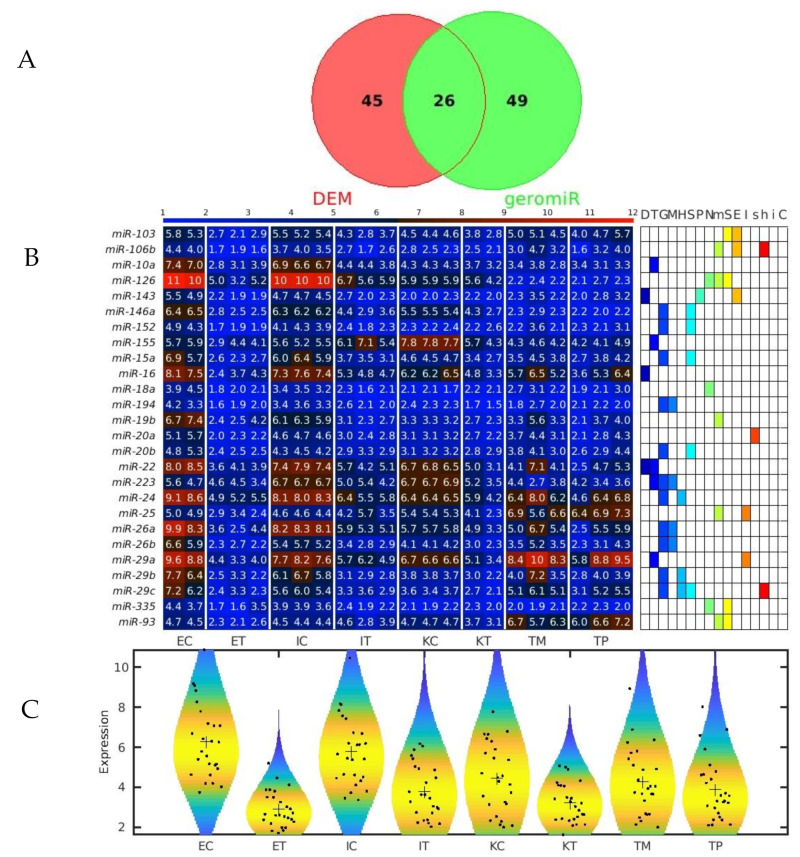
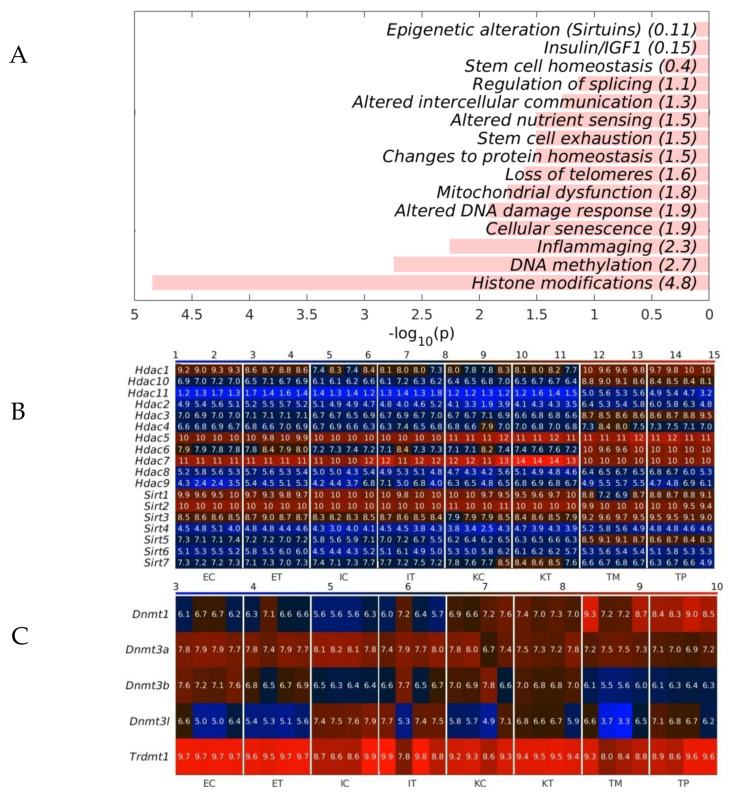
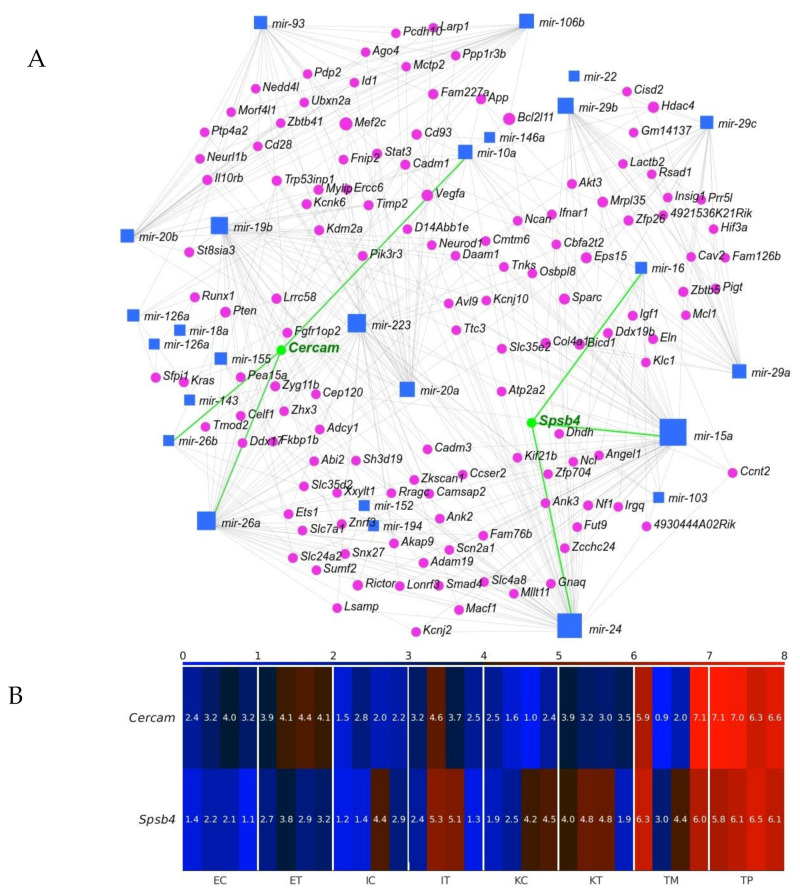
Cancer is a phenomenon broadly related to ageing in various ways such as cell cycle deregulation, metabolic defects or telomerases dysfunction as principal processes. Although the tumor cell is the main actor in cancer progression, it is not the only element of the disease. Cells and the matrix surrounding the tumor, called the tumor microenvironment (TME), play key roles in cancer progression. Phenotypic changes of the TME are indispensable for disease progression and a few of these transformations are produced by epigenetic changes including miRNA dysregulation. In this study, we found that a specific group of miRNAs in the liver TME produced by colon cancer called geromiRs, which are miRNAs related to the ageing process, are significantly downregulated. The three principal cell types involved in the liver TME, namely, liver sinusoidal endothelial cells, hepatic stellate (Ito) cells and Kupffer cells, were isolated from a murine hepatic metastasis model, and the miRNA and gene expression profiles were studied. From the 115 geromiRs and their associated hallmarks of aging, which we compiled from the literature, 75 were represented in the used microarrays, 26 out of them were downregulated in the TME cells during colon cancer colonization of the liver, and none of them were upregulated. The histone modification hallmark of the downregulated geromiRs is significantly enriched with the geromiRs miR-15a, miR-16, miR-26a, miR-29a, miR-29b and miR-29c. We built a network of all of the geromiRs downregulated in the TME cells and their gene targets from the MirTarBase database, and we analyzed the expression of these geromiR gene targets in the TME. We found that Cercam and Spsb4, identified as prognostic markers in a few cancer types, are associated with downregulated geromiRs and are upregulated in the TME cells.

Keywords: colorectal cancer; geromiRs; histone modifications; liver metastasis; miRNA; tumor microenvironment.


Conflict of interest statement

The authors declare no conflict of interest. The funders had no role in the design of the study; in the collection, analyses, or interpretation of data; in the writing of the manuscript, or in the decision to publish the results.

Figures

Figure 1
Figure 1
Schematic representation of the experimental design with the murine liver metastasis model. Two groups of mice were inoculated, one with C26 murine colon cancer cells (Tumor) and another with PBS (Control), respectively. After 15 days, the mice were perfused and after Percoll gradient centrifugation, three types of liver cells were collected, namely, liver sinusoidal endothelial cells (E), Ito cells (I) and Kupffer cells (K) from the healthy control (C) and the tumor microenvironment, TME (T), and isolated to perform omics experiments (gene expression and miRNA expression microarrays). TP and TM denote colorectal cancer (CRC) primary and tumor liver metastasis cells, respectively. Insert images of metastasized and healthy livers harvested in our experiments are shown for each condition.
Figure 2
Figure 2
Differentially expressed miRNAs (DEMs) between the control and the tumor microenvironment (TME) cells. (A) Scatter plot and (B) Volcano plot. The black lines are the boundaries of the two–fold changes in the levels between the mean expression of the three studied liver cell types in the control and the TME samples. The miRNAs upregulated in the TME samples (ordinate) are shown with red dots, and those downregulated, with green. Several geromiR positions are shown as orange circles. The color bar indicates the scattering density. Darker blue color corresponds to higher scattering density. The expression levels are log2–scaled.
Figure 3
Figure 3
Downregulated miRNAs between the control and the tumor microenvironment (TME) cells. Heatmap of the expression of the differentially expressed miRNAs (DEMs) in lexicographic order of the miRNA names. The color bar codifies the miRNA expression in log2 scale. Higher miRNA expression corresponds to redder color. The −log10 (p-value) of the DEMs are presented in a table to the right of the heatmap. The samples are denoted with E, I and K for endothelial, Ito and Kupffer cell, C and T for the control and the TME cells, and TP and TM for colorectal cancer (CRC) primary and liver metastasis cells, respectively.
Figure 4
Figure 4
Upregulated miRNAs between the control and the tumor microenvironment (TME) cells. Heatmap of the expression of the differentially expressed miRNAs (DEMs) in lexicographic order of the miRNA names. The color bar codifies the miRNA expression in log2 scale. Higher miRNA expression corresponds to redder color. The −log10 (p-value) of the DEMs are presented in a table to the right of the heatmap. The samples are denoted with E, I and K for endothelial, Ito and Kupffer cells, C and T for the control and the TME cells, and TP and TM for colorectal cancer (CRC) primary and liver metastasis cells, respectively.
Figure 5
Figure 5
Differentially expressed miRNAs (DEMs) between the control and the tumor microenvironment (TME) cells. Bar plots of the −log10 (p) of the statistical significance of the DEMs. (A) Downregulated in the TME DEMs. (B) Upregulated in the TME DEMs.
Figure 6
Figure 6
Several microRNAs (miRNAs) downregulated simultaneously in the three types of tumor microenvironment (TME) cells are hallmarks of eukaryotic aging. (A) Heatmap of all geromiRs and their annotation with different aging hallmarks. D: altered DNA damage response, T: loss of telomeres, G: changes in gene regulation, M: DNA methylation, H: histone modifications, S: regulation of splicing, P: changes to protein homeostasis, N: altered nutrient sensing, m: mitochondrial dysfunction, S: cellular senescence, E: stem cell exhaustion, I: inflammaging, s: Sirtuins, h: stem cell homeostasis, i: insulin/IGF1, C: altered intercellular communication. The samples are denoted with E, I and K for endothelial, Ito and Kupffer cells, and C and T for the control and the TME cells, respectively. TP and TM denote colorectal cancer (CRC) primary and liver metastasis cells, respectively. (B) Violin plots of the expression distribution of the miRNAs associated with the hallmarks of eukaryotic aging. The crosses represent the position of the means, while the black points represent the spread of the expression of the miRNAs used to build the distributions.
Figure 7
Figure 7
GeromiRs downregulated in the TME. (A) Venn diagram of the intersection between the downregulated differentially expressed miRNAs (DEMs) in the colorectal cancer (CRC) liver tumor microenvironment (TME) cells and the geromiRs. (B) Heatmap of aging-related miRNAs and their annotation with different aging hallmarks. D: altered DNA damage response, T: loss of telomeres, G: changes in gene regulation, M: DNA methylation, H: histone modifications, S: regulation of splicing, P: changes to protein homeostasis, N: altered nutrient sensing, m: mitochondrial dysfunction, S: cellular senescence, E: stem cell exhaustion, I: inflammaging, s: Sirtuins, h: stem cell homeostasis, i: insulin/IGF1, C: altered intercellular communication. The samples are denoted with E, I and K for endothelial, Ito and Kupffer cells, and C and T for the control and the TME cells, respectively. TP and TM denote the CRC primary and liver metastasis cells, respectively. (C) Violin plots of the expression distribution of the miRNAs associated with the hallmarks of eukaryotic aging. The crosses represent the position of the means, while the black points represent the spread of the expression of the miRNAs used to build the distributions.
Figure 8
Figure 8
Statistical enrichment of the hallmarks of the geromiRs downregulated in the tumor microenvironment (TME). (A) Bar plots of the −log10 (p) of the statistical enrichment of the hallmarks of the geromiRs downregulated in TME. (B) Heatmap of the expression of the histone deacetylases (HDACs) and of the Sirtuins. (C) Heatmap of the expression of the DNA methyltransferases. The color bars codify the gene expression in log2 scale. Higher gene expression corresponds to redder color. The samples are denoted with E, I and K for endothelial, Ito and Kupffer cells, C and T for the control and the TME cells and TP and TM for the CRC primary and liver metastasis cells, respectively.
Figure 9
Figure 9
Interaction between geromiRs downregulated in the tumor microenvironment (TME) cells and their gene targets. (A) Network of the geromiRs downregulated in the TME cells and their gene targets. The blue squares mark geromiRs and the magenta circles mark gene targets. The gene names in green, Cercam and Spsb4, mark the gene targets upregulated in the TME cells in relation to the healthy control cells, and the green lines, their connections with their associated geromiRs. (B) Heatmap of the expression of the gene targets upregulated in the TME cells. The color bar codifies the miRNA expression in log2 scale. Higher miRNA expression corresponds to redder color. The samples are denoted with E, I and K for endothelial, Ito and Kupffer cells, C and T for the control and the TME cells, and TP and TM for colorectal cancer (CRC) primary and liver metastasis cells, respectively.

Similar articles

Cited by

References

    1. Dagogo-Jack I., Shaw A.T. Tumour Heterogeneity and Resistance to Cancer Therapies. Nat. Rev. Clin. Oncol. 2018;15:81–94. doi: 10.1038/nrclinonc.2017.166. - DOI - PubMed
    1. American Cancer Society . Key Statistics for Colorectal Cancer. American Cancer Society; Atlanta, GA, USA: 2021.
    1. Jin L., Han B., Siegel E., Cui Y., Giuliano A., Cui X. Breast Cancer Lung Metastasis: Molecular Biology and Therapeutic Implications. Cancer Biol. Ther. 2018;19:858–868. doi: 10.1080/15384047.2018.1456599. - DOI - PMC - PubMed
    1. Akhtar M., Haider A., Rashid S., Al-Nabet A.D.M.H. Paget’s “Seed and Soil” Theory of Cancer Metastasis: An Idea Whose Time has Come. Adv. Anat. Pathol. 2019;26:69–74. doi: 10.1097/PAP.0000000000000219. - DOI - PubMed
    1. Alpini G., Phillips J.O., Vroman B., LaRusso N.F. Recent Advances in the Isolation of Liver Cells. Hepatology. 1994;20:494–514. doi: 10.1002/hep.1840200231. - DOI - PubMed

MeSH terms