. 2021 May 1;22(9):4822.
doi: 10.3390/ijms22094822.

The Kynurenic Acid Analog SZR72 Enhances Neuronal Activity after Asphyxia but Is Not Neuroprotective in a Translational Model of Neonatal Hypoxic Ischemic Encephalopathy

Affiliations

The Kynurenic Acid Analog SZR72 Enhances Neuronal Activity after Asphyxia but Is Not Neuroprotective in a Translational Model of Neonatal Hypoxic Ischemic Encephalopathy

Viktória Kovács et al. Int J Mol Sci. .

Abstract

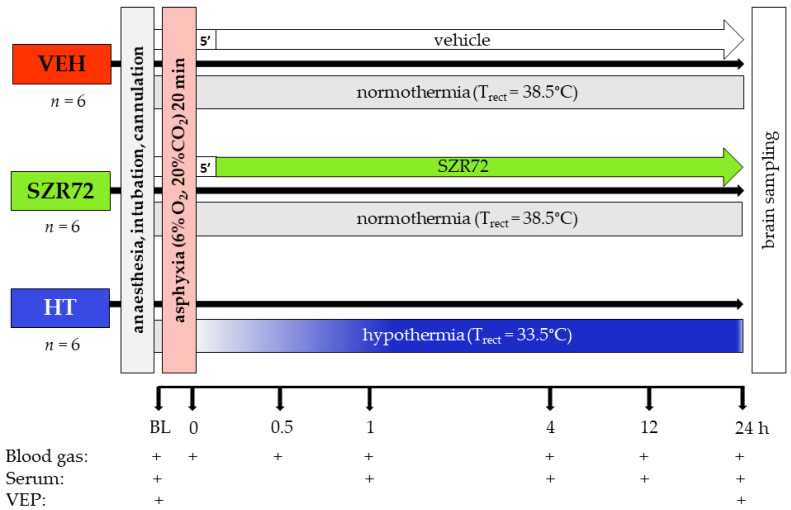
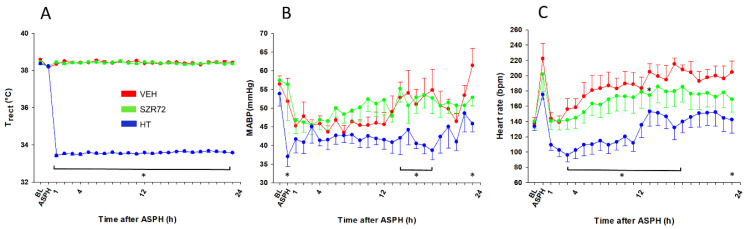
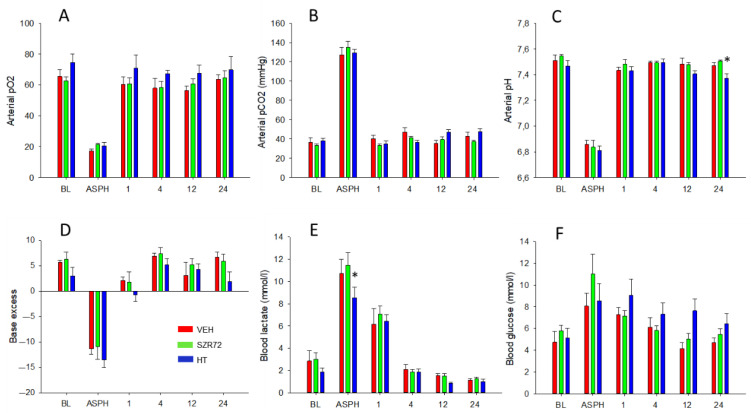
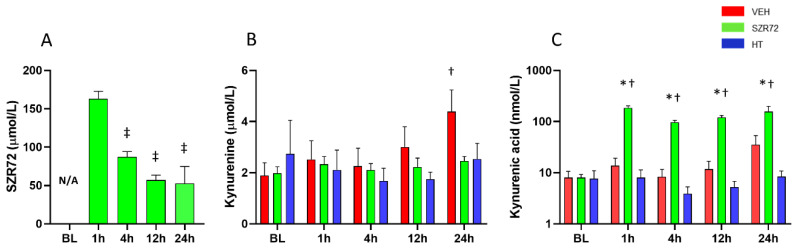
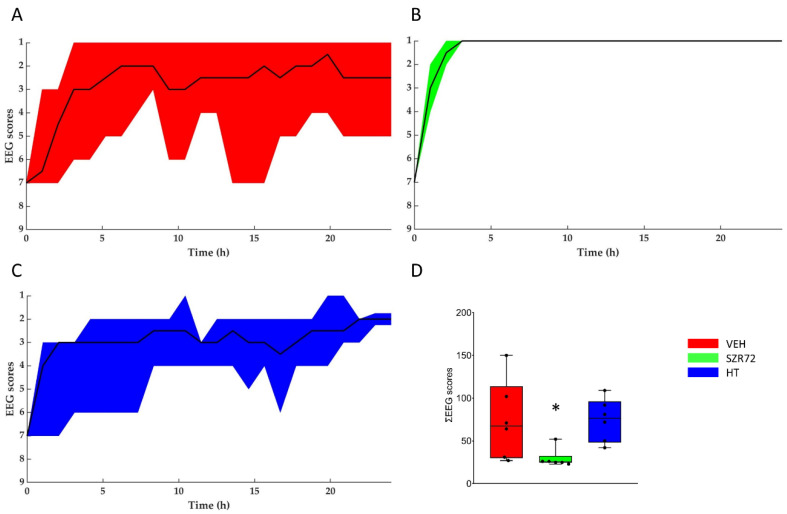
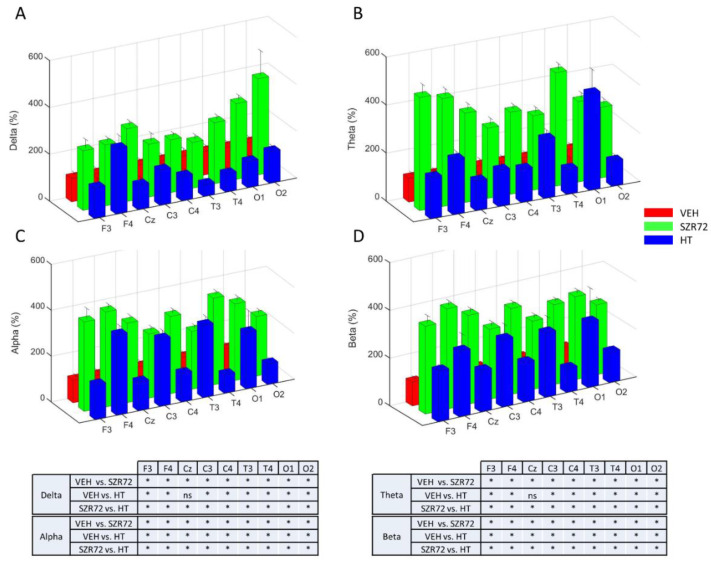
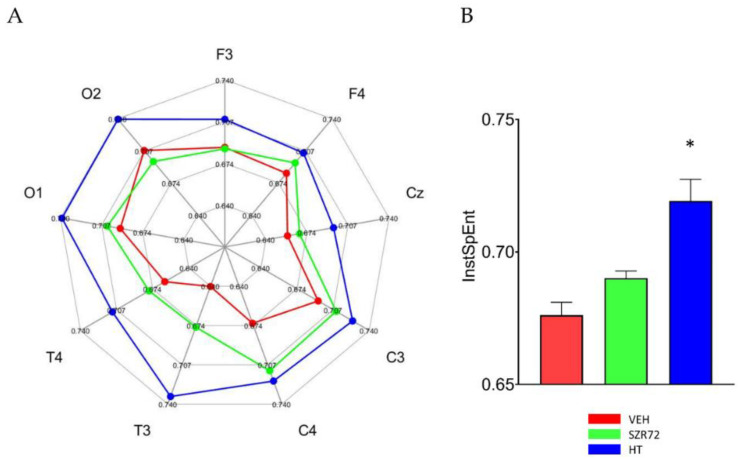
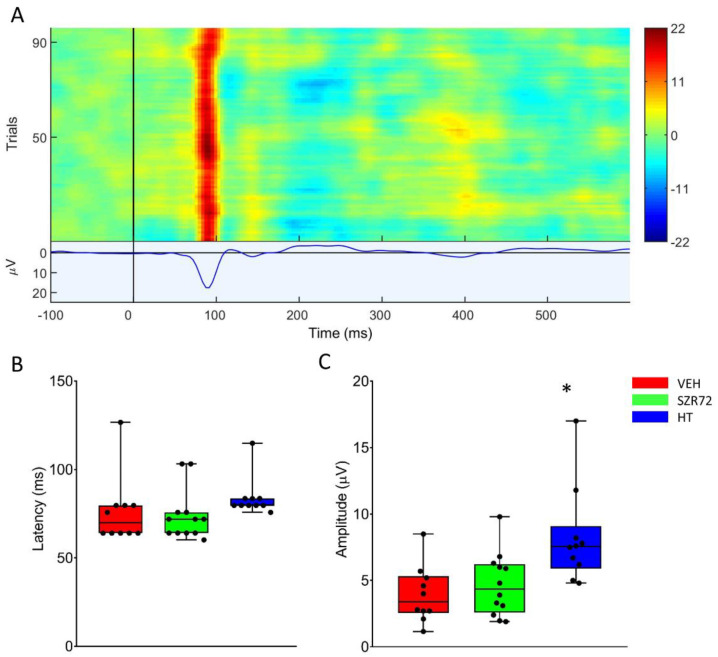
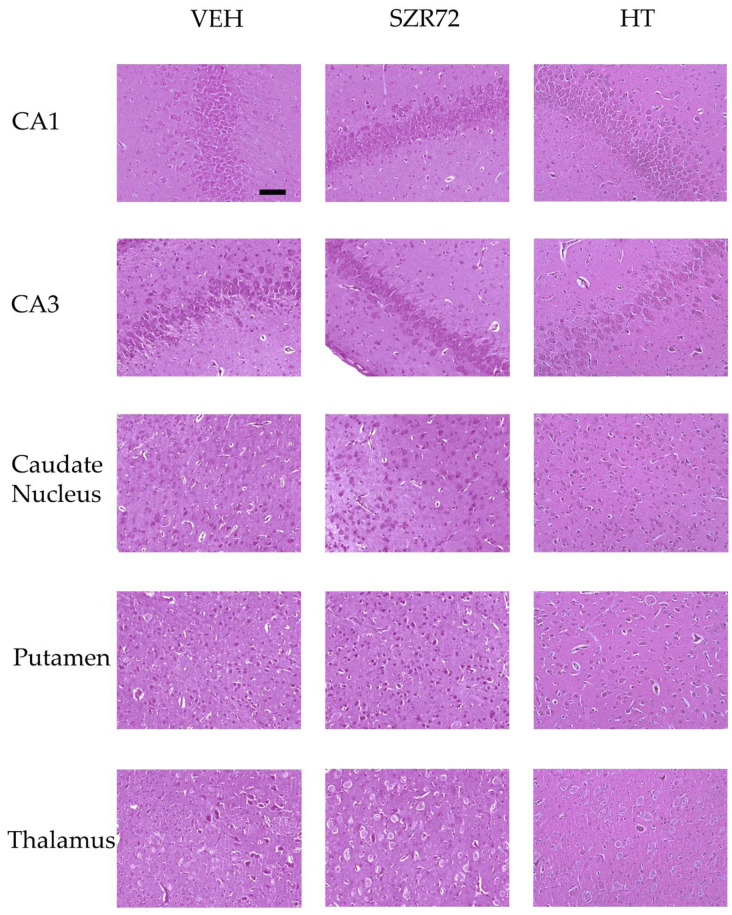
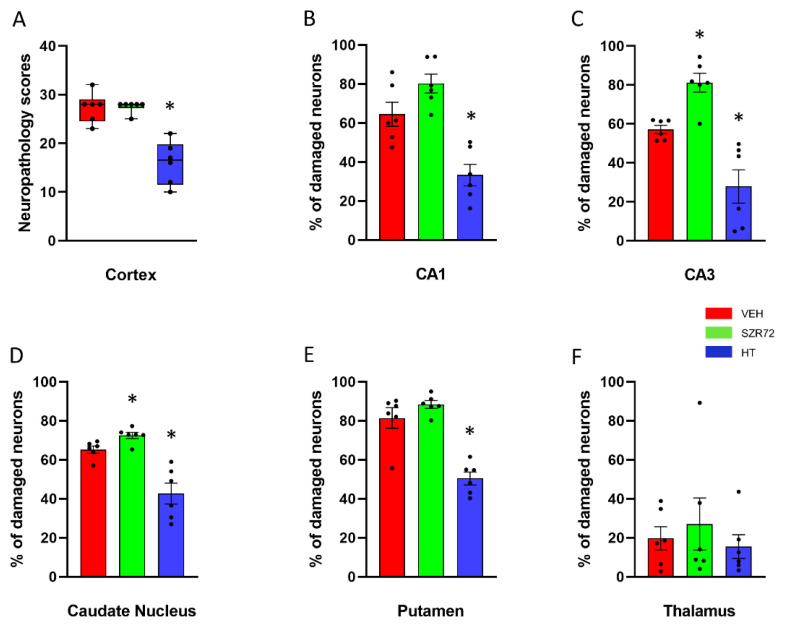
Hypoxic-ischemic encephalopathy (HIE) remains to be a major cause of long-term neurodevelopmental deficits in term neonates. Hypothermia offers partial neuroprotection warranting research for additional therapies. Kynurenic acid (KYNA), an endogenous product of tryptophan metabolism, was previously shown to be beneficial in rat HIE models. We sought to determine if the KYNA analog SZR72 would afford neuroprotection in piglets. After severe asphyxia (pHa = 6.83 ± 0.02, ΔBE = -17.6 ± 1.2 mmol/L, mean ± SEM), anesthetized piglets were assigned to vehicle-treated (VEH), SZR72-treated (SZR72), or hypothermia-treated (HT) groups (n = 6, 6, 6; Tcore = 38.5, 38.5, 33.5 °C, respectively). Compared to VEH, serum KYNA levels were elevated, recovery of EEG was faster, and EEG power spectral density values were higher at 24 h in the SZR72 group. However, instantaneous entropy indicating EEG signal complexity, depression of the visual evoked potential (VEP), and the significant neuronal damage observed in the neocortex, the putamen, and the CA1 hippocampal field were similar in these groups. In the caudate nucleus and the CA3 hippocampal field, neuronal damage was even more severe in the SZR72 group. The HT group showed the best preservation of EEG complexity, VEP, and neuronal integrity in all examined brain regions. In summary, SZR72 appears to enhance neuronal activity after asphyxia but does not ameliorate early neuronal damage in this HIE model.

Keywords: birth asphyxia; kynurenine; neonatal encephalopathy; newborn pig; therapeutic hypothermia.


Conflict of interest statement

The authors declare no conflict of interest. The funders had no role in the design of the study; in the collection, analyses, or interpretation of data; in the writing of the manuscript, or in the decision to publish the results.

Figures

Figure 1
Figure 1
Graphic representation of the experimental protocol. Anesthetized, instrumented piglets were assigned to either the vehicle-treated (VEH), SZR72-treated (SZR72), or the hypothermia-treated (HT) groups. After obtaining baseline (BL) blood gases, serum samples, and visual evoked potential (VEP) recordings, the animals were exposed to asphyxia induced by ventilation with a hypoxic/hypercapnic gas mixture for 20 min. SZR72 or vehicle administration started 5 min upon completion of asphyxia, whereas in the HT group cooling started simultaneously with reoxygenation, rectal temperature (Trect) reached 33.5 °C in 40–50 min. Blood gases, serum samples, and VEP recordings were obtained at the indicated time points. At the end of the observation period, the brains were processed for neuropathology examination.
Figure 2
Figure 2
Physiological parameters. (A): In the normothermic vehicle-treated (VEH) and SZR72-treated (SZR72) groups, rectal temperature was maintained at 38.5 °C throughout the experiments. The hypothermia-treated (HT) group was also normothermic at baseline (BL) and during the asphyxia (ASPH); however, the rectal temperature reached therapeutic levels at 33.5 °C by 1 h after asphyxia and was maintained at that level for the rest of the observation period. (B): mean arterial blood pressure (MABP) was within the normal range for all groups, although it was significantly lower in the HT group at the end of the asphyxia. There was no significant difference between the VEH and the SZR72 groups over the whole observation period, but it tended to be lower in the HT group that reached statistical significance first at 14 h. (C): heart rate was elevated by asphyxia from baseline levels, and it remained elevated in the normothermic groups throughout the observation period. There was a tendency for a somewhat smaller heart rate in the SZR72 group; however, there was no significant difference between the groups except at 13 h after asphyxia. As expected, hypothermia significantly reduced the heart rate that was significantly different from the corresponding values of the VEH group at most time points. * p < 0.05, significantly different from the corresponding value of the VEH group for all time points in the brackets and also for individual time points. Significant differences from the respective baselines within the groups are not indicated for clarity.
Figure 3
Figure 3
Blood chemistry data. Compared to baseline (BL) levels, asphyxia (ASPH) resulted in marked hypoxia (A), hypercapnia (B), and acidosis (C), the latter showing a robust metabolic component, indicated both by negative base excess (D) and lactacidosis (E). Blood glucose level elevations during asphyxia were not statistically significant (F). Blood gases, pH, and base excess were restored by 1 h after asphyxia. Lactic acid levels were still significantly elevated at 1 h then returned to baseline levels by 4 h. There was no difference among the experimental groups in the asphyxia-induced changes in blood gas parameters; only the increase in lactate levels during asphyxia was somewhat lower in the HT group, although this difference was not detected in base deficit, and lactate levels were virtually identical at 1 h after asphyxia in the three groups. In a similar fashion, the post-asphyxia blood gas parameters were very similar in all three experimental groups throughout the observation period, with a tendency for slightly higher blood sugar levels in the HT group. * p < 0.05, significantly different from the corresponding value of the VEH group. Significant differences from the respective baselines within the groups are not indicated for clarity.
Figure 4
Figure 4
Serum levels of SZR72, kynurenine, and kynurenic acid (KYNA). (A): SZR72 levels were highest at 1 h after asphyxia reflecting the effect of bolus drug administration, then they were gradually decreased and stabilized in 50–100 µmol/L range. (B): Kynurenine levels were similar among the different groups at baseline (BL), and they were largely unaffected by asphyxia, except there was a statistically significant elevation in the VEH group at 24 h. (C): KYNA levels were similar among the different groups at BL, and they were unchanged in the VEH and HT groups after asphyxia, but they were increased 10-fold in the SZR72 group (note the log scale of C). *, †, ‡ p < 0.05, significantly different from the corresponding value of the VEH group, from the respective baseline value of the group, or from the respective 1 h value of the group, respectively.
Figure 5
Figure 5
Regeneration of the brain electrical activity shown with the amplitude-based EEG scoring system. (A–C): The black lines show the medians, whereas the colors indicate the interquartile ranges. At the onset of reoxygenation after asphyxia, the EEG was flat in all animals (score 7); afterward, it gradually restored to a continuous electrical activity. Quick restoration of EEG activity was conspicuous in the SZR72 group. (D): the box plot shows the sum of the EEG scores determined in each hour of the post-insult observation period. The black line is the median, the box shows the interquartile range, the whiskers show the 10th–90th percentiles, and the bullets are the raw data points. The SZR72 group had significantly lower values, in agreement with the quicker and more complete restoration of EEG activity. * p < 0.05 significantly different from the VEH group.
Figure 6
Figure 6
Power spectral density (PSD) analysis of the EEG signal at 24 h after asphyxia. Data are expressed as % of the VEH group (mean ± SD) in the frontal (F), central (C), temporal (T), occipital (O) leads in the respective frequency ranges (Panels AD). In all leads and in all frequency ranges, PSDs were consistently much higher in the SZR72 group than in the VEH group. PSDs were also higher in the HT group, compared to VEH, but they were usually lower than in the SZR72 group. Pairwise comparisons are shown in the tables for each frequency range, and leads * p < 0.05, n.s. not significant.
Figure 7
Figure 7
Instantaneous spectral entropy (InstSpEnt) of the EEG signal at 24 h after asphyxia. (A): In the spider chart, the average values obtained in the respective EEG leads are shown. In most leads, InstSpEnt values of the VEH group are the smallest representing the least signal complexity, followed by the values in the SZR72 group. In all leads, the HT group unequivocally produced the signal with the highest entropy. (B): The bar graph shows the InstSpENt averages of all leads, indicating similar entropy values in the VEH and SZR72 group EEG signal, which are significantly smaller than the values obtained in the HT group. * p < 0.05, significantly different from the corresponding value of the VEH group.
Figure 8
Figure 8
Visual evoked potentials (VEP) evoked at 24 h after asphyxia. (A): The heat map shows the responses to the 100 individual light stimuli, constituting the VEP waveform displaying a marked P100 component in a representative record. (B): There was no difference among the groups among P100 latency that were unaffected by asphyxia. (C): P100 amplitudes in the VEH and SZR72 groups were similar, both decreased from pre-asphyxia baselines. The HT group displayed the highest P100 amplitudes, indicating the best preservation of function. The black line is the median, the box shows the interquartile range, the whiskers show the 10th–90th percentiles, and the bullets are the raw data points. Baseline P100 amplitudes were 8.7 ± 1.7, 8.1 ± 0.6, and 12.0 ± 1.8 µV (mean ± SEM) for VEH, SZR72, and HT groups, respectively. * p < 0.05, significantly different from the corresponding value of the VEH group.
Figure 9
Figure 9
Representative photomicrographs of H&E stained sections from the hippocampal CA1/CA3 subfields, the caudate nucleus, the putamen, and the thalamus. Asphyxia elicited severe neuronal injury that is evident by the large percentage of damaged red neurons in the VEH and the SZR72 group, whereas neuronal damage was markedly less in the HT group. The images were obtained from individuals representing the group median values. Scale bar: 100 μm.
Figure 10
Figure 10
Neuropathology. (A): Sum of neuropathological scores determined in the frontal, parietal, occipital, and temporal neocortical areas. The boxes represent the interquartile range, the line within the box represents the median value, and the bullets are the raw data points. Asphyxia induced very similar neocortical damage in the VEH and SZR72 groups; however, neuronal damage was significantly reduced in the HT group. (B,C): Asphyxia elicited marked neuronal injury in the CA1/CA3 hippocampal subfields in the VEH group that appeared to be even more severe in the SZR72 group: the ratio of damaged neurons was indeed significantly larger in the CA3 in the SZR72, compared to the VEH group. Hypothermia, however, yielded significant neuroprotection in both areas. (D,E): Similar to the CA3 hippocampal subfield, SZR72 treatment resulted in a slightly but significantly larger neuronal damage, compared to VEH in the caudate nucleus but not in the putamen. HT was significantly neuroprotective in both assessed regions of the basal ganglia. (F): In this model, the asphyxia-induced neuronal injury was moderate in the thalamus, and there were no significant differences among the groups. * p < 0.05 significantly different from the VEH group. Significant differences between the SZR72 and the HT groups are not shown for clarity.

Similar articles

Cited by

References

    1. Azzopardi D., Brocklehurst P., Edwards D., Halliday H., Levene M., Thoresen M., Whitelaw A. The TOBY study. Whole body hypothermia for the treatment of perinatal asphyxial encephalopathy: A randomised controlled trial. BMC Pediatr. 2008;8:1–12. doi: 10.1186/1471-2431-8-17. - DOI - PMC - PubMed
    1. Kurinczuk J.J., White-Koning M., Badawi N. Epidemiology of neonatal encephalopathy and hypoxic-ischaemic encephalopathy. Early Hum. Dev. 2010;86:329–338. doi: 10.1016/j.earlhumdev.2010.05.010. - DOI - PubMed
    1. Lee A.C.C., Kozuki N., Blencowe H., Vos T., Bahalim A., Darmstadt G.L., Niermeyer S., Ellis M., Robertson N.J., Cousens S., et al. Intrapartum-related neonatal encephalopathy incidence and impairment at regional and global levels for 2010 with trends from 1990. Pediatr. Res. 2013;74:50–72. doi: 10.1038/pr.2013.206. - DOI - PMC - PubMed
    1. Jacobs S.E., Berg M., Hunt R., Tarnow-Mordi W.O., Inder T.E., Davis P.G. Cooling for newborns with hypoxic ischaemic encephalopathy. Cochrane Database Syst. Rev. 2013:CD003311. doi: 10.1002/14651858.CD003311.pub3. - DOI - PubMed
    1. Hertelendy P., Toldi J., Fülöp F., Vécsei L. Ischemic Stroke and Kynurenines: Medicinal Chemistry Aspects. Curr. Med. Chem. 2018;25:5945–5957. doi: 10.2174/0929867325666180313113411. - DOI - PubMed

MeSH terms

LinkOut - more resources