

Cord Blood T Cells Expressing High and Low PKCζ Levels Develop into Cells with a Propensity to Display Th1 and Th9 Cytokine Profiles, Respectively
- PMID: 34063174
- PMCID: PMC8124775
- DOI: 10.3390/ijms22094907
Cord Blood T Cells Expressing High and Low PKCζ Levels Develop into Cells with a Propensity to Display Th1 and Th9 Cytokine Profiles, Respectively
Abstract
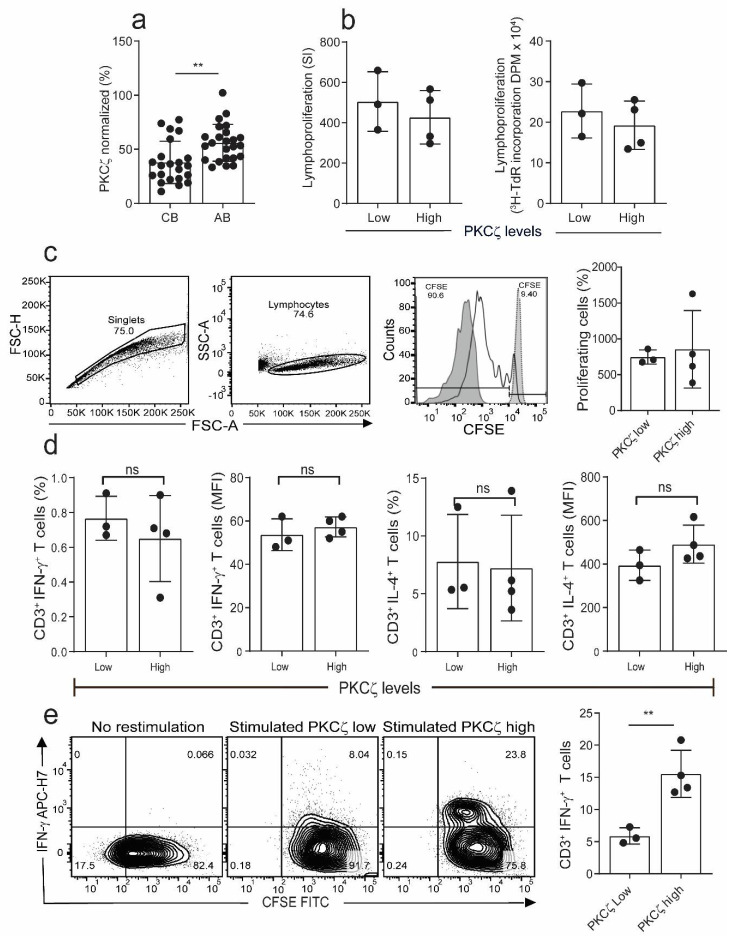
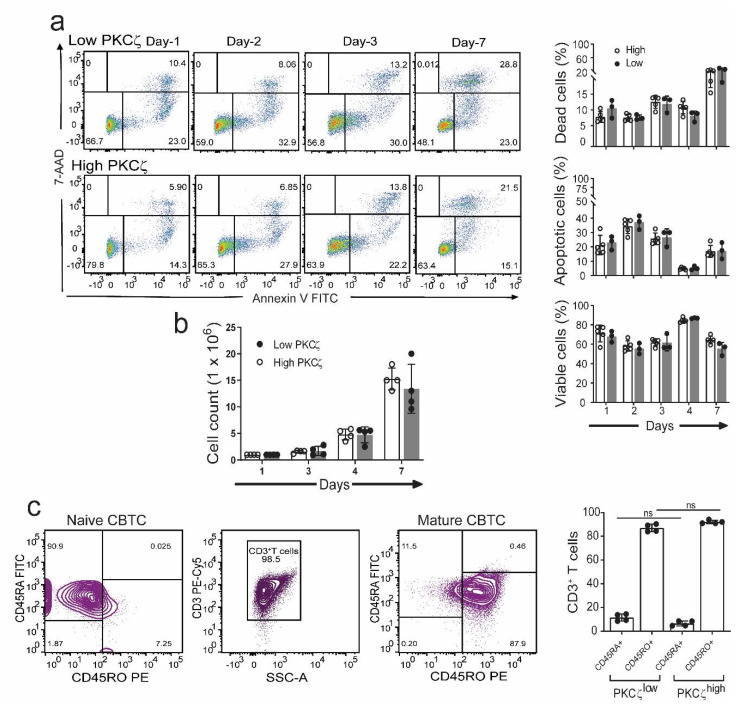
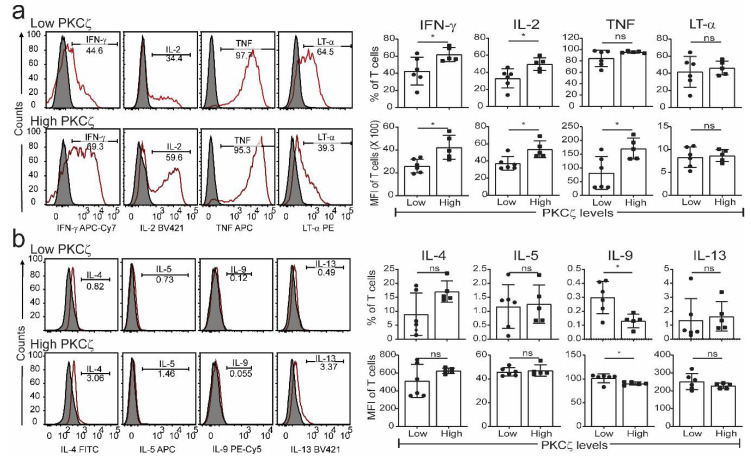
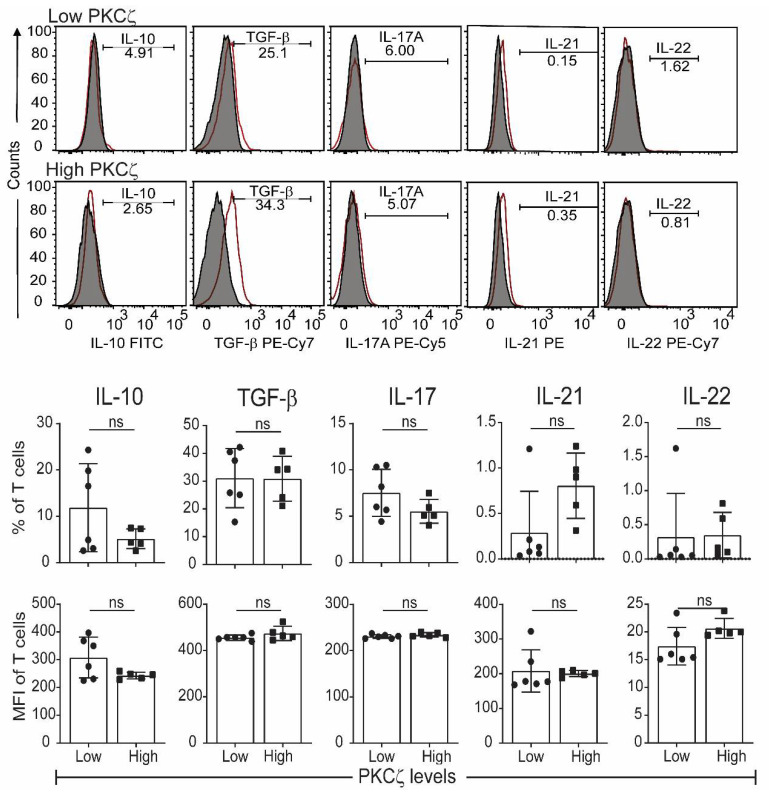
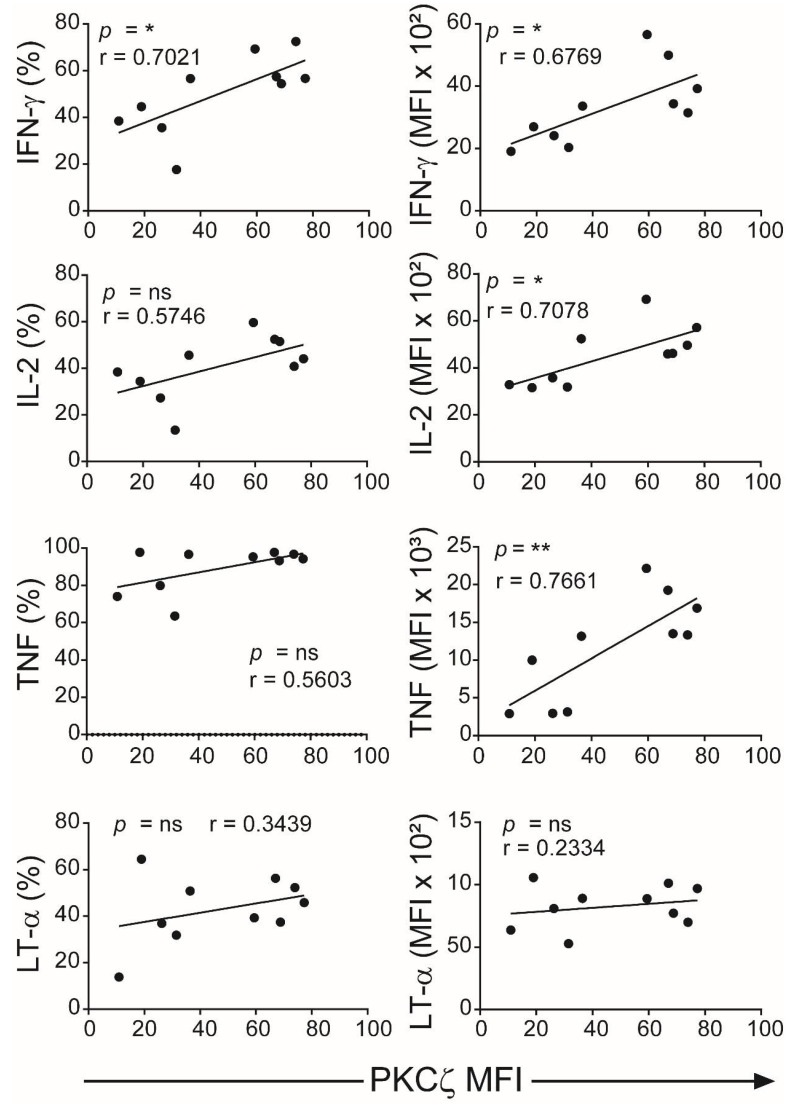
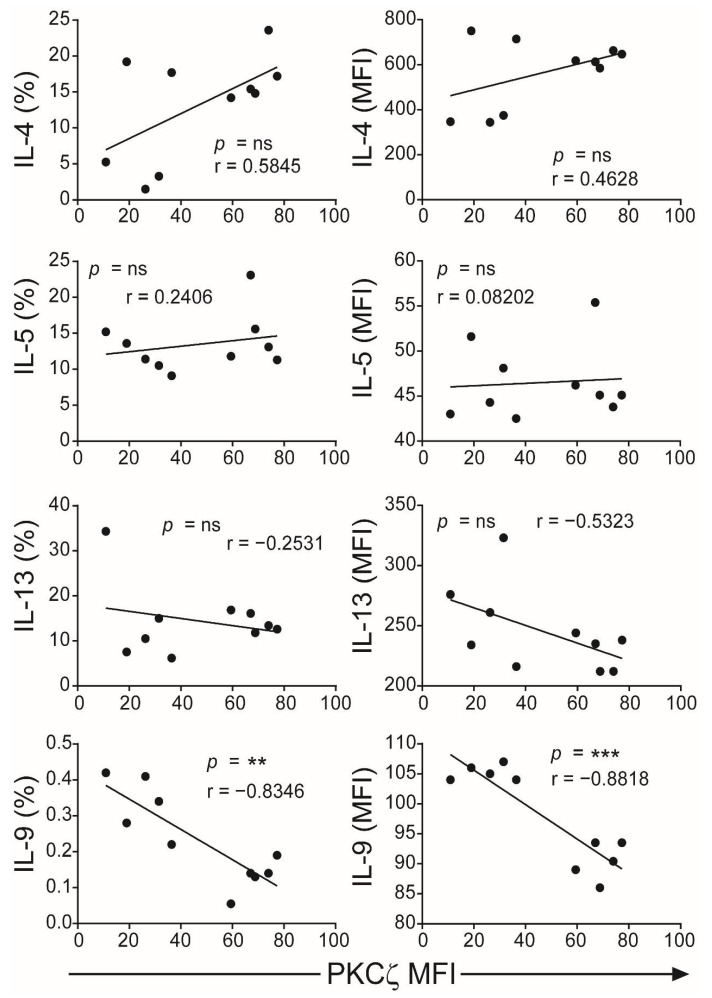
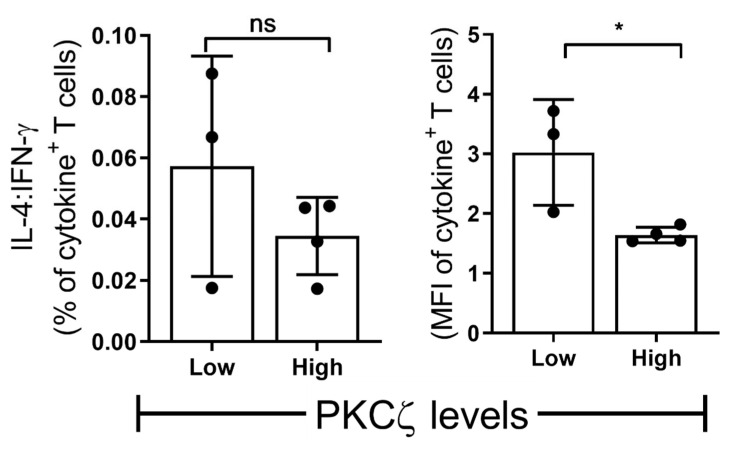
Low Protein Kinase C zeta (PKCζ) levels in cord blood T cells (CBTC) have been shown to correlate with the development of allergic sensitization in childhood. However, little is known about the mechanisms responsible. We have examined the relationship between the expression of different levels of PKCζ in CBTC and their development into mature T cell cytokine producers that relate to allergy or anti-allergy promoting cells. Maturation of naïve CBTC was initiated with anti-CD3/-CD28 antibodies and recombinant human interleukin-2 (rhIL-2). To stimulate lymphocyte proliferation and cytokine production the cells were treated with Phytohaemagglutinin (PHA) and Phorbol myristate acetate (PMA). Irrespective of the PKCζ levels expressed, immature CBTC showed no difference in lymphocyte proliferation and the production of T helper 2 (Th2) cytokine interleukin-4 (IL-4) and Th1 cytokine, interferon-gamma (IFN-γ), and influenced neither their maturation from CD45RA+ to CD45RO+ cells nor cell viability/apoptosis. However, upon maturation the low PKCζ expressing cells produced low levels of the Th1 cytokines, IFN-γ, IL-2 and tumour necrosis factor-alpha (TNF), no changes to levels of the Th2 cytokines, IL-4, IL-5 and IL-13, and an increase in the Th9 cytokine, IL-9. Other cytokines, lymphotoxin-α (LT-α), IL-10, IL-17, IL-21, IL-22 and Transforming growth factor-beta (TGF-β) were not significantly different. The findings support the view that low CBTC PKCζ levels relate to the increased risk of developing allergic diseases.
Keywords: PKCζ; T cell maturation; Th1 and Th2 subsets; allergy; cord blood T cells; cytokines.
Conflict of interest statement
The authors declare no conflict of interest.
Figures
Similar articles
-
Characterization of the Transient Deficiency of PKC Isozyme Levels in Immature Cord Blood T Cells and Its Connection to Anti-Allergic Cytokine Profiles of the Matured Cells.Int J Mol Sci. 2021 Nov 23;22(23):12650. doi: 10.3390/ijms222312650. Int J Mol Sci. 2021. PMID: 34884454 Free PMC article.
-
PKCζ activation promotes maturation of cord blood T cells towards a Th1 IFN-γ propensity.Immunology. 2023 Nov;170(3):359-373. doi: 10.1111/imm.13674. Epub 2023 Jun 20. Immunology. 2023. PMID: 37340593
-
Effect of IL-4, IFN-gamma and IL-12 on cytokine production from human CD45RA and CD45RO CD4 T cell precursors.Int Arch Allergy Immunol. 1998 Dec;117(4):255-62. doi: 10.1159/000024020. Int Arch Allergy Immunol. 1998. PMID: 9876227
-
Maturation of human neonatal CD4+ and CD8+ T lymphocytes into Th1/Th2 effectors.Vaccine. 1998 Aug-Sep;16(14-15):1415-9. doi: 10.1016/s0264-410x(98)00101-7. Vaccine. 1998. PMID: 9711781 Review.
-
Role of hormone-controlled T-cell cytokines in the maintenance of pregnancy.Biochem Soc Trans. 2000 Feb;28(2):212-5. doi: 10.1042/bst0280212. Biochem Soc Trans. 2000. PMID: 10816130 Review.
Cited by
-
Black Ginseng Extract Exerts Potentially Anti-Asthmatic Activity by Inhibiting the Protein Kinase Cθ-Mediated IL-4/STAT6 Signaling Pathway.Int J Mol Sci. 2023 Jul 26;24(15):11970. doi: 10.3390/ijms241511970. Int J Mol Sci. 2023. PMID: 37569348 Free PMC article.
-
Protein Kinase C Isozyme Immaturity/Deficiency in Cord Blood Monocytes and Neutrophils.Int J Mol Sci. 2024 Oct 30;25(21):11665. doi: 10.3390/ijms252111665. Int J Mol Sci. 2024. PMID: 39519215 Free PMC article.
-
Characterization of the Transient Deficiency of PKC Isozyme Levels in Immature Cord Blood T Cells and Its Connection to Anti-Allergic Cytokine Profiles of the Matured Cells.Int J Mol Sci. 2021 Nov 23;22(23):12650. doi: 10.3390/ijms222312650. Int J Mol Sci. 2021. PMID: 34884454 Free PMC article.
-
NRF2 Protects against Altered Pulmonary T Cell Differentiation in Neonates Following In Utero Ultrafine Particulate Matter Exposure.Antioxidants (Basel). 2022 Jan 21;11(2):202. doi: 10.3390/antiox11020202. Antioxidants (Basel). 2022. PMID: 35204086 Free PMC article.
-
Editorial of Special Issue "Molecular Mechanisms of Allergy and Asthma".Int J Mol Sci. 2021 Oct 27;22(21):11580. doi: 10.3390/ijms222111580. Int J Mol Sci. 2021. PMID: 34769011 Free PMC article.
References
-
- Chu D.K., Mohammed-Ali Z., Jiménez-Saiz R., Walker T.D., Goncharova S., Llop-Guevara A., Kong J., Gordon M.E., Barra N.G., Gillgrass A.E., et al. T helper cell IL-4 drives intestinal Th2 priming to oral peanut antigen, under the control of OX40L and independent of innate-like lymphocytes. Mucosal. Immunol. 2014;7:1395–1404. doi: 10.1038/mi.2014.29. - DOI - PubMed
MeSH terms
Substances
Grants and funding
LinkOut - more resources
Full Text Sources
