

Mitochondrial Dysfunction in Podocytes Caused by CRIF1 Deficiency Leads to Progressive Albuminuria and Glomerular Sclerosis in Mice
- PMID: 34063207
- PMCID: PMC8124436
- DOI: 10.3390/ijms22094827
Mitochondrial Dysfunction in Podocytes Caused by CRIF1 Deficiency Leads to Progressive Albuminuria and Glomerular Sclerosis in Mice
Abstract
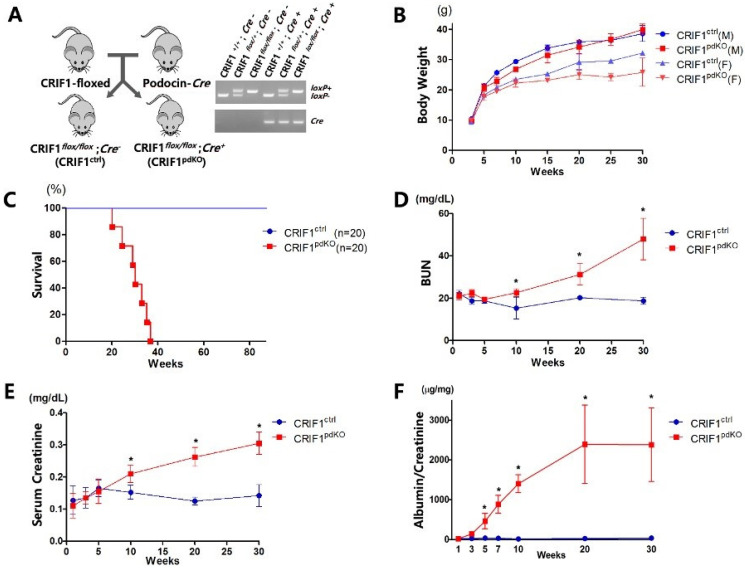
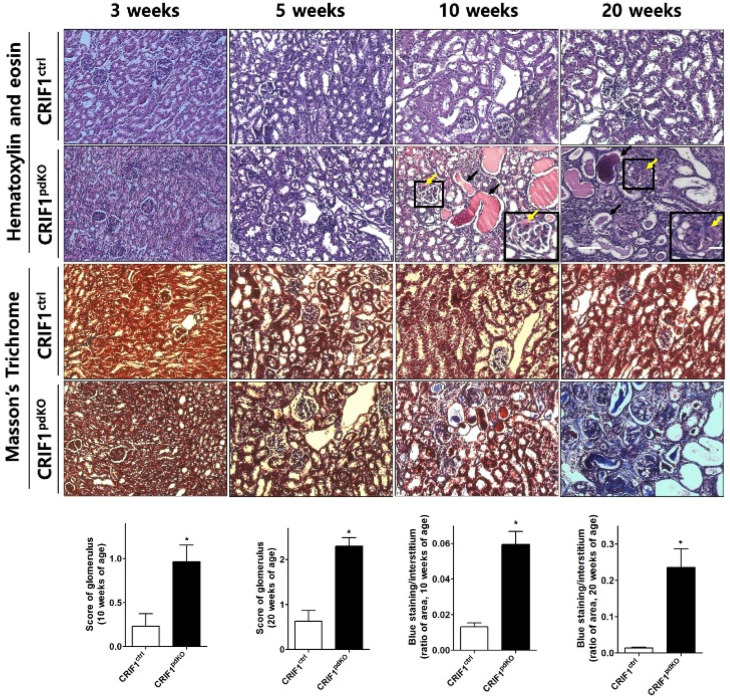
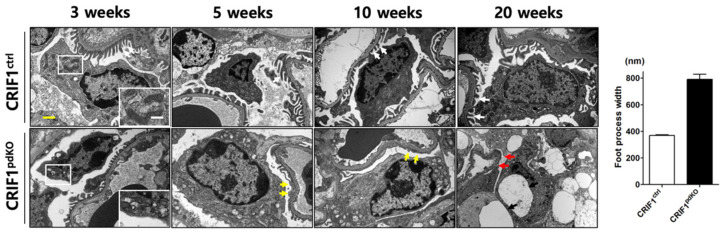
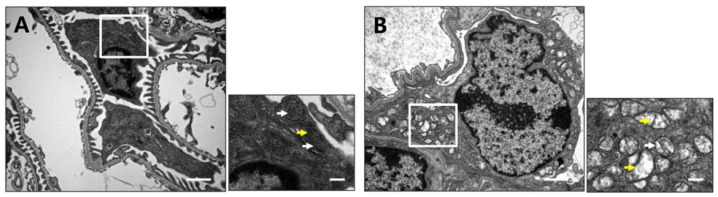
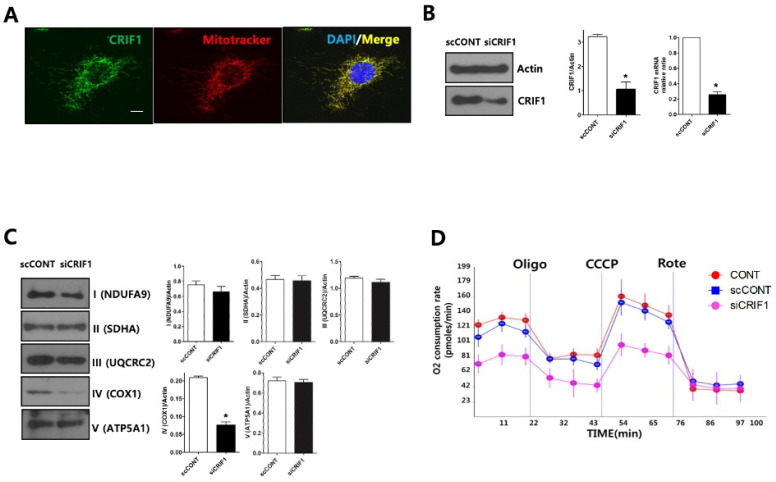
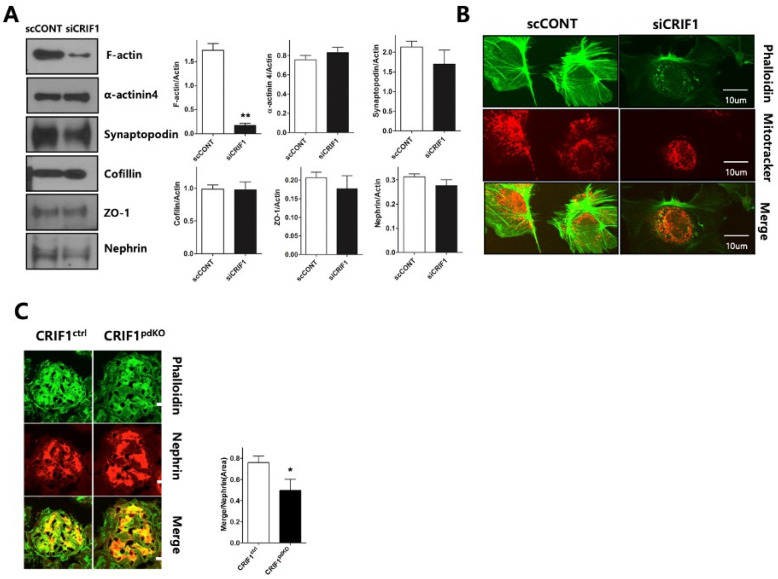
Recent studies have implicated mitochondrial disruption in podocyte dysfunction, which is a characteristic feature of primary and diabetic glomerular diseases. However, the mechanisms by which primary mitochondrial dysfunction in podocytes affects glomerular renal diseases are currently unknown. To investigate the role of mitochondrial oxidative phosphorylation (OxPhos) in podocyte dysfunction, glomerular function was examined in mice carrying a loss of function mutation of the gene encoding CR6-interacting factor-1 (CRIF1), which is essential for intramitochondrial production and the subsequent insertion of OxPhos polypeptides into the inner mitochondrial membrane. Homozygotic deficiency of CRIF1 in podocytes resulted in profound and progressive albuminuria from 3 weeks of age; the CRIF1-deficient mice also developed glomerular and tubulointerstitial lesions by 10 weeks of age. Furthermore, marked glomerular sclerosis and interstitial fibrosis were observed in homozygous CRIF1-deficient mice at 20 weeks of age. In cultured mouse podocytes, loss of CRIF1 resulted in OxPhos dysfunction and marked loss or abnormal aggregation of F-actin. These findings indicate that the OxPhos status determines the integrity of podocytes and their ability to maintain a tight barrier and control albuminuria. Analyses of the glomerular function of the podocyte-specific primary OxPhos dysfunction model mice demonstrate a link between podocyte mitochondrial dysfunction, progressive glomerular sclerosis, and tubulointerstitial diseases.
Keywords: CRIF1; albuminuria; glomerular sclerosis; mitochondrial oxidative phosphorylation; podocyte.
Conflict of interest statement
The authors declare no conflict of interest.
Figures
Similar articles
-
Disruption of CR6-interacting factor-1 (CRIF1) in mouse islet beta cells leads to mitochondrial diabetes with progressive beta cell failure.Diabetologia. 2015 Apr;58(4):771-80. doi: 10.1007/s00125-015-3506-y. Epub 2015 Feb 8. Diabetologia. 2015. PMID: 25660120
-
CRIF1 is essential for the synthesis and insertion of oxidative phosphorylation polypeptides in the mammalian mitochondrial membrane.Cell Metab. 2012 Aug 8;16(2):274-83. doi: 10.1016/j.cmet.2012.06.012. Epub 2012 Jul 19. Cell Metab. 2012. PMID: 22819524
-
RIPK3 causes mitochondrial dysfunction and albuminuria in diabetic podocytopathy through PGAM5-Drp1 signaling.Metabolism. 2024 Oct;159:155982. doi: 10.1016/j.metabol.2024.155982. Epub 2024 Jul 30. Metabolism. 2024. PMID: 39089491
-
The role of the podocyte in albumin filtration.Nat Rev Nephrol. 2013 Jun;9(6):328-36. doi: 10.1038/nrneph.2013.78. Epub 2013 Apr 23. Nat Rev Nephrol. 2013. PMID: 23609563 Review.
-
Glomerular podocytes in diabetic renal disease.Adv Clin Exp Med. 2019 Dec;28(12):1711-1715. doi: 10.17219/acem/104534. Adv Clin Exp Med. 2019. PMID: 31851794 Review.
Cited by
-
Collecting Duct-Specific CR6-Interacting Factor-1-Deletion Aggravates Renal Inflammation and Fibrosis Induced by Unilateral Ureteral Obstruction.Int J Mol Sci. 2021 Oct 28;22(21):11699. doi: 10.3390/ijms222111699. Int J Mol Sci. 2021. PMID: 34769136 Free PMC article.
-
Mitochondrial Contribution to Inflammation in Diabetic Kidney Disease.Cells. 2022 Nov 16;11(22):3635. doi: 10.3390/cells11223635. Cells. 2022. PMID: 36429063 Free PMC article. Review.
-
The Dual Role and Therapeutic Implications of the Wnt/β-Catenin Pathway in Diabetic Kidney Disease.Int J Gen Med. 2025 May 28;18:2757-2768. doi: 10.2147/IJGM.S524138. eCollection 2025. Int J Gen Med. 2025. PMID: 40458228 Free PMC article. Review.
-
Mechanisms of podocyte injury and implications for diabetic nephropathy.Clin Sci (Lond). 2022 Apr 14;136(7):493-520. doi: 10.1042/CS20210625. Clin Sci (Lond). 2022. PMID: 35415751 Free PMC article.
-
BaoShenTongLuo formula protects against podocyte injury by regulating AMPK-mediated mitochondrial biogenesis in diabetic kidney disease.Chin Med. 2023 Mar 26;18(1):32. doi: 10.1186/s13020-023-00738-4. Chin Med. 2023. PMID: 36967383 Free PMC article.
References
-
- Doleris L.M., Hill G.S., Chedin P., Nochy D., Bellanne-Chantelot C., Hanslik T., Bedrossian J., Caillat-Zucman S., Cahen-Varsaux J., Bariety J. Focal segmental glomerulosclerosis associated with mitochondrial cytopathy. Kidney Int. 2000;58:1851–1858. doi: 10.1111/j.1523-1755.2000.00356.x. - DOI - PubMed
MeSH terms
Substances
Grants and funding
LinkOut - more resources
Full Text Sources
Molecular Biology Databases
