. 2021 May 2;14(5):424.
doi: 10.3390/ph14050424.

Microencapsulation of Bacteriophages Using Membrane Emulsification in Different pH-Triggered Controlled Release Formulations for Oral Administration

Affiliations

Microencapsulation of Bacteriophages Using Membrane Emulsification in Different pH-Triggered Controlled Release Formulations for Oral Administration

Kerry Richards et al. Pharmaceuticals (Basel). .

Abstract

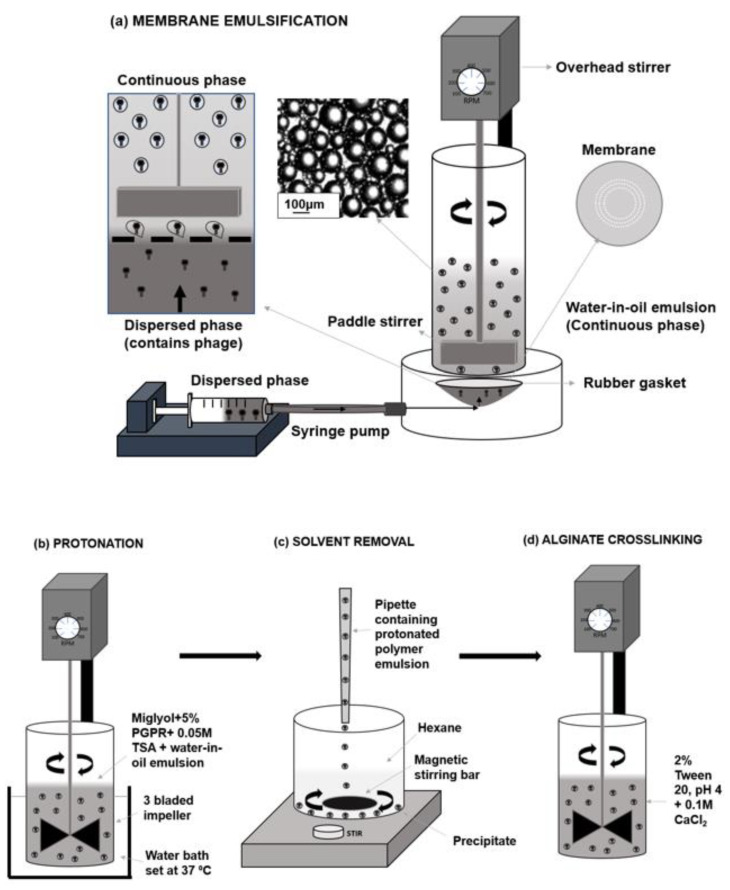
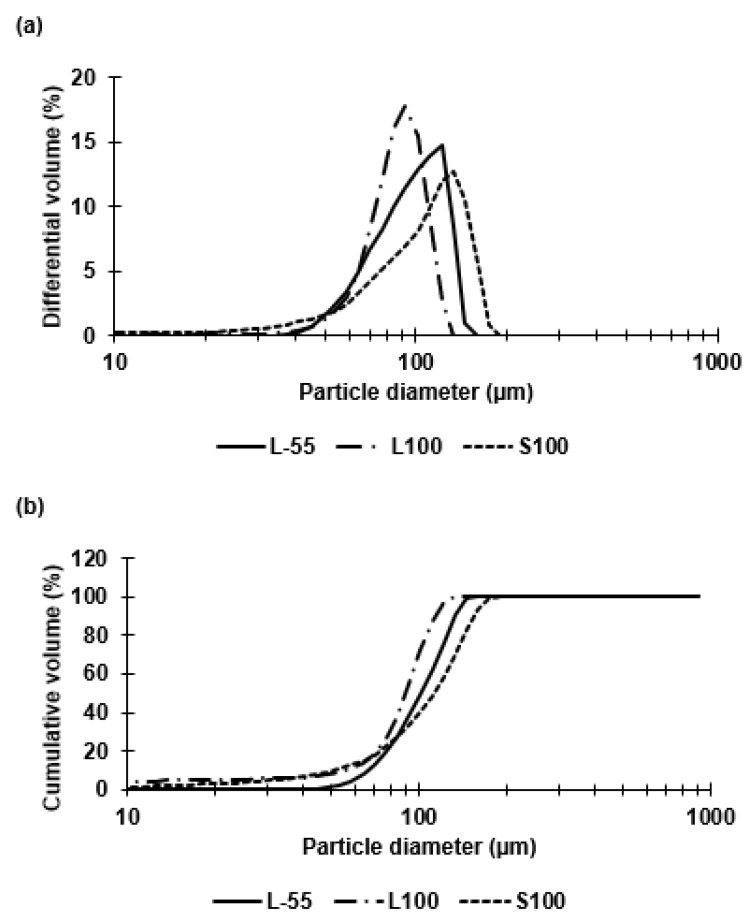
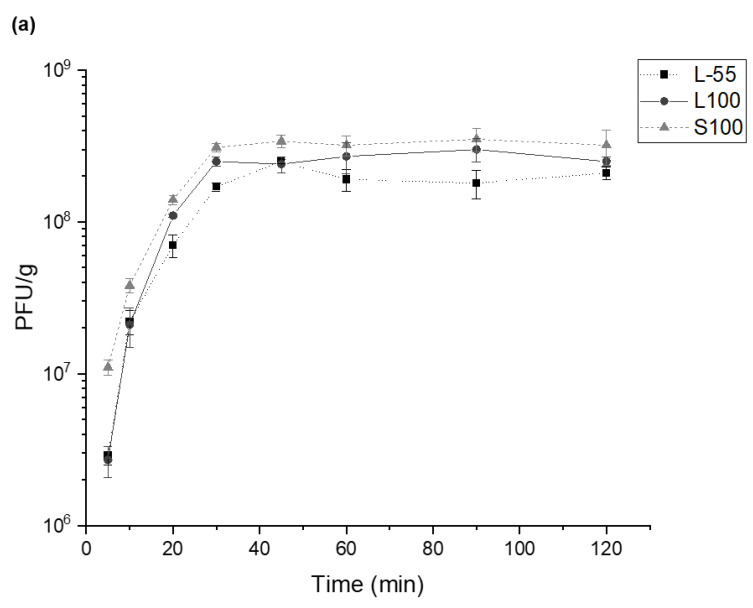
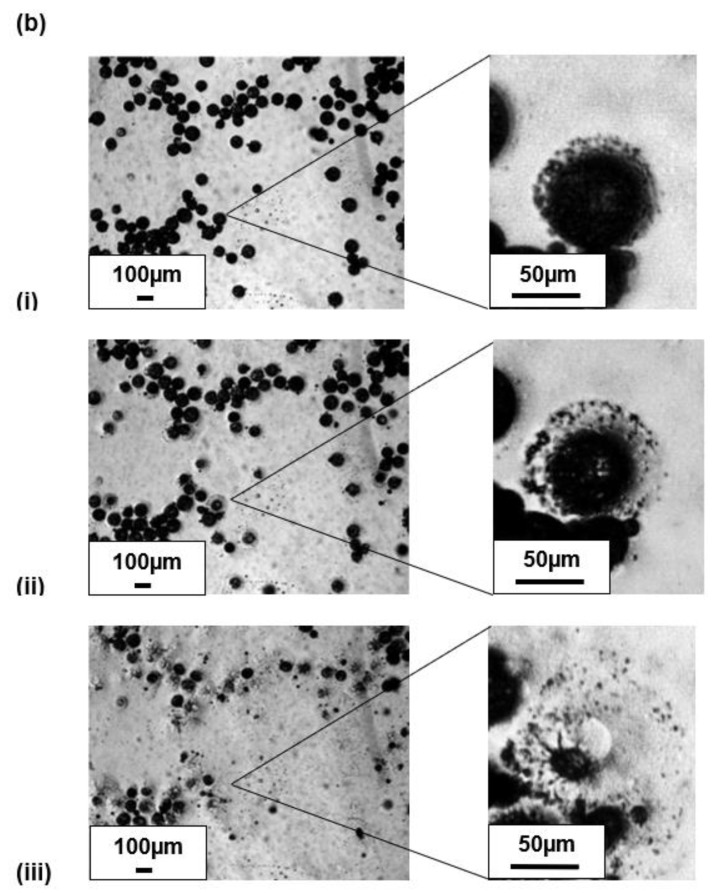
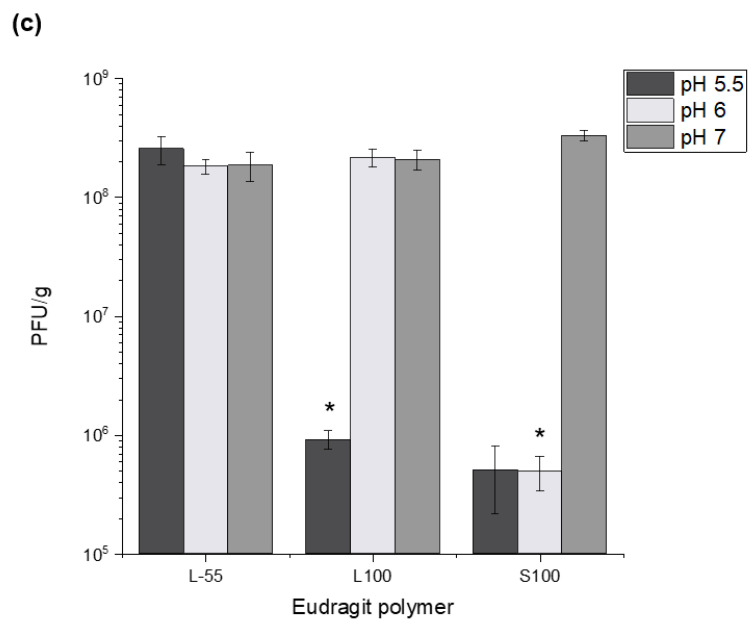
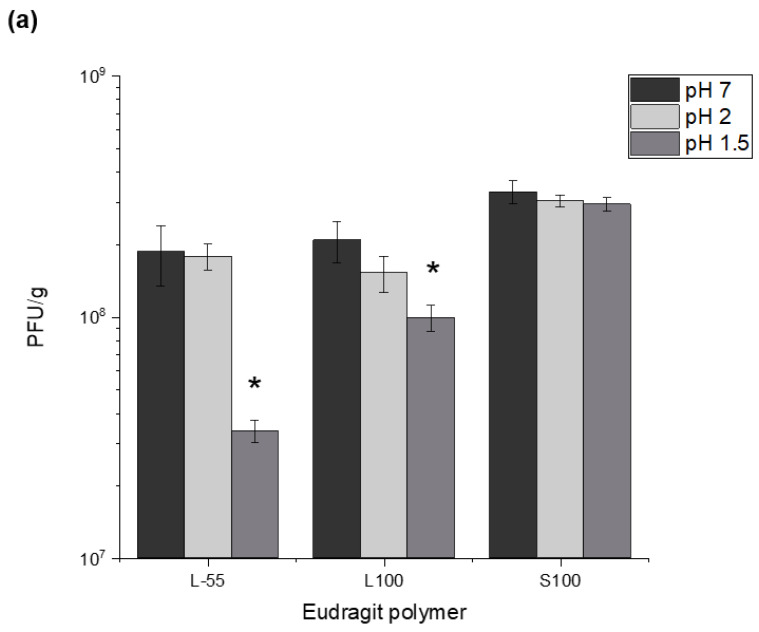
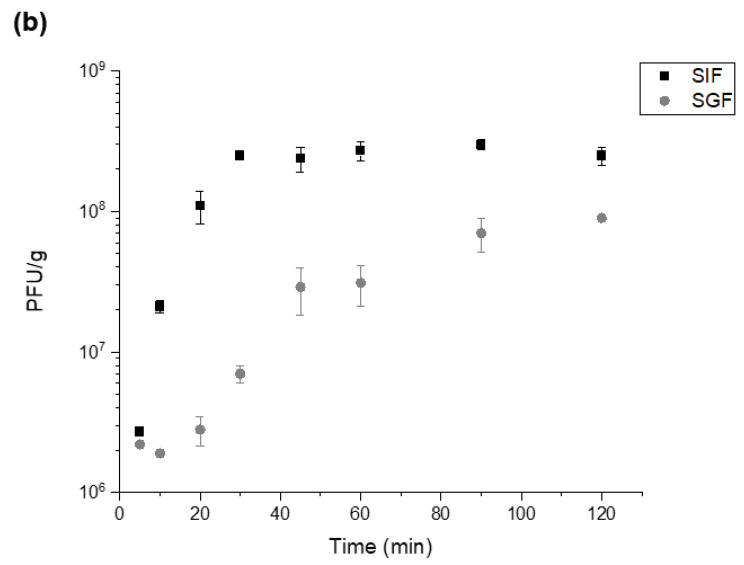
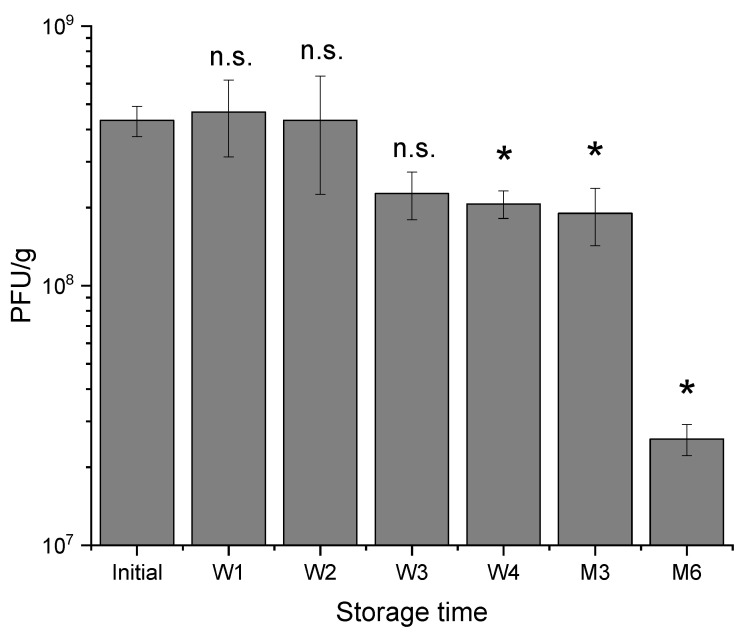
An E.coli-specific phage was encapsulated in three different pH responsive polymer formulations using the process of membrane emulsification. Small 100 µm capsules were fabricated and shown to afford phages suitable acid protection upon exposure to pH 1.5. Selection of polymer formulations allowed controlled release of phages at pH 5.5, pH 6 and pH 7. Other aspects of phage encapsulation including factors affecting encapsulation yield, release kinetics, acid and storage stability were evaluated. The work presented here would be useful for future evaluation of new therapeutic strategies including microbiome editing approaches allowing pH-triggered release of phages and delivery of encapsulated cargo to different intestinal compartments. The size of the capsules were selected to permit ease of delivery using small bore oral gavage tubes typically used in pre-clinical studies for evaluation of drug substances using small animal vertebrate models such as in mice and rats.

Keywords: antibiotic resistance; bacteriophages; drug delivery; membrane emulsification; microbiome engineering; microcapsules.


Conflict of interest statement

The authors declare no conflict of interest.

Figures

Figure 1
Figure 1
Schematic of the capsule production method. (a) The membrane emulsification system—a dispersed phase containing the polymer formulated phage suspension was pumped upwards through membrane pores into a continuous (oil) phase. A paddle stirrer created shear at the membrane surface, forcing droplet detachment. The continuous phase contained PGPR as emulsifier to stabilise droplets after detachment. (b) Polymer precipitation was induced by protonation using TSA—the emulsion was added to a vessel containing the acidified oil to enable capsules to form as all the polymers protonate upon acidification resulting in production of microcapsules. A water bath ensured the protonation reaction temperature was controlled. A 3-bladed impeller was utilised for axial mixing. (c) Solvent removal—TSA protonated capsule suspensions were slowly added into a vessel containing hexane to allow removal of miglyol. A magnetic stirring bar gently agitated the capsules as they collected at the base of the vessel to reduce capsule agglomeration. Hexane/miglyol mixture was subsequently removed and the capsules were recovered. (d) Alginate crosslinking—hexane washed capsules were resuspended in a 2% (v/v) Tween-20 solution (pH adjusted at pH 4) with the addition of CaCl2 (0.1 M final concentration). The alginate in the capsules hardened, forming an insoluble hydrogel matrix resulting in the final microcapsules.
Figure 2
Figure 2
Particle size distributions of droplet diameters for each emulsion, measured using the Coulter LS series. Emulsions produced from Eudragit polymers: L-55, L100 and S100 using a paddle rotation speed of 250 rpm, and a dispersed phase flow rate of 25 mL h−1. The dispersed phase composition was 10% (w/v) Eudragit polymer and 1% (w/v) medium viscosity alginate. The continuous phase composition was Miglyol: castor oil ratio 9:1 with 5 v/v % PGPR. (a) differential volume, (b) cumulative volume.
Figure 3
Figure 3
In vitro phage release data from the three different polymer formulations. (a) Release kinetics of encapsulated phage in polymers L-55, L100 and S100. T3 containing capsules were exposed to simulated intestinal fluid formulated mimicking different gut compartment pH values (L-55: pH 5.5, L100: pH6, S100: pH 7) for 2 h and the released phage titres determined over time using plaque assay method. (b) Microscope images were captured using a ×10 magnification lens and a Phantom C100 high speed camera. S100 capsules were suspended in 2% (v/v) Tween 20 (pH 4) before Sorensen’s buffer (pH 7.5) was added to the sample in situ. Images were captured at 0 s (i), 20 s (ii) and 40 s (iii) to observe capsule dissolution kinetics. (c) The final amount of phage T3 per gram of capsules released upon exposure to solutions with different pH. 0.1 g of capsules were suspended in 1ml SIF and final concentration of phages released was measured after 2 h incubation upon dissolution of capsules. Error bars represent one standard deviation. * Significantly different phage titres using a paired t-test.
Figure 3
Figure 3
In vitro phage release data from the three different polymer formulations. (a) Release kinetics of encapsulated phage in polymers L-55, L100 and S100. T3 containing capsules were exposed to simulated intestinal fluid formulated mimicking different gut compartment pH values (L-55: pH 5.5, L100: pH6, S100: pH 7) for 2 h and the released phage titres determined over time using plaque assay method. (b) Microscope images were captured using a ×10 magnification lens and a Phantom C100 high speed camera. S100 capsules were suspended in 2% (v/v) Tween 20 (pH 4) before Sorensen’s buffer (pH 7.5) was added to the sample in situ. Images were captured at 0 s (i), 20 s (ii) and 40 s (iii) to observe capsule dissolution kinetics. (c) The final amount of phage T3 per gram of capsules released upon exposure to solutions with different pH. 0.1 g of capsules were suspended in 1ml SIF and final concentration of phages released was measured after 2 h incubation upon dissolution of capsules. Error bars represent one standard deviation. * Significantly different phage titres using a paired t-test.
Figure 4
Figure 4
In vitro measurements of acid protection and encapsulated T3 phage release kinetics from microcapsules. (a) concentration of viable T3 phages released from capsules before and after exposure to SGF (pH 1.5 or pH 2). Capsules were exposed to SGF for 2 h. Subsequently, capsules were exposed to SIF (pH 7) and the amount of viable phages released were measured after 2 h at which point the capsules had dissolved completely. (b) Release kinetics of encapsulated phage T3 released from L100 capsules after SGF exposure. Capsules were exposed to SGF (pH 1.5) for 2 h, SGF was subsequently removed. Capsules were then resuspended in SIF and phage concentration measurements were taken over a duration of 2 h. Error bars represent one standard deviation. * Significantly different phage titres using a paired t-test.
Figure 4
Figure 4
In vitro measurements of acid protection and encapsulated T3 phage release kinetics from microcapsules. (a) concentration of viable T3 phages released from capsules before and after exposure to SGF (pH 1.5 or pH 2). Capsules were exposed to SGF for 2 h. Subsequently, capsules were exposed to SIF (pH 7) and the amount of viable phages released were measured after 2 h at which point the capsules had dissolved completely. (b) Release kinetics of encapsulated phage T3 released from L100 capsules after SGF exposure. Capsules were exposed to SGF (pH 1.5) for 2 h, SGF was subsequently removed. Capsules were then resuspended in SIF and phage concentration measurements were taken over a duration of 2 h. Error bars represent one standard deviation. * Significantly different phage titres using a paired t-test.
Figure 5
Figure 5
Phage activity in S100 capsules stored for 6 months at 4–8 °C in the fridge. Capsules were stored after wicking any residual moisture using filter paper. Weekly measurements (measured for the first month) of T3 phage release following dissolution of capsules for 2h in Sorensen’s buffer (pH 7). Measurements were subsequently taken at months 3 and 6. Error bars represent one standard deviation. N.B. No significant difference between phage titres compared to the initial titre using a paired t-test. * Significant values (n = 3), n.s. not significant.
Figure 6
Figure 6
Evaluation of capsule agglomeration during storage under refrigerated conditions (4–8 °C). Size distributions of capsules containing phage T3. Size distribution of capsules were measured immediately after production. Capsules were stored dry (any free liquid removed by pipette). Particle size analysis was carried out weekly for 4 weeks. (a) The particle size analysis is presented as a cumulative volume distribution. The solid line represents data for capsules immediately after production. Dashed line represents data for capsules stored for 4 weeks. (b) Mean particle sizes displayed as bars, ‘solid squares’ represent the coefficient of variation (%).

Similar articles

Cited by

References

    1. Khan M.A. Detection of Colonized Pathogenic Bacteria from Food Handlers in Saudi Arabia. J. Pure Appl. Microbiol. 2018;12:1301–1306. doi: 10.22207/JPAM.12.3.32. - DOI
    1. Croxen M.A., Law R.J., Scholz R., Keeney K.M., Wlodarska M., Finlay B.B. Recent Advances in Understanding Enteric Pathogenic Escherichia coli. Clin. Microbiol. Rev. 2013;26:822–880. doi: 10.1128/CMR.00022-13. - DOI - PMC - PubMed
    1. Amenu D. Antimicrobial Resistance for Enteric Pathogens Isolated from Acute Gastroenteritis Patients. World J. Nat. Appl. Sci. 2014;1:1–14.
    1. Jensen B.H., Olsen K.E.P., Struve C., Krogfelt K.A., Petersen A.M. Epidemiology and Clinical Manifestations of Enteroaggregative Escherichia coli. Clin. Microbiol. Rev. 2014;27:614–630. doi: 10.1128/CMR.00112-13. - DOI - PMC - PubMed
    1. Begum Y.A., Talukder K.A., Azmi I.J., Shahnaij M., Sheikh A., Sharmin S., Svennerholm A.-M., Qadri F. Resistance Pattern and Molecular Characterization of Enterotoxigenic Escherichia coli (ETEC) Strains Isolated in Bangladesh. PLoS ONE. 2016;11:e0157415. doi: 10.1371/journal.pone.0157415. - DOI - PMC - PubMed

LinkOut - more resources