. 2021 May 3;13(9):2195.
doi: 10.3390/cancers13092195.

Enhanced Efficacy of Aurora Kinase Inhibitors in G2/M Checkpoint Deficient TP53 Mutant Uterine Carcinomas Is Linked to the Summation of LKB1-AKT-p53 Interactions

Affiliations

Enhanced Efficacy of Aurora Kinase Inhibitors in G2/M Checkpoint Deficient TP53 Mutant Uterine Carcinomas Is Linked to the Summation of LKB1-AKT-p53 Interactions

Katherine N Lynch et al. Cancers (Basel). .

Abstract

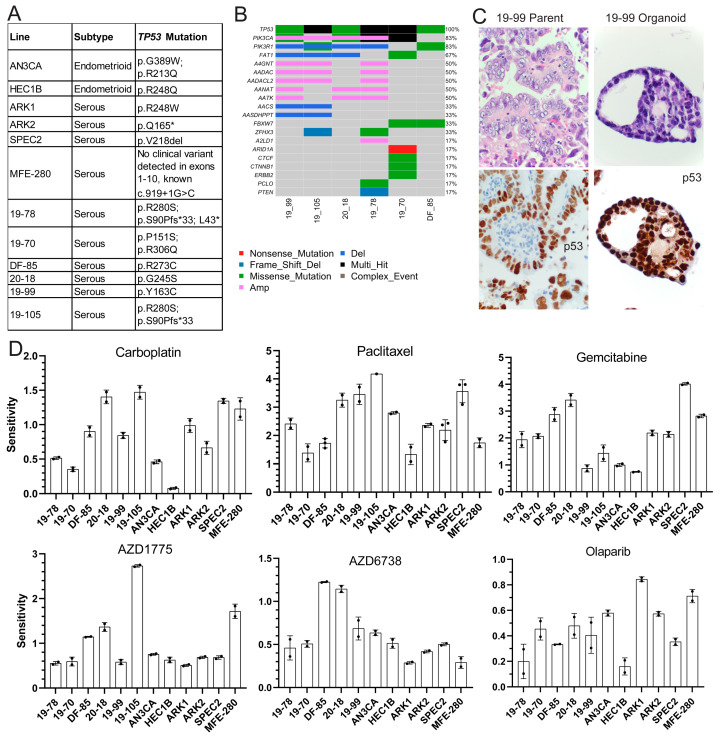
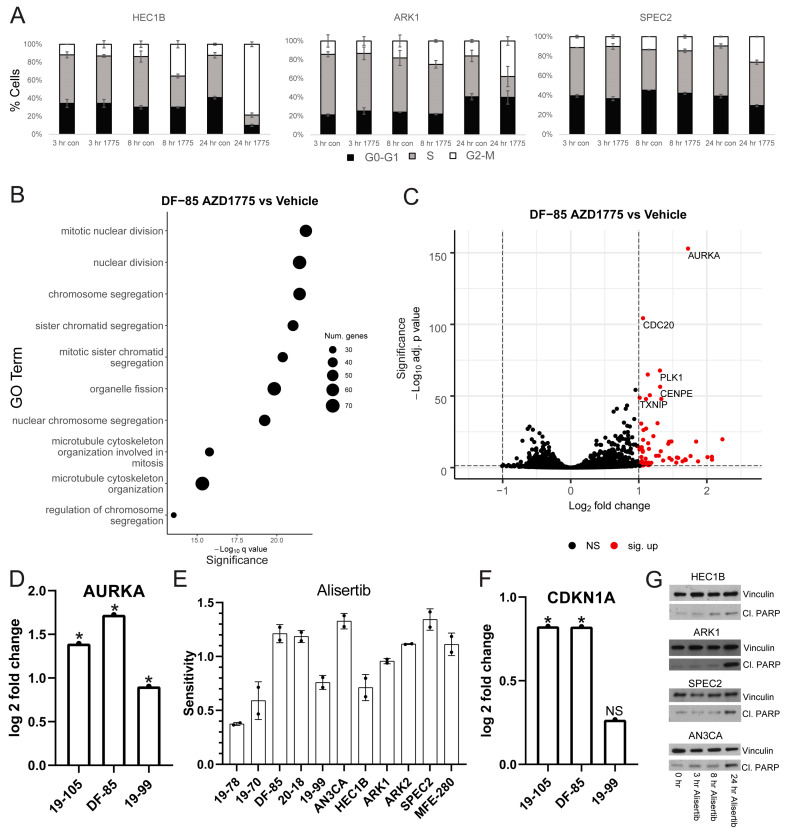
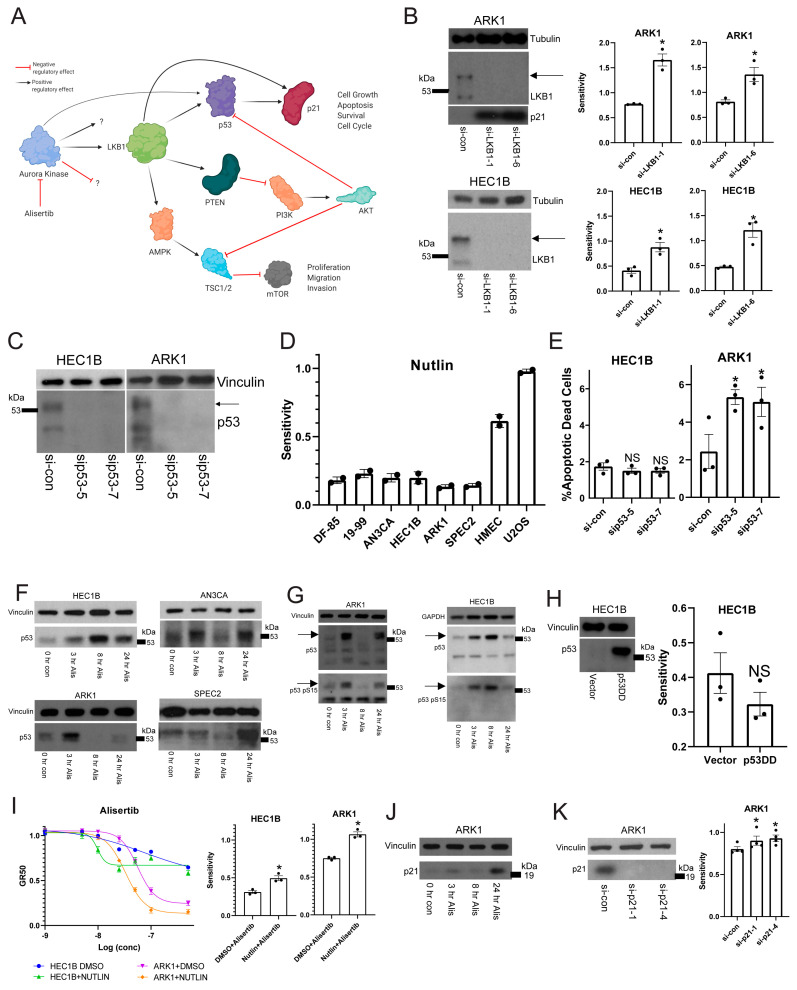
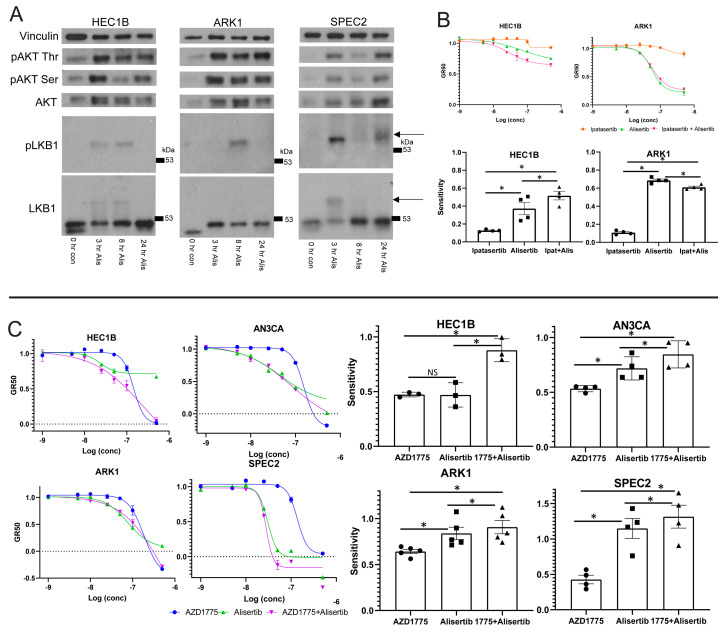
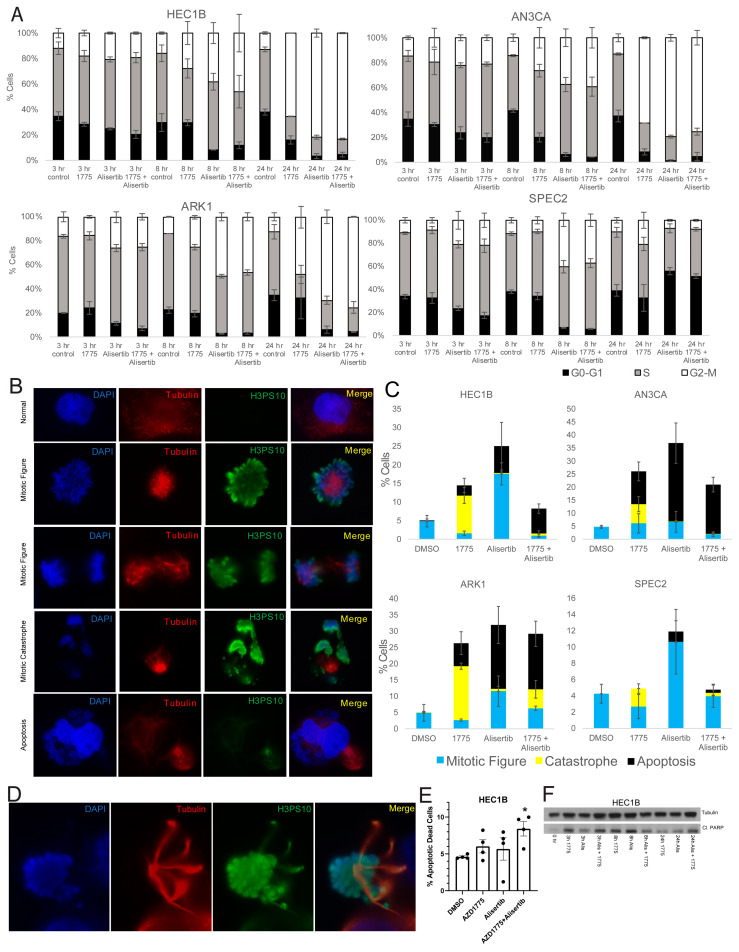
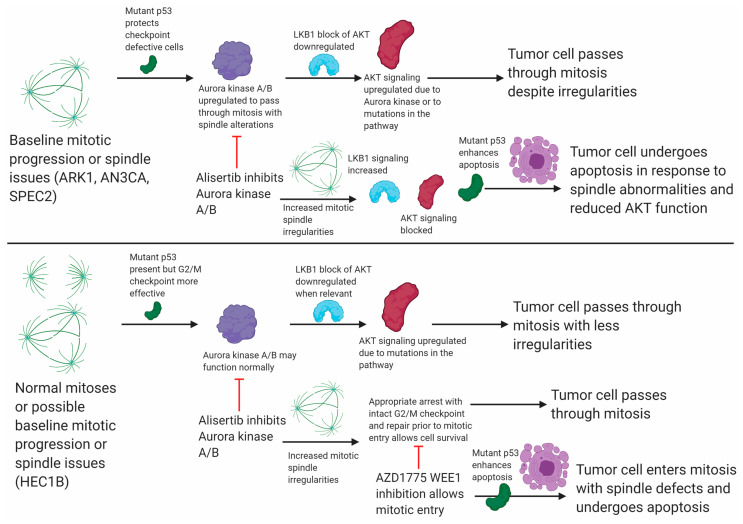
Uterine carcinoma (UC) is the most common gynecologic malignancy in the United States. TP53 mutant UCs cause a disproportionate number of deaths due to limited therapies for these tumors and the lack of mechanistic understanding of their fundamental vulnerabilities. Here we sought to understand the functional and therapeutic relevance of TP53 mutations in UC. We functionally profiled targetable TP53 dependent DNA damage repair and cell cycle control pathways in a panel of TP53 mutant UC cell lines and patient-derived organoids. There were no consistent defects in DNA damage repair pathways. Rather, most models demonstrated dependence on defective G2/M cell cycle checkpoints and subsequent upregulation of Aurora kinase-LKB1-p53-AKT signaling in the setting of baseline mitotic defects. This combination makes them sensitive to Aurora kinase inhibition. Resistant lines demonstrated an intact G2/M checkpoint, and combining Aurora kinase and WEE1 inhibitors, which then push these cells through mitosis with Aurora kinase inhibitor-induced spindle defects, led to apoptosis in these cases. Overall, this work presents Aurora kinase inhibitors alone or in combination with WEE1 inhibitors as relevant mechanism driven therapies for TP53 mutant UCs. Context specific functional assessment of the G2/M checkpoint may serve as a biomarker in identifying Aurora kinase inhibitor sensitive tumors.

Keywords: Aurora kinase; G2/M cell cycle checkpoint; LKB1; p53; uterine cancer.


Conflict of interest statement

U.A.M. is a consultant for Novartis, Merck, and Nextcure, is on the scientific advisory boards for 2X Oncology (unpaid) and the Clearity Foundation, and is an uncompensated advisor for AstraZeneca. S.J.H. receives sponsored research support from Eli Lilly and Company and AstraZeneca not related to this work. B.R.R. is an uncompensated scientific advisory board member for VincenTech. B.R.R. receives sponsored research support from Palleon Pharmaceuticals and Mercy Bioanalytics. Neither is directly related to the current research. J.F.L. is a consultant for Genentech and has participated in advisory boards for AstraZeneca, Clovis, Genentech, Merck, Regeneron Therapeutics, and GlaxoSmithKline, outside the submitted work. J.F.L. reports funding to her institution for study conduct as PI on trials from 2X Oncology, Aravive, Arch Oncology, AstraZeneca, Bristol-Myers Squibb, Clovis Oncology, CytomX Therapeutics, GlaxoSmithKline, Regeneron, Surface Oncology, Tesaro, and Vigeo Therapeutics, outside the submitted work. The remaining authors declare no competing interests.

Figures

Figure 1
Figure 1
TP53 mutant uterine carcinoma models show varying responses to classic and DNA damage repair targeted therapies. (A) Histologic subtype and TP53 mutation status of six cell lines and six patient-derived organoids analyzed in this study. (B) The most common somatic mutations or copy number alterations identified in six organoid models by targeted panel exome and low pass whole genome sequencing are shown here with the gene name on the left, the percent of organoids with the altered gene on the right, and the key to organoid line and alteration type on the bottom. (C) Hematoxylin and eosin stains of matched parent tumor (top left) and organoid (top right) and p53 immunohistochemistry of the same matched parent tumor (bottom left) and organoid (bottom right). Photos were taken at 63X and then cropped to focus on a single organoid or single tumor region. (D) All organoids and cell lines were tested for sensitivity to gemcitabine, AZD6738, Olaparib, AZD1775, carboplatin, and paclitaxel. All lines were growth rate corrected. The sensitivity (area over the growth rate corrected dose curve) is shown here with bars representing the average sensitivity and error bars representing the standard deviation between two to three replicates.
Figure 2
Figure 2
WEE1 inhibition induces significant AURKA upregulation in AZD1775 sensitive uterine carcinoma models, unmasking a strong vulnerability of TP53 mutant uterine carcinomas to Aurora kinase inhibition. (A) BrdU/propidium iodide cell cycle flow cytometry analysis was performed on a subset of cell lines at various timepoints after vehicle (con) or 0.5 uM AZD1775 (1775) treatment. The bars show different phases of the cell cycle (white G2-M, gray S, black G0-G1), and error bars represent standard deviation between two to three replicates. (B) Bulk RNA sequencing analysis of the treated organoids compared to the untreated set revealed significant enrichment for genes related to G2/M after GO overrepresentation analysis. In the graph, GO terms are listed on the Y-axis, circles represent the number of genes in the GO term group, and the X-axis represents increasing significance. (C,D) One of the most significantly upregulated genes in each organoid line post-AZD1775 treatment was AURKA, as shown in the volcano plot for DF-85 treated vs. vehicle in C and the log2 fold change bar graph in each line in D. For the volcano plot in C, p-values of increasing significance are shown on the Y-axis and increasing log2 fold change is shown on the X-axis. A black circle indicates genes with non-significant (NS) change, and a red circle indicates significantly upregulated genes. For the bar graph in D, p-values were generated using an FDR-adjusted Wald test comparing expression in treatment versus control. * p < 0.05. (E) All cell lines and organoids were tested for sensitivity to the dual Aurora A/B kinase inhibitor Alisertib. Each sensitivity curve was run twice, and all lines were growth rate corrected. The sensitivity (area over the growth rate corrected dose curve) is shown here with bars representing the average sensitivity and error bars representing the standard deviation between two replicates. (F) The log2 fold change of AZD1775 treatment compared to control bar graph for CDKN1A expression in each line is shown here. p-values were generated using an FDR-adjusted Wald test comparing expression in treatment versus control. * p < 0.05 and NS = not significant. (G) Four of the cell lines were treated with 0.25 uM Alisertib for 24 h and harvested either at the start of the time course (0 hr) or at varying points over the time course. Western blots were performed on lysates from the cell lines to analyze for the apoptosis marker cleaved PARP and for Vinculin as a control.
Figure 3
Figure 3
Aurora kinase inhibitor cytotoxicity is mediated in part through the function of mutant p53 and LKB1 signaling. (A) A cartoon demonstrating how Aurora kinase is linked to both the p53/p21 and PI3K/AKT arms of LKB1 kinase signaling. (B) ARK1 and HEC1B cells were transfected with either a control siRNA (si-con) or one of two LKB1 specific siRNAs (si-LKB1-1 or si-LKB1-6) and then treated with a dose range of Alisertib. Western blots showing LKB1 depletion, and p21 upregulation in the case of ARK1, are shown on the left. Two bands were detected, and the top band indicated by an arrow represents the phosphorylated form. Sensitivities (area over the growth rate corrected dose curve) are shown on the right for each cell line with each siRNA. Bars represent the average of three replicates, and error bars represent standard error of the mean. p-values were calculated using a paired t-test. * p < 0.05. (C) Western blots demonstrating p53 depletion in HEC1B and ARK1 with two p53 specific siRNAs (sip53-5 and sip53-7) compared to a control. Two isoforms of p53 are detected, but the top isoform running at 53kDa indicated by an arrow here represents the full length p53 changing with treatment in the remaining figures. (D) A representative subset of TP53 mutant uterine cancer cell lines and organoids along with TP53 wild type human mammary epithelial cells (HMEC) and U2OS cells were treated with a dose range of Nutlin and analyzed for survival. All lines were growth rate corrected, and the sensitivity (area over the growth rate corrected dose curve) is shown here for each line. The bars represent the average sensitivity, and error bars represent the standard deviation for two replicates. (E) HEC1B and ARK1 were transfected with two separate p53-specific siRNAs compared to control (si-con) and analyzed for apoptotic dead cells 72 h later. The average percentage of apoptotic dead cells is shown here with error bars representing the standard error of the mean and p-values generated using a t-test for three replicates. * p < 0.05 and NS = not significant. (F) Cell lines were treated with 0.25 uM Alisertib (Alis) over a 24 h period compared to a 0 h control (con), and lysates were prepared at various timepoints and blotted for full length p53 with vinculin as a loading control. (G) Cell lines were treated with 0.25 uM Alisertib (Alis) over a 24 h period compared to a 0 h control (con), and lysates were prepared at various timepoints and stained for p53 phosphorylated on serine 15 (p53 pS15). Loading controls included vinculin, GAPDH, and p53. An arrow indicates the 53kDa molecular weight band that represents full length p53 and is phosphorylated and changing with treatment. (H) HEC1Bs were stably transfected with empty vector or a dominant negative p53 (p53DD) and then treated with a dose range of Alisertib. A western blot for p53 is shown on the left, showing the overexpressed protein correctly running at 53kDa, and the sensitivity (area over the growth rate corrected dose curve) for Alisertib is shown on the right. Bars represent the average of three replicates, and error bars represent the standard error of the mean. p-values were generated using a t-test comparing vector to p53DD. NS = not significant. (I) ARK1 and HEC1B cells were treated with a dose range of Alisertib in combination with either a fixed dose of DMSO or a fixed dose of 5 uM Nutlin. Representative growth rate corrected dose curves are shown on the left with a key to treatments/cell lines on the bottom, and the sensitivity (area over the growth rate corrected dose curve) for both lines is shown on the right. Bars represent the average of three replicates, and error bars represent standard error of the mean. p-values were calculated using a paired t-test comparing vehicle-Alisertib to Nutlin-Alisertib. * p < 0.05. (J) ARK1 cells were tested for p21 upregulation after 0.25 uM Alisertib (Alis) treatment over a 24 h period. An untreated control (con) was harvested at 0 h. p21 expression was studied by western blot over the time course with vinculin as a loading control. (K) ARK1 cells were transfected with either a control siRNA (si-con) or one of two p21 specific siRNAs (si-p21-1 or si-p21-4) and then treated with a dose curve of Alisertib. On the left is a western blot for p21 in the control or p21 depleted cells with vinculin as a loading control. On the right is the sensitivity (area over the growth rate corrected dose curve) for the growth rate corrected dose curves of the cells. Four replicates were performed with each siRNA. Error bars represent the standard error of the mean, and p-values were generated using a t-test comparing si-con to gene specific siRNAs. * p < 0.05.
Figure 4
Figure 4
Combining Aurora kinase and WEE1 kinase inhibitors overcomes Aurora kinase inhibitor resistance. (A) Cell lines were treated with 0.25 uM Alisertib (Alis) over a 24 h period compared to a 0 h untreated control (con), and lysates were prepared from cells harvested at 3, 8, and 24 h post-treatment and analyzed for LKB1 and AKT expression and modification (AKT phosphorylated on Serine 473 (pAKT Ser) or Threonine 308 (pAKT Thr) and LKB1 phosphorylated on Serine 428 (pLKB1)). In the LKB1 and pLKB1 blots, an arrow indicates the higher molecular weight phosphorylated band. (B) An Alisertib resistant (HEC1B) and sensitive (ARK1) cell line was treated with either Alisertib, Ipatasertib, or a combination of Alisertib and Ipatasertib (Ipat + Alis). Representative growth rate corrected dose curves are shown for each line on the left, and sensitivity (area over the growth rate corrected dose curve) is shown on the right for each line with each treatment. Bars represent the average of four replicates, and error bars represent the standard error of the mean. p-values were calculated using both a two-way ANOVA test and a paired t-test comparing different single treatments to the combination or each other. * p < 0.05 for both tests. Comparisons are indicated by a horizontal line over the bars for the treatments being compared (Alisertib vs. Ipatasertib, Alisertib vs. Ipatasertib+Alisertib, and Ipatasertib vs. Ipatasertib+Alisertib). (C) An Alisertib resistant (HEC1B) and three sensitive (ARK1, SPEC2, AN3CA) cell lines were treated with either Alisertib, AZD1775, or a combination of Alisertib and AZD1775. Representative growth rate corrected dose curves are shown for each line on the left, and sensitivity (area over the growth rate corrected dose curve) is shown on the right for each line with each treatment. Bars represent the average of three to five replicates, and error bars represent standard error of the mean. p-values were calculated using both a two-way ANOVA test and a paired t-test comparing different single treatments to the combination or each other. * p < 0.05 for both tests. Comparisons are indicated by a horizontal line over the bars for the treatments being compared (Alisertib vs. AZD1775, Alisertib vs. AZD1775+Alisertib, and AZD1775 vs. AZD1775+ Alisertib).
Figure 5
Figure 5
Combining Aurora kinase and WEE1 inhibitors causes increased apoptotic death in Aurora kinase inhibitor resistant cells. (A) Cell lines were treated with vehicle (control) or either 0.25 uM Alisertib, 0.5 uM AZD1775 (1775), or a combination of Alisertib+AZD1775 and harvested at 3, 8, and 24 h post treatment for BrdU cell cycle flow cytometry analysis. Bar graphs showing the percentage of cells in G0-G1 (Black), S (Gray), and G2/M (White) at each timepoint after each treatment are shown here. Error bars represent standard deviation between two to three replicates. (B,C) Cell lines were treated with vehicle (DMSO) or either 0.25 uM Alisertib, 0.5 uM AZD1775 (1775), or a combination of Alisertib and AZD1775 and harvested at 24 h for immunofluorescence analysis of mitosis and apoptosis. Cells were stained for H3pS10 to mark mitosis, tubulin to mark spindles, and DAPI to mark nuclei. Representative images of each cell type or phase counted are shown on the left in B, and bar graphs of the counts are shown on the right in C. For the images, photos were taken at 63X and then cropped to focus on a group of cells. Normal or Alisertib altered mitotic figures (blue), mitotic catastrophes (yellow) and apoptotic blebbing cells (black) were counted per at least 100 nuclei for each treatment. Bars represent averages of three replicates, and error bars represent standard deviation. (D) A representative altered mitotic figure with abnormal spindles is shown here for Alisertib treated HEC1B cells at 24 h, which were counted in C. For the image, a photo was taken at 100X and then cropped to focus on the single mitotic figure. (E) HEC1B cells were treated with vehicle (DMSO) or either 0.25 uM Alisertib, 0.5 uM AZD1775, or a combination of Alisertib and AZD1775 and harvested 24 h post-treatment for apoptosis flow using Apotracker. The percentage of dead apoptotic cells for each treatment is shown for four replicates. Bars represent averages of four replicates, and error bars represent standard error of the mean. t-tests were used to calculate p-values, and a * above a bar indicates significance compared to the DMSO control. * p < 0.05. (F) HEC1B were treated with nothing (0 hr) or either 0.25 uM Alisertib (Alis), 0.5 uM AZD1775 (1775), or a combination of Alisertib+AZD1775, harvested at various times post-treatment, and analyzed by western blot for cleaved PARP and tubulin as a control.
Figure 6
Figure 6
Aurora kinase signaling is an effective target in TP53 mutant uterine carcinomas with G2/M checkpoint dysfunction. Illustration of Alisertib effects on cells with or without functional G2/M checkpoints and how the addition of AZD1775 helps increase Alisertib efficacy.

Similar articles

Cited by

References

    1. Zhang L., Kwan S.Y., Wong K.K., Solaman P.T., Lu K.H., Mok S.C. Pathogenesis and Clinical Management of Uterine Serous Carcinoma. Cancers. 2020;12:686. doi: 10.3390/cancers12030686. - DOI - PMC - PubMed
    1. Arend R.C., Jones B.A., Martinez A., Goodfellow P. Endometrial cancer: Molecular markers and management of advanced stage disease. Gynecol. Oncol. 2018;150:569–580. doi: 10.1016/j.ygyno.2018.05.015. - DOI - PubMed
    1. Hamilton C.A., Pothuri B., Arend R.C., Backes F.J., Gehrig P.A., Soliman P.T., Thompson J.S., Urban R.R., Burke W.M. Endometrial cancer: A society of gynecologic oncology evidence-based review and recommendations, part II. Gynecol. Oncol. 2021;160:827–834. doi: 10.1016/j.ygyno.2020.12.024. - DOI - PubMed
    1. Cancer Genome Atlas Research Network. Kandoth C., Schultz N., Cherniack A.D., Akbani R., Liu Y., Shen H., Robertson A.G., Pashtan I., Shen R., et al. Integrated genomic characterization of endometrial carcinoma. Nature. 2013;497:67–73. doi: 10.1038/nature12113. - DOI - PMC - PubMed
    1. Musacchio L., Boccia S.M., Caruso G., Santangelo G., Fischetti M., Tomao F., Perniola G., Palaia I., Muzii L., Pignata S., et al. Immune Checkpoint Inhibitors: A Promising Choice for Endometrial Cancer Patients? J. Clin. Med. 2020;9:1721. doi: 10.3390/jcm9061721. - DOI - PMC - PubMed