. 2021 May 3;11(5):688.
doi: 10.3390/biom11050688.

Molecular Targets and Biological Functions of cAMP Signaling in Arabidopsis

Affiliations

Molecular Targets and Biological Functions of cAMP Signaling in Arabidopsis

Ruqiang Xu et al. Biomolecules. .

Abstract

Cyclic AMP (cAMP) is a pivotal signaling molecule existing in almost all living organisms. However, the mechanism of cAMP signaling in plants remains very poorly understood. Here, we employ the engineered activity of soluble adenylate cyclase to induce cellular cAMP elevation in Arabidopsis thaliana plants and identify 427 cAMP-responsive genes (CRGs) through RNA-seq analysis. Induction of cellular cAMP elevation inhibits seed germination, disturbs phytohormone contents, promotes leaf senescence, impairs ethylene response, and compromises salt stress tolerance and pathogen resistance. A set of 62 transcription factors are among the CRGs, supporting a prominent role of cAMP in transcriptional regulation. The CRGs are significantly overrepresented in the pathways of plant hormone signal transduction, MAPK signaling, and diterpenoid biosynthesis, but they are also implicated in lipid, sugar, K+, nitrate signaling, and beyond. Our results provide a basic framework of cAMP signaling for the community to explore. The regulatory roles of cAMP signaling in plant plasticity are discussed.

Keywords: Arabidopsis thaliana; adenylate cyclase; cyclic AMP; function; mechanism; regulation; signaling.


Conflict of interest statement

The authors declare no conflict of interest.

Figures

Figure 1
Figure 1
Generation of inducible AC transgenic plants mediating cAMP elevation. (A) Verification of AC transgenic plants. The pTA7001-AC construct was transformed into Arabidopsis thaliana wild type (WT) Col-0 background to obtain transgenic plants homozygous for a single copy of AC transgene. PCR products from genomic DNA samples of three individual transgenic lines (lanes 2–4) showed a band of 319 bp corresponding to the AC transgene and a band of 882 bp corresponding to AtKUP7, and only the band of 882 bp appeared in WT plants (lanes 5–6) and no amplification in the non-template control (lane 1). (B) Inducible expression of AC transgene examined by qRT-PCR in rosette leave samples of four-week-old WT and AC transgenic plants at different times (0, 3, 6, 12, and 24 h) after spraying dexamethasone (DEX). (C) Inducible expression of AC transgene examined by qRT-PCR in different tissue (R: roots; S: stems; L: rosette leaves; F: flowers; Si: siliques) samples of six-week-old WT and AC transgenic plants at 0 and 24 h after spraying DEX. (D) Inducible elevation of cellular cAMP contents in the above-ground tissue samples of three-week-old WT and AC transgenic plants at different times (0 h, 3 h, 12 h, 24 h, 3 d, 5 d, and 7 d) after spraying DEX. Data are Ave ± SD (n = 3) in (B,C), and Ave ± SE (n = 3) in (D), * p < 0.05, ** p < 0.01, and *** p < 0.001 with Fisher’s LSD test following ANOVA.
Figure 2
Figure 2
Identification of cAMP-responsive genes (CRGs). (A) Principal component analysis (PCA) of transcriptome changes associated with induction of cAMP elevation using FPKMs data derived from RNA-seq of six-week-old AC transgenic plants at 24 h (labeled as LD) and 0 h (LB) after spraying dexamethasone (DEX), each with three biological replicates. (B) Scatter plot showing the relationship between magnitude of gene expression in a comparison of LD and LB. CRGs (Supplementary Data S1) were identified by differentially expressed genes (DEGs) at the threshold of an absolute value of log2 (fold change) > 1 and a false discovery rate (FDR) < 0.05. (C) Verification of RNA-seq data. Relative expression levels of 10 randomly selected CRGs by qRT-PCR were compared to their FPKMs by RNA-seq. (D) Correlation between the results of qRT-PCR and RNA-seq as shown in (C).
Figure 3
Figure 3
Functional characteristics of cAMP-responsive genes (CRGs). (A) Bar plot showing the functional terms of Biological Process by Gene Ontology (GO; Supplementary Data S2) analysis with CRGs (Supplementary Data S1). (B) Bar plot showing the functional terms of molecular function by GO analysis with CRGs. (C) Bar plot showing the functional terms of the cellular component by GO analysis with CRGs. In (A) to (C), GO terms in red indicate significant enrichment at the false discovery rate (FDR) < 0.05. Shown are the number of CRGs associated with the given GO term on the top of each bar and its percentage among the CRGs on the top of each bar plot.
Figure 4
Figure 4
Functional comparison between up- and down-regulated cAMP-responsive genes (CRGs). (A) Enrichment map of up-regulated CRGs (Supplementary Data S1). The significantly enriched Gene Ontology (GO) functional terms (Supplementary Data S3) were depicted as a network with the node size, node color, and edge width corresponding to the number of genes assigned to the given term, the false discovery rate (FDR) (smaller value in darker color), and the number of overlapped genes between the two connected terms, respectively. (B) Enrichment map of down-regulated CRGs (Supplementary Data S1). See description for (A). (C) Over-representation analysis of transcription factor (TF) families in the CRGs. Fisher’s exact test was performed to determine p-values for the significance of difference.
Figure 5
Figure 5
Biological pathways of cAMP-responsive genes (CRGs). (A) Bar plot showing enriched KEGG (Kyoto Encyclopedia of Genes and Genomes) pathways of CRGs (Supplementary Data S1 and S4) at the cutoff of hypergeometric test p ≤ 0.05. Red bars indicate significant enrichment at the false discovery rate (FDR) < 0.05. Shown on the top of each bar is the count of CRGs with KEGG IDs. (B) Network representation of the significantly enriched KEGG pathways (yellow circular nodes) of CRGs (grey circular nodes; gene IDs in blue) showing relationships among them. (C) CRGs mapping of plant hormone signal transduction pathway (KEGG: ath04075). (D) CRGs mapping of plant MAPK signaling pathway (KEGG: ath04016). In (C,D), genes highlighted by yellow color in the pathways are pointed out by the associated CRGs in a rectangle box of dotted lines, and the red and blue triangles following the CRGs indicate up- and down-regulation, respectively. Shown in (C) are also the CRGs related to the biosynthesis of hormones (left side of double vertical line).
Figure 6
Figure 6
GSEA plots of representative cAMP-responsive gene sets. (A) Intracellular signal transduction (GO: 0035556). (B) Phenylalanine, tyrosine, and tryptophan biosynthesis (KEGG: ko00400). GSEA: Gene Set Enrichment Analysis; NES: normalized enrichment score; p-value: nominal p-value of the enrichment score (ES); leading edge subset: the core subset genes that contribute most to the enrichment result. The red dotted line marks the position of maximum enrichment score occurred. GO: Gene Ontology; KEGG: Kyoto Encyclopedia of Genes and Genomes.
Figure 7
Figure 7
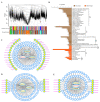
Co-expression networks and hub genes associated with endogenous cAMP elevation in plants. (A) Hierarchical clustering tree of RNA-seq expression data set (as shown in Figure 2B) generated by WGCNA [75]. Each leaf in the tree represents one gene, and the major tree branches constitute 35 modules (Supplementary Table S3) labeled by the colored panel beneath the dendrogram. (B) Bar plot showing the significantly enriched GO (Gene Ontology) terms and KEGG (Kyoto Encyclopedia of Genes and Genomes) pathways (Supplementary Data S6) in the co-expression modules of “chocolate1” (indicated by brown bars) and “Darkorange2” (red bars) at the threshold of false discovery rate (FDR) < 0.05. The KEGG pathway is marked in bold. BP: biological processes; MF: molecular functions; CC: cellular components. (C) Network representation of the co-expression module “chocolate1”. (D) Network representation of the co-expression module “darkorange2”. (E) Network representation of the co-expression module “cornflowerblue”. In (C) to (E), for an easy visualization, only the top 10% of genes with highest KME in each module (Supplementary Data S7) were used to construct the networks using Cytoscape [76]. Hub genes are determined with at least four depicted connections in the network and positioned in the central part by oval nodes, and other genes are denoted by circular nodes. Gene IDs in pink indicate the cAMP-responsive gens (CRGs).
Figure 8
Figure 8
Phenotypic effects of cellular cAMP elevation in plants. (A) Inhibition of seed germination. Seeds obtained from AC transgenic plants were germinated with dexamethasone treatment (pTA7001-AC: DEX) or no treatment (pTA7001-AC), compared to wild type (WT) control. (B) Pre-mature leaf senescence. Left panel: 12-day-old AC transgenic seedlings were thoroughly sprayed with DEX (T) or mock control (C) and photographed 10 days later. Right panel: 16-day-old seedlings were treated as described in the left panel, except the spray repeated once in the other day and a non-spraying control (C-ns) and photographed 19 days later. Arrows point to representative symptoms of yellowing at the leaf tips. (C) Altered levels of phytohormones. The contents of phytohormones were measured in 18-day-old AC transgenic seedlings at 0 h (C) and 24 h (T) after spraying DEX. Data are Ave ± SD (n = 3), two-tailed Student’s t-test ** p < 0.01, and *** p < 0.001. (D) Compromised resistance to bacterial infection. Four- to five-week-old AC transgenic plants were inoculated with Pst DC3000. Left panel: a representative photograph taken five days after inoculation, showing more severe infection symptoms with DEX treatment (T) versus mock control (C). Right panel: determination of bacterial growth in leaves 10 days after inoculation. Data are Ave ± SE from three separate experiments indicated by different colors in the figure. (E) Compromised resistance to fungal infection. Detached leaves from 34-day-old AC transgenic plants were inoculated with V. dahliae strain Vd991 under conditions of DEX treatment (T) or mock control (C), and the relative fungal biomass was determined 10 days after inoculation. Data are Ave ± SD (n = 3), two-tailed Student’s t-test *** p < 0.001. (F) Compromised resistance to salt stress. 12-day-old AC transgenic seedlings were transplanted to growth medium containing DEX (T) or mock control (C) with the addition of 100 mM NaCl (bottom panels) or not (upper panels), photograph taken 20 days later. (G) Increased sensitivity to ethylene. As performed in (F), except the treatment of 100 µM ACC (1-aminocyclopropane-1-carboxylate), photographs of the shoots (left panels) and roots (right panels) were taken 20 days later.

Similar articles

Cited by

References

    1. Sutherland E.W. Studies on the mechanism of hormone action. Science. 1972;177:401–408. doi: 10.1126/science.177.4047.401. - DOI - PubMed
    1. Biswas A., Bhattacharya A., Das P.K. Role of cAMP Signaling in the survival and infectivity of the protozoan parasite, Leishmania donovani. Mol. Biol. Int. 2011;2011:782971. doi: 10.4061/2011/782971. - DOI - PMC - PubMed
    1. Bahn Y.S., Molenda M., Staab J.F., Lyman C.A., Gordon L.J., Sundstrom P. Genome-wide transcriptional profiling of the cyclic AMP-dependent signaling pathway during morphogenic transitions of Candida albicans. Eukaryot. Cell. 2007;6:2376–2390. doi: 10.1128/EC.00318-07. - DOI - PMC - PubMed
    1. Bretschneider T., Vasiev B., Weijer C.J. A model for dictyostelium slug movement. J. Theor. Biol. 1999;199:125–136. doi: 10.1006/jtbi.1999.0944. - DOI - PubMed
    1. Botsford J.L., Harman J.G. Cyclic AMP in prokaryotes. Microbiol. Rev. 1992;56:100–122. doi: 10.1128/MR.56.1.100-122.1992. - DOI - PMC - PubMed

Publication types

MeSH terms

LinkOut - more resources