. 2021 May 21;26(11):3064.
doi: 10.3390/molecules26113064.

A 1-Hydroxy-2,4-Diformylnaphthalene-Based Fluorescent Probe and Its Detection of Sulfites/Bisulfite

Affiliations

A 1-Hydroxy-2,4-Diformylnaphthalene-Based Fluorescent Probe and Its Detection of Sulfites/Bisulfite

Qing Shi et al. Molecules. .

Abstract

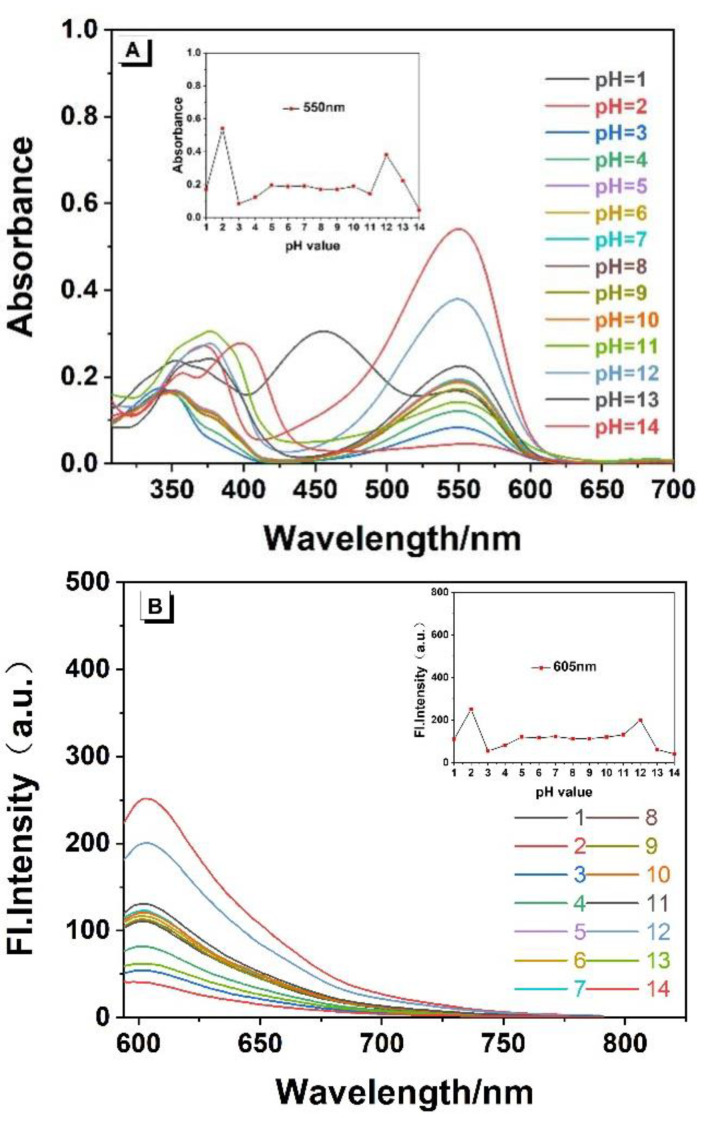
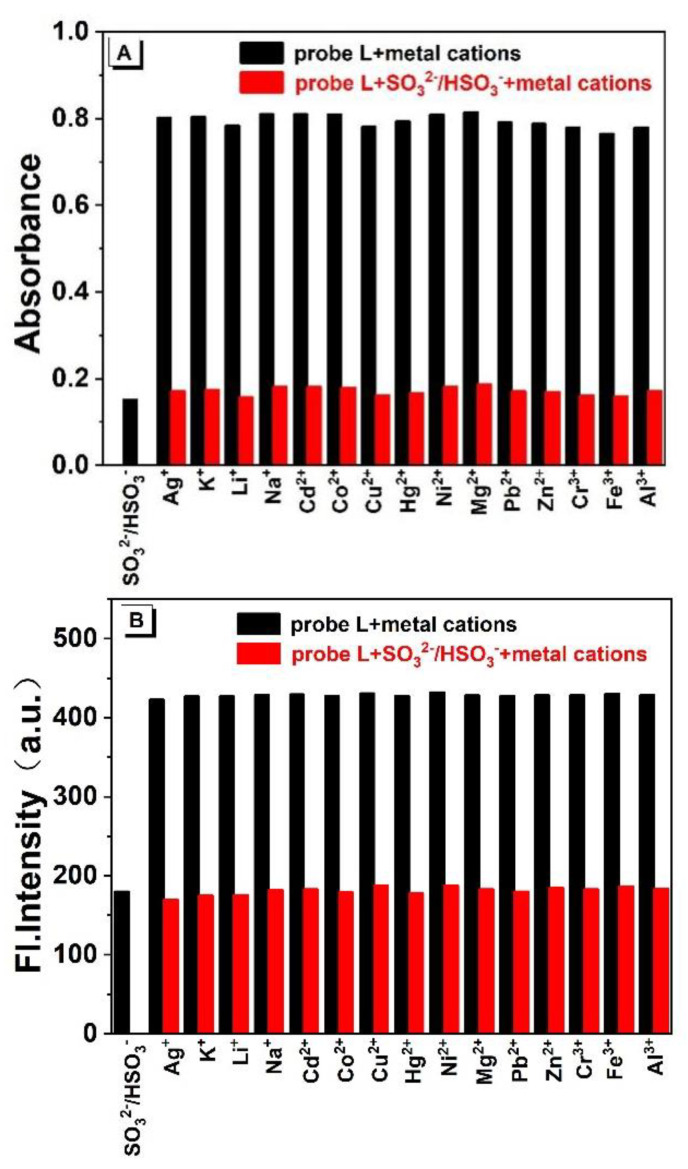
A novel 1-hydroxy-2,4-diformylnaphthalene-based fluorescent probe L was synthesized by a Knoevenagel reaction and exhibited excellent sensitivity and selectivity towards sulfite ions (SO32-) and bisulfite ions (HSO3-). The detection limits of the probe L were 0.24 μM using UV-Vis spectroscopy and 9.93 nM using fluorescence spectroscopy, respectively. Furthermore, the fluorescent probe L could be utilized for detection in real water samples with satisfactory recoveries in the range 99.20%~104.30% in lake water and 100.00%~104.80% in tap water by UV-Vis absorption spectrometry, and in the range 100.50%~108.60% in lake water and 102.70%~103.80% in tap water by fluorescence spectrophotometry.

Keywords: crystal structure; fluorescent probe; real sample detection; sulfite/bisulfite.


Conflict of interest statement

The authors declare no conflict of interest.

Figures

Scheme 1
Scheme 1
Synthetic route to probe L.
Figure 1
Figure 1
(A) The UV-Vis and (B) fluorescence spectra of the fluorescence probe L (15 μM) in EtOH/water mixtures with different water fractions (λexem = 576 nm/605 nm, slit: 5/5 nm, voltage: 800 v). (C) Photographs in EtOH/water mixtures with different water fractions taken under 365 nm UV irradiation. Inset of (B): Plots of fluorescence intensity at 605 nm.
Figure 2
Figure 2
(A) The UV-Vis and (B) Fluorescence spectra of the fluorescence probe L (15 μM) in EtOH/water (VEtOH/Vwater = 2/3) at different pH values (λexem = 576 nm/605 nm, slit: 5/5 nm, voltage: 800 v). Inset: (A) Effect of different pH values on the absorbance of probe L at 550 nm. (B) Influence of pH values on fluorescence probe L at 605 nm.
Figure 3
Figure 3
(A) The UV-Vis and (B) fluorescence spectra of the fluorescence probe L (15 μM) in EtOH/water (VEtOH/Vwater = 2/3) with the addition of SO32−/HSO3 (750 μM) at different pH values (λexem = 576 nm/605 nm, slit: 5/5 nm, voltage: 600 v). Inset: (A) Effect of different pH values on the absorbance of probe L with the addition of SO32−/HSO3 at 550 nm. (B) Influence of pH values on fluorescence probe L with the addition of SO32−/HSO3 at 605 nm.
Figure 4
Figure 4
(A) The UV-Vis and (B) fluorescence spectra of the fluorescence probe L interacting with different anions and small amino-containing molecules (λexem = 576/605 nm, slit: 5/5 nm, voltage: 600 v).
Figure 5
Figure 5
Bar diagram of the competitive experiments of various anions and small amino-containing molecules on the absorbance (A) and fluorescence intensity (B) of the probe/SO32−/HSO3 complex in buffer solution.
Figure 6
Figure 6
Bar diagram of the competitive experiments of various metal cations on the absorbance (A) and fluorescence intensity (B) of the probe/SO32−/HSO3 complex in buffer solution.
Figure 7
Figure 7
(A) UV-Vis absorption spectra on the addition of SO32−/HSO3 to the probe; (B) linear curve of absorbance of probe solution at 550 nm and concentration of SO32−/HSO3 (30 μM–300 μM). Inset: Curve of absorbance at 550 nm with different concentrations of SO32−/HSO3; photograph of the solutions under illumination with sunlight showing the change in the solution after the titration is complete.
Figure 8
Figure 8
(A) Fluorescence spectra on addition of SO32−/HSO3 to the probe; (B) linear curve of fluorescence intensity of probe solution at λmax em = 605 nm and concentration of SO32−/HSO3 (15 μM–300 μM). Inset: Curve of fluorescence intensity at λmax em = 605 nm with different concentrations of SO32−/HSO3; photograph of the fluorescence change under the irradiation of 365 nm UV lamp after the titration is complete.
Figure 9
Figure 9
The single crystal X-ray diffraction image of probe L.
Figure 10
Figure 10
Proposed sensing mechanism of probe L for SO32−/HSO3.
Figure 11
Figure 11
High resolution mass spectra (HRMS) of the reaction product of probe L upon the addition of SO32−/HSO3.

References

    1. Li J. Study on Separation of Anions by Capillary Electrophoresis and Its Application in Food Analysis. Zhejiang Gongshang University; Hangzhou, China: 2012.
    1. Dong Y.Q., Lam J.W.Y., Qin A., Zhen L., Liu J., Sun J., Dong Y., Tang B.Z. Endowing hexaphenylsilole with chemical sensory and biological probing properties by attaching amino pendants to the silolyl core. Chem. Phys. Lett. 2007;446:124–127. doi: 10.1016/j.cplett.2007.08.030. - DOI
    1. Wang M., Zhang D.Q., Zhang G.X., Tang Y.L., Wang S., Zhu D.B. Fluorescence turn-on detection of DNA and label-free fluorescence nuclease assay based on the aggregation-induced emission of silole. Anal. Chem. 2008;80:6443–6448. doi: 10.1021/ac801020v. - DOI - PubMed
    1. Chen J.W., Law C.C.W., Lam J.W.Y., Dong Y., Lo S.M.F., Williams I.D., Zhu D., Tang B.Z. Synthesis, Light Emission, Nanoaggregation, and Restricted Intramolecular Rotation of 1, 1-Substituted 2, 3, 4, 5-Tetraphenylsiloles. Chem. Mater. 2003;15:1535. doi: 10.1021/cm021715z. - DOI
    1. Chen J.W., Xu B., Cao Y. Large blue shifted photoluminescence spectra of silole crystals relative to the amorphous form. Synth. Met. 2005;1522:49. doi: 10.1016/j.synthmet.2005.07.244. - DOI

LinkOut - more resources