. 2021 May 21;10(6):1042.
doi: 10.3390/plants10061042.

PEG-Induced Osmotic Stress Alters Root Morphology and Root Hair Traits in Wheat Genotypes

Affiliations

PEG-Induced Osmotic Stress Alters Root Morphology and Root Hair Traits in Wheat Genotypes

Arif Hasan Khan Robin et al. Plants (Basel). .

Abstract

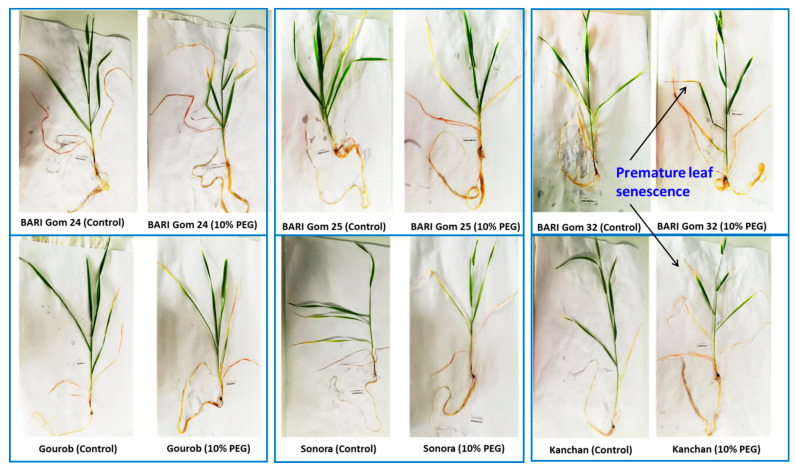
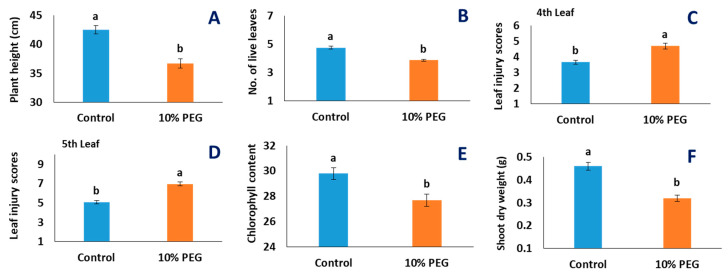
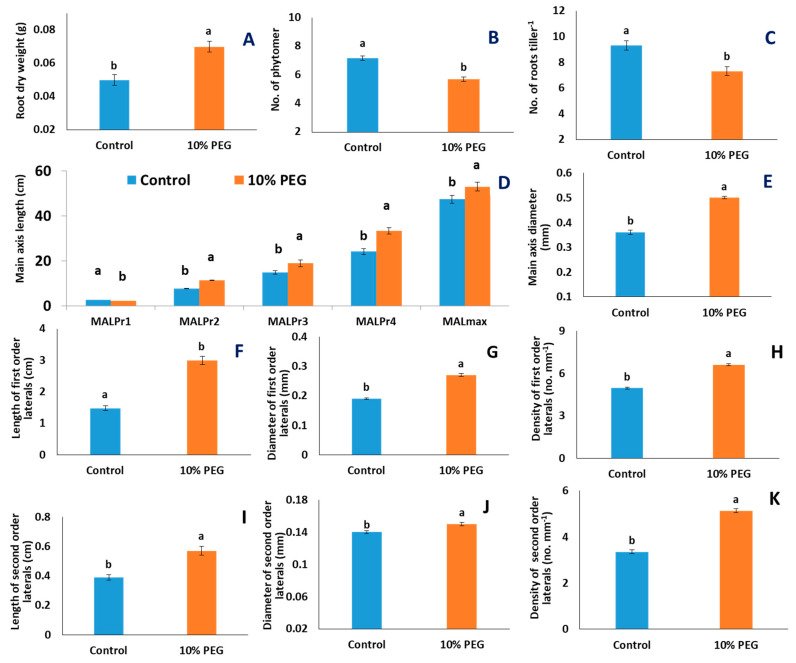
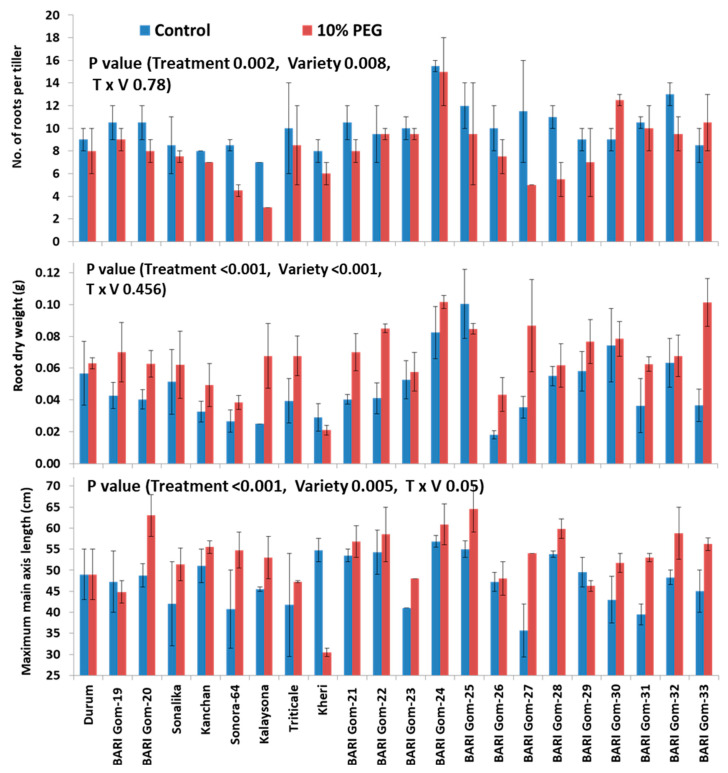
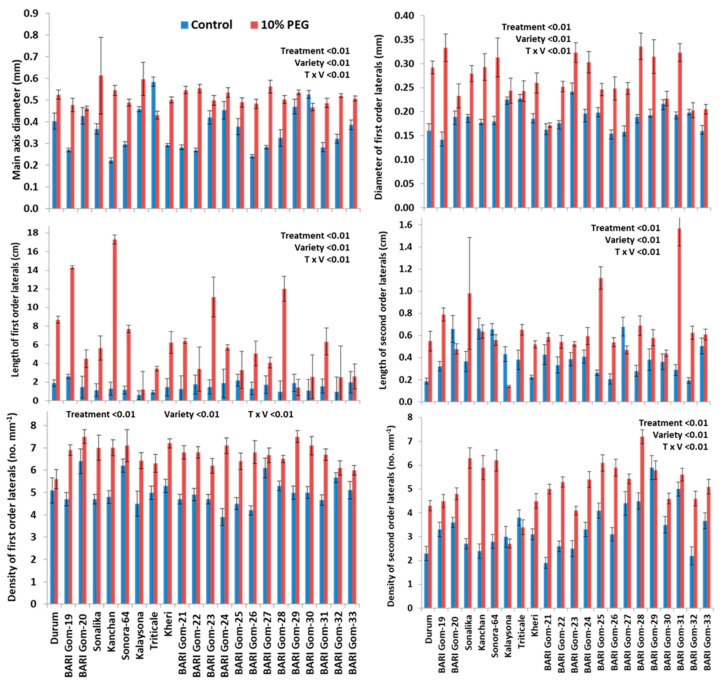
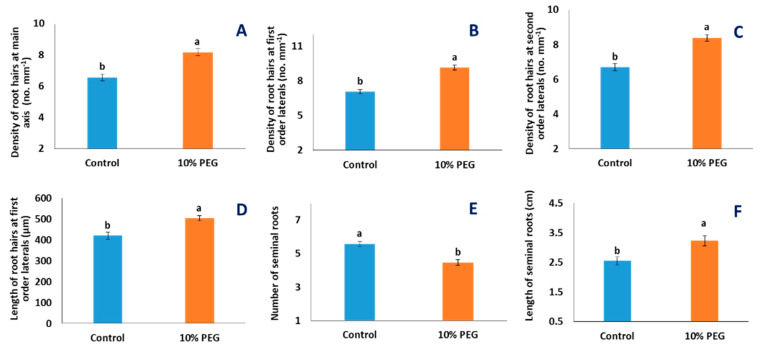
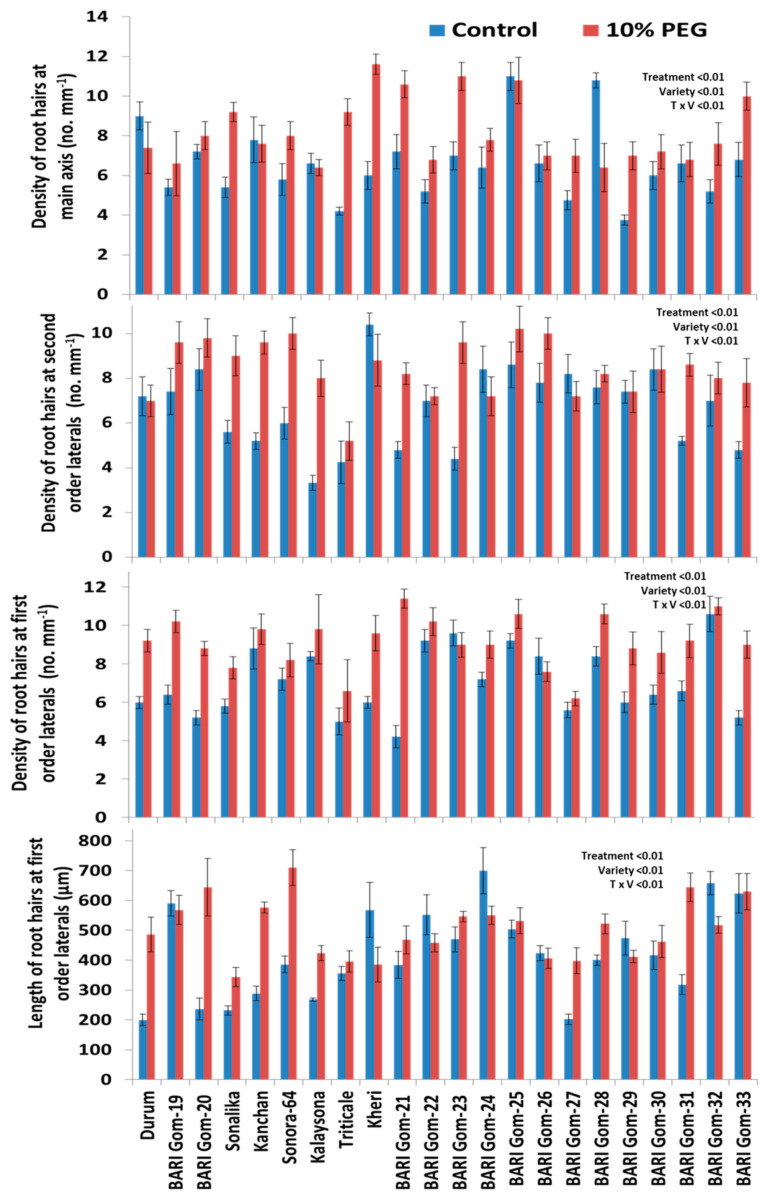
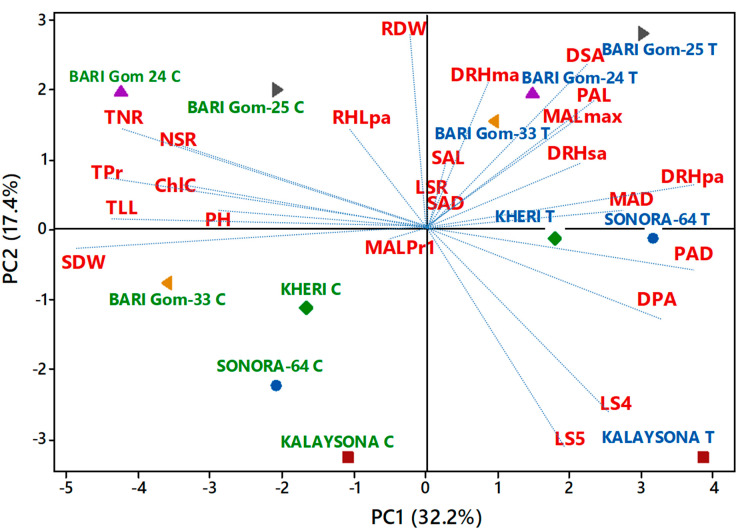
Wheat crop in drought-prone regions of Bangladesh suffers from osmotic stress. The objective of this study was to investigate the response of wheat genotypes with respect to root morphology and root hair traits under polyethylene glycol (PEG)-induced osmotic stress. A total of 22 genotypes of wheat were grown hydroponically and two treatments-0% and 10% PEG-were imposed at 14 days after germination. Plant growth was reduced in terms of plant height, number of live leaves per tiller, shoot dry weight, number of root-bearing phytomers, and roots per tiller. Notably, PEG-induced osmotic stress increased root dry weight per tiller by increasing length of the main axis and lateral roots, as well as the diameter and density of both lateral roots and root hairs of the individual roots. A biplot was drawn after a principal component analysis, taking three less-affected (high-yielding genotypes) and three highly affected (low-yielding genotypes and landrace) genotypes under 10% PEG stress, compared to control. Principal component 1 separated PEG-treated wheat genotypes from control-treated genotypes, with a high and positive coefficient for the density of lateral roots and root hairs, length and diameter of the main axis, and first-order lateral roots and leaf injury scores, indicating that these traits are associated with osmotic stress tolerance. Principal component 2 separated high-yielding and tolerant wheat genotypes from low-yielding and susceptible genotypes, with a high coefficient for root dry weight, density of root hairs and second-order lateral roots, length of the main axis, and first-order lateral roots. An increase in root dry weight in PEG-stress-tolerant wheat genotypes was achieved through an increase in length and diameter of the main axis and lateral roots. The information derived from this research could be exploited for identifying osmotic stress-tolerant QTL and for developing abiotic-tolerant cultivars of wheat.

Keywords: PEG; osmotic stress; principal component analysis; root traits; wheat.


Conflict of interest statement

The authors declare no conflict of interest.

Figures

Figure 1
Figure 1
Developmental stages of leaf and root-bearing phytomers (Pr) at the tiller axis of wheat plant in a stylized diagram. Pr, root-bearing phytomer. Blue lines represent seminal roots.
Figure 2
Figure 2
Effect of 10% PEG-induced osmotic stress on wheat genotypes, compared to control. Osmotic stress caused premature senescence of leaves in wheat genotypes.
Figure 3
Figure 3
Effects of PEG-induced osmotic stress on morphological traits of shoot of 22 wheat genotypes. Each data bar represents the average of 3 replicates from 22 genotypes: (A) plant height (cm); (B) total number of live leaves; (C) leaf injury scores for the fourth leaf; (D) leaf injury scores for the fifth leaf; (E) chlorophyll content; (F) shoot dry weight in g. The statistical significance was tested following a general linear model and a post hoc analysis was conducted following Tukey’s pairwise comparison. Letters ‘a’ and ‘b’ denote significant differences. Vertical bars indicate standard error of means.
Figure 4
Figure 4
Effects of PEG-induced osmotic stress on morphological traits of roots of 22 wheat genotypes. Each data bar in A, B–E, and F–L represents the average of 3, 2, and 10 replicates from 22 genotypes, respectively: (A) root dry weight (g); (B) number of root-bearing phytomers per tiller; (C) number of roots per tiller; (D) main axis length (MAL) at the root-bearing phytomer (Pr1–4) and maximum main axis length (MALmax); (E) main axis diameter; (FH) length (cm), diameter (mm), and density (no. mm−1) of first-order lateral roots; (IK) length (cm), diameter (mm), and density of second-order lateral roots (no. mm−1). The statistical significance was tested following a general linear model and a post hoc analysis was conducted following Tukey’s pairwise comparison. Letters ‘a’ and ‘b’ denote significant differences. Vertical bars indicate standard error of means.
Figure 5
Figure 5
Effects of PEG-induced osmotic stress on selected root traits of wheat genotypes. Each data bar represents average of three replicates for root dry weight and that of two replicates for number of roots per tiller and maximum main axis length. Vertical bars represent standard error of mean. The statistical significance was tested following a two-way ANOVA under a general linear model procedure.
Figure 6
Figure 6
Effects of PEG-induced osmotic stress on diameter of main axis and lateral root traits of 22 wheat genotypes. Each data bar represents average of 10 replicates. Vertical bars represent standard error of mean. The statistical significance was tested following a two-way ANOVA under a general linear model procedure.
Figure 7
Figure 7
Effects of PEG-induced osmotic stress on root hairs and seminal roots of 22 wheat genotypes. Each data bar in A–D, E, and F represents the average of 5, 2, and 10 replicates from 22 genotypes, respectively: (AC) density of root hairs of main axis, first-order, and second-order lateral roots; (D) length of second-order lateral roots; (E) number of seminal roots; and (F) length of seminal roots. The statistical significance was tested following a general linear model and a post hoc analysis was conducted following Tukey’s pairwise comparison. Letters ‘a’ and ‘b’ denote significant differences. Vertical bars indicate standard error of means.
Figure 8
Figure 8
Effects of PEG-induced osmotic stress on root hairs of 22 wheat genotypes. Each data bar represents the average of five replicates from 22 genotypes, respectively. The statistical significance was tested following a two-way ANOVA under a general linear model procedure. Vertical bars indicate standard error of means.
Figure 9
Figure 9
Biplot of root morphology and root hair traits of six wheat genotypes under two treatments (C, control, and T, 10% PEG). Data points indicate PC scores of each wheat genotype under each treatment: PH = plant height; TLL = total no. of live leaves; LS4 = leaf injury scores for the fourth leaf; LS5 = leaf injury scores for the fifth leaf; ChlC = chlorophyll content; SDW = shoot dry weight; RDW = root dry weight; TPr = total number of root-bearing phytomers per tiller; TNR = total number of roots per tiller; NSR = number of seminal roots; LSR = length of seminal roots; MALmax = maximum main axis length; MALPr1 = main root axis length at phytomer 1; MAD = main axis diameter; PAL = length of first-order lateral roots; PAD = diameter of first-order lateral roots; DPA = density of first-order lateral roots; SAL = length of second-order lateral roots; SAD = diameter of second-order lateral roots; DSA = density of second-order lateral roots; DRHMA = density of root hairs of main axis; DRHSA = density of root hairs of second-order lateral roots; DRHPA = density of root hairs of first-order lateral roots; RHLPA = length of root hairs of first-order lateral roots.
Figure 10
Figure 10
Measurements of root morphology and root hair traits: (a) length of second-order lateral roots; (b) diameter of second-order lateral roots; (c) density of root hairs of main axis; (d) length of a root hair.

References

    1. United States Department of Agriculture (USDA) World Agricultural Production. [(accessed on 20 January 2021)]; Available online: https://apps.fas.usda.gov/PSDOnline/Circulars/2019/10/production.pdf.
    1. Zhang J., Zhang S., Cheng M., Jiang H., Zhang X., Peng C., Jin J. Effect of drought on agronomic traits of rice and wheat: A meta-analysis. Int. J. Environ. Res. Pub. Health. 2018;15:839. doi: 10.3390/ijerph15050839. - DOI - PMC - PubMed
    1. Macharia G., Ngina B. Wheat in Kenya: Past and twenty-first century breeding. Wheat Improv. Manag. Utilizat. 2017;1 doi: 10.5772/67271. - DOI
    1. Zhao T., Dai A. Uncertainties in historical changes and future projections of drought. Part II: Model-simulated historical and future drought changes. Clim. Chan. 2017;144:535–548. doi: 10.1007/s10584-016-1742-x. - DOI
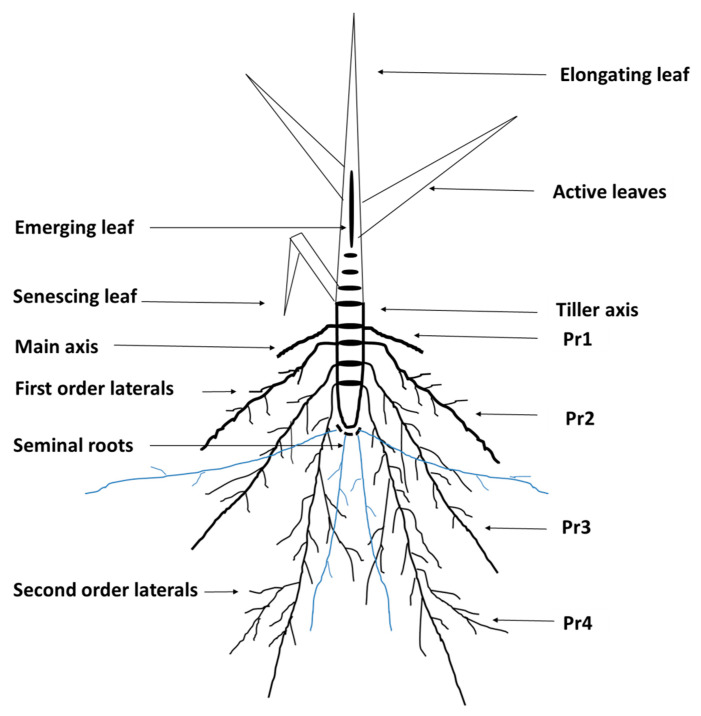
    1. Barlow P.W. Meristems, metamers and modules and the development of shoot and root systems. Bot. J. Linn. Soci. 1989;100:255–279. doi: 10.1111/j.1095-8339.1989.tb01721.x. - DOI

LinkOut - more resources