. 2021 May 4;10(5):1101.
doi: 10.3390/cells10051101.

HDAC8 Activates AKT through Upregulating PLCB1 and Suppressing DESC1 Expression in MEK1/2 Inhibition-Resistant Cells

Affiliations

HDAC8 Activates AKT through Upregulating PLCB1 and Suppressing DESC1 Expression in MEK1/2 Inhibition-Resistant Cells

Soon-Duck Ha et al. Cells. .

Abstract

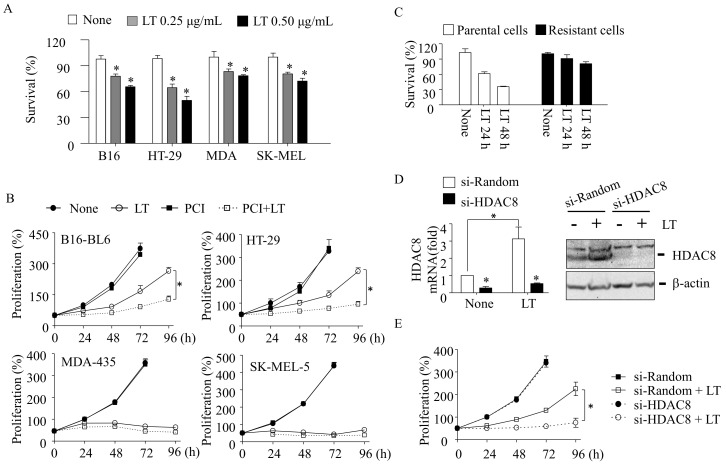
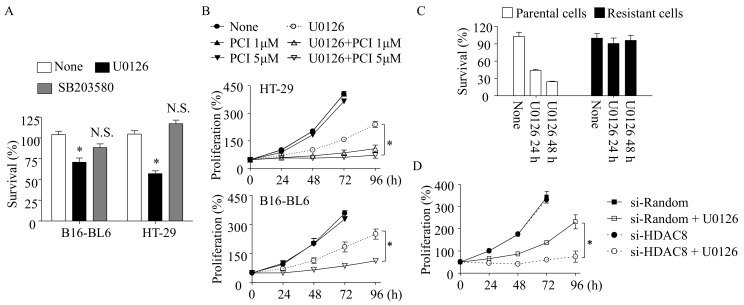
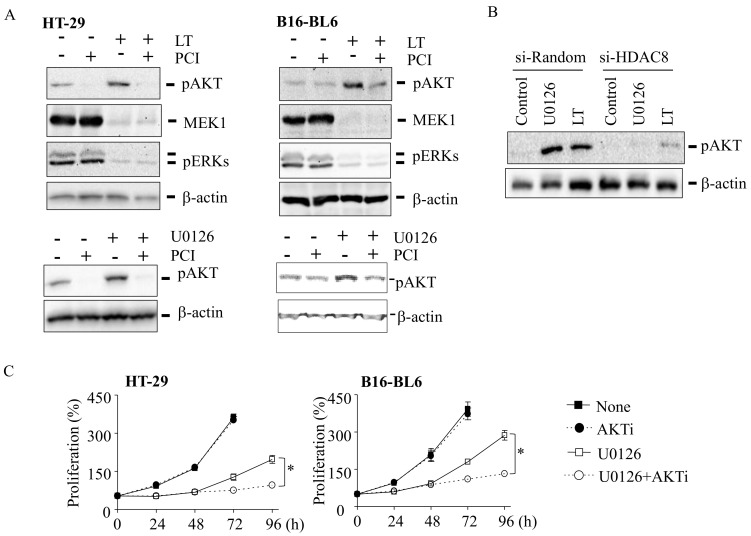
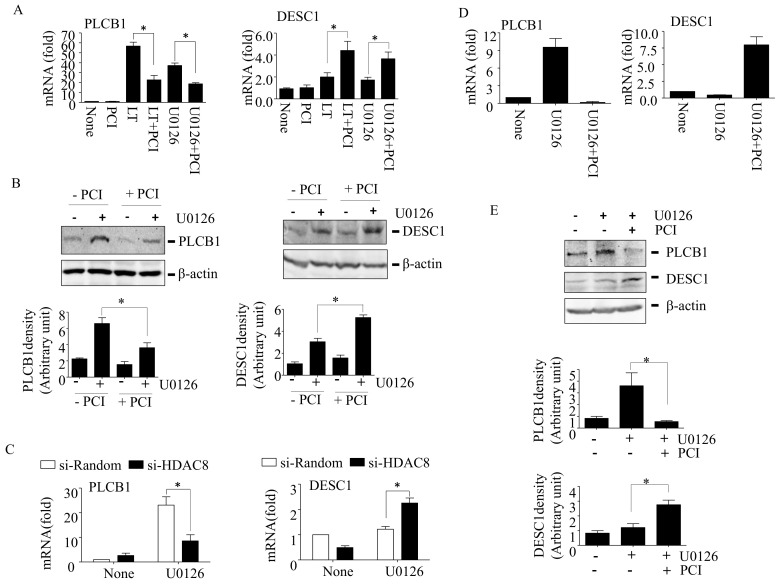
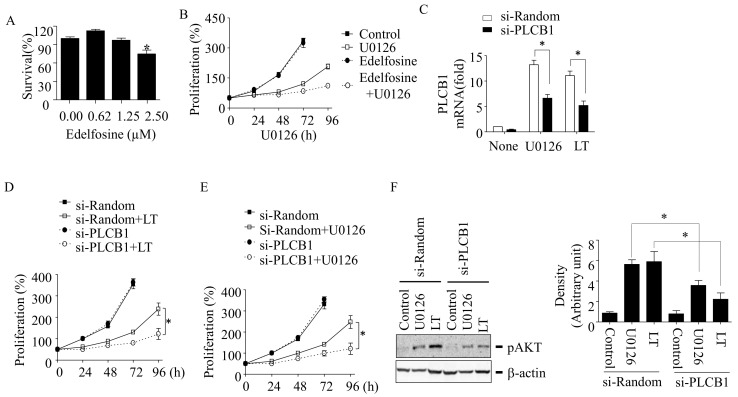
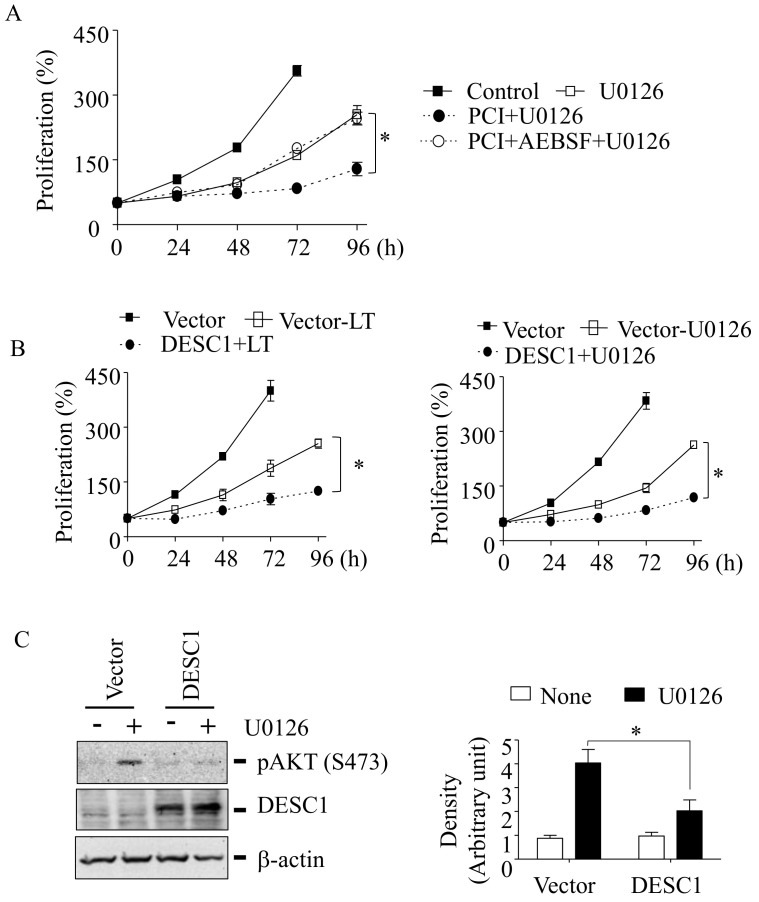
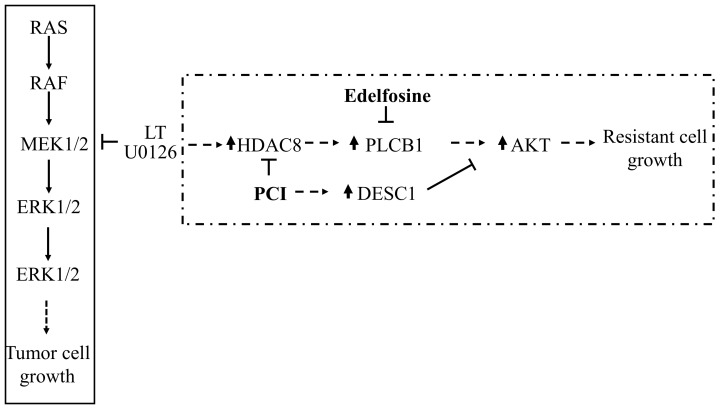
Inhibition of the RAF-MEK1/2-ERK signaling pathway is an ideal strategy for treating cancers with NRAS or BRAF mutations. However, the development of resistance due to incomplete inhibition of the pathway and activation of compensatory cell proliferation pathways is a major impediment of the targeted therapy. The anthrax lethal toxin (LT), which cleaves and inactivates MEKs, is a modifiable biomolecule that can be delivered selectively to tumor cells and potently kills various tumor cells. However, resistance to LT and the mechanism involved are yet to be explored. Here, we show that LT, through inhibiting MEK1/2-ERK activation, inhibits the proliferation of cancer cells with NRAS/BRAF mutations. Among them, the human colorectal tumor HT-29 and murine melanoma B16-BL6 cells developed resistance to LT in 2 to 3 days of treatment. These resistant cells activated AKT through a histone deacetylase (HDAC) 8-dependent pathway. Using an Affymetrix microarray, followed by qPCR validation, we identified that the differential expression of the phospholipase C-β1 (PLCB1) and squamous cell carcinoma-1 (DESC1) played an important role in HDAC8-mediated AKT activation and resistance to MEK1/2-ERK inhibition. By using inhibitors, small interference RNAs and/or expression vectors, we found that the inhibition of HDAC8 suppressed PLCB1 expression and induced DESC1 expression in the resistant cells, which led to the inhibition of AKT and re-sensitization to LT and MEK1/2 inhibition. These results suggest that targeting PLCB1 and DESC1 is a novel strategy for inhibiting the resistance to MEK1/2 inhibition.

Keywords: AKT; DESC1; HT-29 cells; PI-PLC; PLCB1; cancer; lethal toxin; resistance.


Conflict of interest statement

The authors declare no conflict of interest.

Figures

Figure 1
Figure 1
HDAC8 inhibition prevents a resistance to LT-induced cell cycle arrest in B16-BL6 melanoma and HT-29 colorectal cancer cells. (A) Cells were seeded in 96-well plates and treated with two different doses of LT (each PA and LF) for 24 h. (B) B16-BL6, HT-29, MDA-MB-435, and SK-MEL-5 cells were cultured with LT (500 ng/mL of each PA and LF) in the presence or absence of PCI-34051 (PCI: 1 µM) for the time indicated. (C) Resistance HT-29 cells were selected after treating LT for 72 h, and the surviving cells were replated and re-exposed to LT (500 ng/mL of each PA and LF) for the time indicated. (AC) Cell survival and proliferation were measured by the MTT assay. (D,E) HT-29 cells were transfected with random or HDAC8-specific siRNAs (64 nM) for 18 h. Cells were then cultured in the presence or absence of LT (500 ng/mL of each PA and LF) for 48 h (D) or for the time indicated (E). HDAC8 mRNA and the protein levels were measured by RT-qPCR ((D), left panel) and Western blotting using anti-HDAC8 and anti-β-actin (for the loading control) ((D), right panel). Cell proliferation was measured by the MTT assay (E). (AE) Data are expressed as means and ± SD (n ≥ 3; *, p < 0.05 by the Student’s t-test).
Figure 2
Figure 2
MEK1/2-ERK inhibition is involved in LT-induced cell cycle arrest in B16-BL6 and HT-29 cells. (A) B16-BL6 and HT-29 cells were seeded in 96-well plates for 18 h. Cells were then exposed to U0126 (12.5 µM) or SB203580 (12.5 µM) for 24 h, and cell survival was measured by the MTT assay. (B) Similarly, HT-29 (top panel) and B16-BL6 (bottom panel) cells were seeded in 96-well plates for 6 h. Cell were then treated with U0126 (12.5 µM) with or without PCI-34051 (PCI) for the time indicated. Cell proliferation was measured by the MTT assay. (C) Resistance HT-29 cells were selected after treating U0126 for 72 h. The surviving cells were replated and re-exposed to U0126 for the time indicated. Cell survival was measured by the MTT assay. (D) HT-29 cells were transfected with HDAC8 siRNA or random siRNA for 18 h and then treated with U0126 (12.5 µM) for the time indicated. Cell proliferation was measured by the MTT assay. (AD) Data are expressed as means and ± SD (n = 3; N.S., not significant; *, p < 0.05 by the Student’s t-test).
Figure 3
Figure 3
HDAC8 is required for AKT activation in LT- and U0126-resistant cells. (A) HT-29 and B16-BL6 cells were cultured with or without LT (500 ng/mL of each PA and LF, upper panel) or U0126 (12.5 µM, lower panel) together or without PCI-34051 (PCI: 5 µM) for 72 h. (B) HT-29 cells were transfected with random or HDAC8-targeting siRNAs for 18 h and then treated with LT (500 ng/mL of each PA and LF) or U0126 (12.5 µM) for 72 h. (A,B) AKT and ERK phosphorylation and MEK 1 cleavage were analyzed by Western blots. β-actin immunoblots were used for loading the controls. The Western blots shown are representative images of three independent experiments. (C) HT-29 and B16-BL6 cells were cultured in the presence or absence of U0126 (12.5 µM) for 48 h. Cells were further cultured with or without the AKT inhibitor (AKTi; 200 nM) for an additional 24 and 48 h. Cell proliferation was then measured by the MTT assay. Data are expressed as means and ± SD (n ≥ 3; *, p < 0.05 by the Student’s t-test).
Figure 4
Figure 4
HDAC8 regulates the PLCB1 and DESC1 expression in LT- and U0126-treated HT-29 and B16-BL6 cells. (A) HT-29 cells were treated with none, LT (500 ng/mL of each PA and LF), or U0126 (12.5 µM) with or without PCI-34051 (PCI; 5 µM) for 48 h. The expression of PLCB1 and DESC1 mRNAs was measured by qPCR. (B) HT-29 cells were treated with none or U0126 with or without PCI for 48 h. The expression of PLCB1 and DESC1 were examined by Western blotting. The Western blots shown are representative images of two to three independent experiments. (C) HT-29 cells were transfected with random or HDAC8 siRNAs for 18 h. Cells were then treated with none or U0126 (12.5 µM) for 48 h, and the mRNA expression was analyzed by qPCR. (D,E) B16-BL6 cells were treated with U0126 (12.5 µM) with or without PCI-34051 (PCI; 5 µM) for 48 h. The expression of PLCB1 and DESC1 were examined by qPCR (D) and Western blotting (E). The Western blots shown are representative images of two to three independent experiments. Immunoblot intensities of the phospho-AKT bands were analyzed using Image Lab 6.0 (Bio-Rad; Hercules, CA, USA), and the relative band intensities were normalized to those of β-actin (B,E). The bar graph data are expressed as the means and ± SD (n = 2 to 3; *, p < 0.05 by the Student’s t-test).
Figure 5
Figure 5
PLCB1 is required for resistance to LT and MEK1/2 inhibition in HT-29 cells. (A,B) Cells were seeded in 96-well plates and treated with various doses of edelfosine for 48 h (A) or treated with U0126 and/or edelfosine for the time indicated (B). Cell survival and proliferation were measured by the MTT assay. (CF) Cells were transfected with random- or PLCB1-targeting siRNA (64 nM) for 18 h and then further cultured in the presence or absence of U0126 (12.5 µM) or LT (500 ng/mL of each PA and LF) for 72 h (C) or for the time indicated (D,E). The PLCB1 mRNA expression was analyzed by qPCR (C), and cell proliferation was measured by the MTT assay (D,E). Data are expressed as means and ± SD (n ≥ 3; *, p < 0.05 by the Student’s t-test). The AKT phosphorylation at Ser473 was analyzed in cells treated with U0126 or LT for 72 h by Western blotting ((F), left panel). The Western blots shown are representative of three independent experiments. Immunoblot intensities of the phospho-AKT bands were analyzed using Image Lab 6.0 (Bio-Rad; Hercules, CA, USA), and the relative band intensities were normalized to those of β-actin ((F). right panel). Data are expressed as means and ± SD (n = 3; *, p < 0.05 by the Student’s t-test).
Figure 6
Figure 6
The high expression of DESC1 prevents AKT activation and resistance to LT and MEK1/2 inhibition in HT-29 cells. (A) HT-29 cells were plated in 96-well plates, as described above (Figure 5B) and cultured in the absence or presence of AEBSF or U0126 or PCI + U0126 or PCI + AEBSF + U0126 for the time indicated. Cell proliferation was measured by the MTT assay. Data are expressed as means and ± SD (n ≥ 3; *, p < 0.05 by the Student’s t-test). (B) HT-29 cells were transfected with a control vector or DESC1 plasmid using lipofectamine 2000 or lipofectamine 3000 for 18 h and replated to 96-well plates, followed by a treatment of LT (500-ng/mL PA or 500-ng/mL LF) or U0126 (12.5 µM) for the time indicated. Cell proliferation was measured by the MTT assay. (C) Similarly, HT-29 cells were transfected with the control vector or DESC1 plasmid. Cells were then cultured with or without U0126 (12.5 µM) for 72 h. AKT phosphorylation was analyzed by immunoblotting using the phospho-AKTser473 antibody (top blot in the left panel), and DESC1 overexpression was confirmed by Western blotting using DESC1 antibody (middle blot in the left panel). The immunoblot against β-actin was used for the loading control (bottom blot in the left panel). The results are representative blots from three independent experiments. The immunoreactivities against phospho-AKT were analyzed using Image Lab 6.0 (Bio-Rad; Hercules, CA, USA), and the relative immunoreactivity to phospho-AKT (Ser 473) was normalized to those of β-actin. Data are expressed as means and ± SD (n = 3; *, p < 0.05 by the Student’s t-test).
Figure 7
Figure 7
Schematic presentation of the signaling pathways for tumor cell growth and the resistance mechanism proposed. Mutations in NRAS and BRAF lead to tumor cell growth through activating the MEK1/2-ERK pathway. LT and U0126 inhibit MEK1/2 and prevent tumor cell growth (solid box). However, the inhibition of MEK1/2 by LT or U0126 can lead to an HDAC8-dependent cell proliferation pathway that activates AKT through enhancing the PLCB1 expression in a low-DESC1 background (dotted box). The inhibition of HDAC8 can lead to the suppression of PLCB1 expression and induction of DESC1 expression, both of which cooperatively inhibit AKT activation and a resistance to MEK1/2 inhibition.

Similar articles

Cited by

References

    1. Santarpia L., Lippman S.M., El-Naggar A.K. Targeting the mapk-ras-raf signaling pathway in cancer therapy. Expert. Opin. Ther. Targets. 2012;16:103–119. doi: 10.1517/14728222.2011.645805. - DOI - PMC - PubMed
    1. Lee S., Rauch J., Kolch W. Targeting mapk signaling in cancer: Mechanisms of drug resistance and sensitivity. Int. J. Mol. Sci. 2020;21:1102. doi: 10.3390/ijms21031102. - DOI - PMC - PubMed
    1. Proietti I., Skroza N., Bernardini N., Tolino E., Balduzzi V., Marchesiello A., Michelini S., Volpe S., Mambrin A., Mangino G., et al. Mechanisms of acquired braf inhibitor resistance in melanoma: A systematic review. Cancers. 2020;12:2801. doi: 10.3390/cancers12102801. - DOI - PMC - PubMed
    1. Lovly C.M., Shaw A.T. Molecular pathways: Resistance to kinase inhibitors and implications for therapeutic strategies. Clin. Cancer Res. 2014;20:2249–2256. doi: 10.1158/1078-0432.CCR-13-1610. - DOI - PMC - PubMed
    1. Noeparast A., Giron P., Noor A., Bahadur Shahi R., De Brakeleer S., Eggermont C., Vandenplas H., Boeckx B., Lambrechts D., De Greve J., et al. Craf mutations in lung cancer can be oncogenic and predict sensitivity to combined type ii raf and mek inhibition. Oncogene. 2019;38:5933–5941. doi: 10.1038/s41388-019-0866-7. - DOI - PMC - PubMed

Publication types

MeSH terms