

EEG Fractal Analysis Reflects Brain Impairment after Stroke
- PMID: 34064732
- PMCID: PMC8150817
- DOI: 10.3390/e23050592
EEG Fractal Analysis Reflects Brain Impairment after Stroke
Abstract
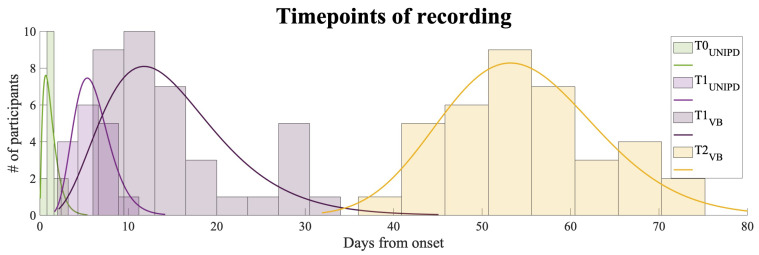
Stroke is the commonest cause of disability. Novel treatments require an improved understanding of the underlying mechanisms of recovery. Fractal approaches have demonstrated that a single metric can describe the complexity of seemingly random fluctuations of physiological signals. We hypothesize that fractal algorithms applied to electroencephalographic (EEG) signals may track brain impairment after stroke. Sixteen stroke survivors were studied in the hyperacute (<48 h) and in the acute phase (∼1 week after stroke), and 35 stroke survivors during the early subacute phase (from 8 days to 32 days and after ∼2 months after stroke): We compared resting-state EEG fractal changes using fractal measures (i.e., Higuchi Index, Tortuosity) with 11 healthy controls. Both Higuchi index and Tortuosity values were significantly lower after a stroke throughout the acute and early subacute stage compared to healthy subjects, reflecting a brain activity which is significantly less complex. These indices may be promising metrics to track behavioral changes in the very early stage after stroke. Our findings might contribute to the neurorehabilitation quest in identifying reliable biomarkers for a better tailoring of rehabilitation pathways.
Keywords: EEG; fractal analysis; neurophysiology; neuroplasticity; stroke.
Conflict of interest statement
The authors declare no conflict of interest. The funders had no role in the design of the study; in the collection, analyses, or interpretation of data; in the writing of the manuscript, or in the decision to publish the results.
Figures


Similar articles
-
Fractal dimension of EEG activity senses neuronal impairment in acute stroke.PLoS One. 2014 Jun 26;9(6):e100199. doi: 10.1371/journal.pone.0100199. eCollection 2014. PLoS One. 2014. PMID: 24967904 Free PMC article.
-
Comparing Neuroplasticity Changes Between High and Low Frequency Gait Training in Subacute Stroke: Protocol for a Randomized, Single-Blinded, Controlled Study.JMIR Res Protoc. 2022 Jan 28;11(1):e27935. doi: 10.2196/27935. JMIR Res Protoc. 2022. PMID: 35089146 Free PMC article.
-
Changes in electroencephalography complexity and functional magnetic resonance imaging connectivity following robotic hand training in chronic stroke.Top Stroke Rehabil. 2021 May;28(4):276-288. doi: 10.1080/10749357.2020.1803584. Epub 2020 Aug 17. Top Stroke Rehabil. 2021. PMID: 32799771
-
Brain entropy, fractal dimensions and predictability: A review of complexity measures for EEG in healthy and neuropsychiatric populations.Eur J Neurosci. 2022 Oct;56(7):5047-5069. doi: 10.1111/ejn.15800. Epub 2022 Sep 2. Eur J Neurosci. 2022. PMID: 35985344 Free PMC article. Review.
-
Efficacy of robotic exoskeleton for gait rehabilitation in patients with subacute stroke : a systematic review.Eur J Phys Rehabil Med. 2022 Feb;58(1):1-8. doi: 10.23736/S1973-9087.21.06846-5. Epub 2021 Jul 12. Eur J Phys Rehabil Med. 2022. PMID: 34247470 Free PMC article.
Cited by
-
Monitoring the after-effects of ischemic stroke through EEG microstates.PLoS One. 2024 Mar 22;19(3):e0300806. doi: 10.1371/journal.pone.0300806. eCollection 2024. PLoS One. 2024. PMID: 38517874 Free PMC article.
-
Frequency-tuned electromagnetic field therapy improves post-stroke motor function: A pilot randomized controlled trial.Front Neurol. 2022 Nov 14;13:1004677. doi: 10.3389/fneur.2022.1004677. eCollection 2022. Front Neurol. 2022. PMID: 36452175 Free PMC article.
-
Experimental protocol to investigate cortical, muscular and body representation alterations in adolescents with idiopathic scoliosis.PLoS One. 2023 Oct 12;18(10):e0292864. doi: 10.1371/journal.pone.0292864. eCollection 2023. PLoS One. 2023. PMID: 37824513 Free PMC article.
-
EEG Microstates as a Signature of Hemispheric Lateralization in Stroke.Brain Topogr. 2024 May;37(3):475-478. doi: 10.1007/s10548-023-00967-8. Epub 2023 May 17. Brain Topogr. 2024. PMID: 37195492 Free PMC article.
-
Post-stroke spontaneous motor recovery in mice can be predicted from acute-phase local field potential using machine learning.APL Bioeng. 2025 Apr 22;9(2):026108. doi: 10.1063/5.0263191. eCollection 2025 Jun. APL Bioeng. 2025. PMID: 40270920 Free PMC article.
References
-
- Bernhardt J., Hayward K.S., Kwakkel G., Ward N.S., Wolf S.L., Borschmann K., Krakauer J.W., Boyd L.A., Carmichael S.T., Corbett D., et al. Agreed definitions and a shared vision for new standards in stroke recovery research: The stroke recovery and rehabilitation roundtable taskforce. Int. J. Stroke. 2017;12:444–450. doi: 10.1177/1747493017711816. - DOI - PubMed
Grants and funding
LinkOut - more resources
Full Text Sources
